Task Performance
In this section I will examine the extent to which ‘emotion processing’ activity in the target boundaries is associated with the task performance measures (task accuracy and response time).
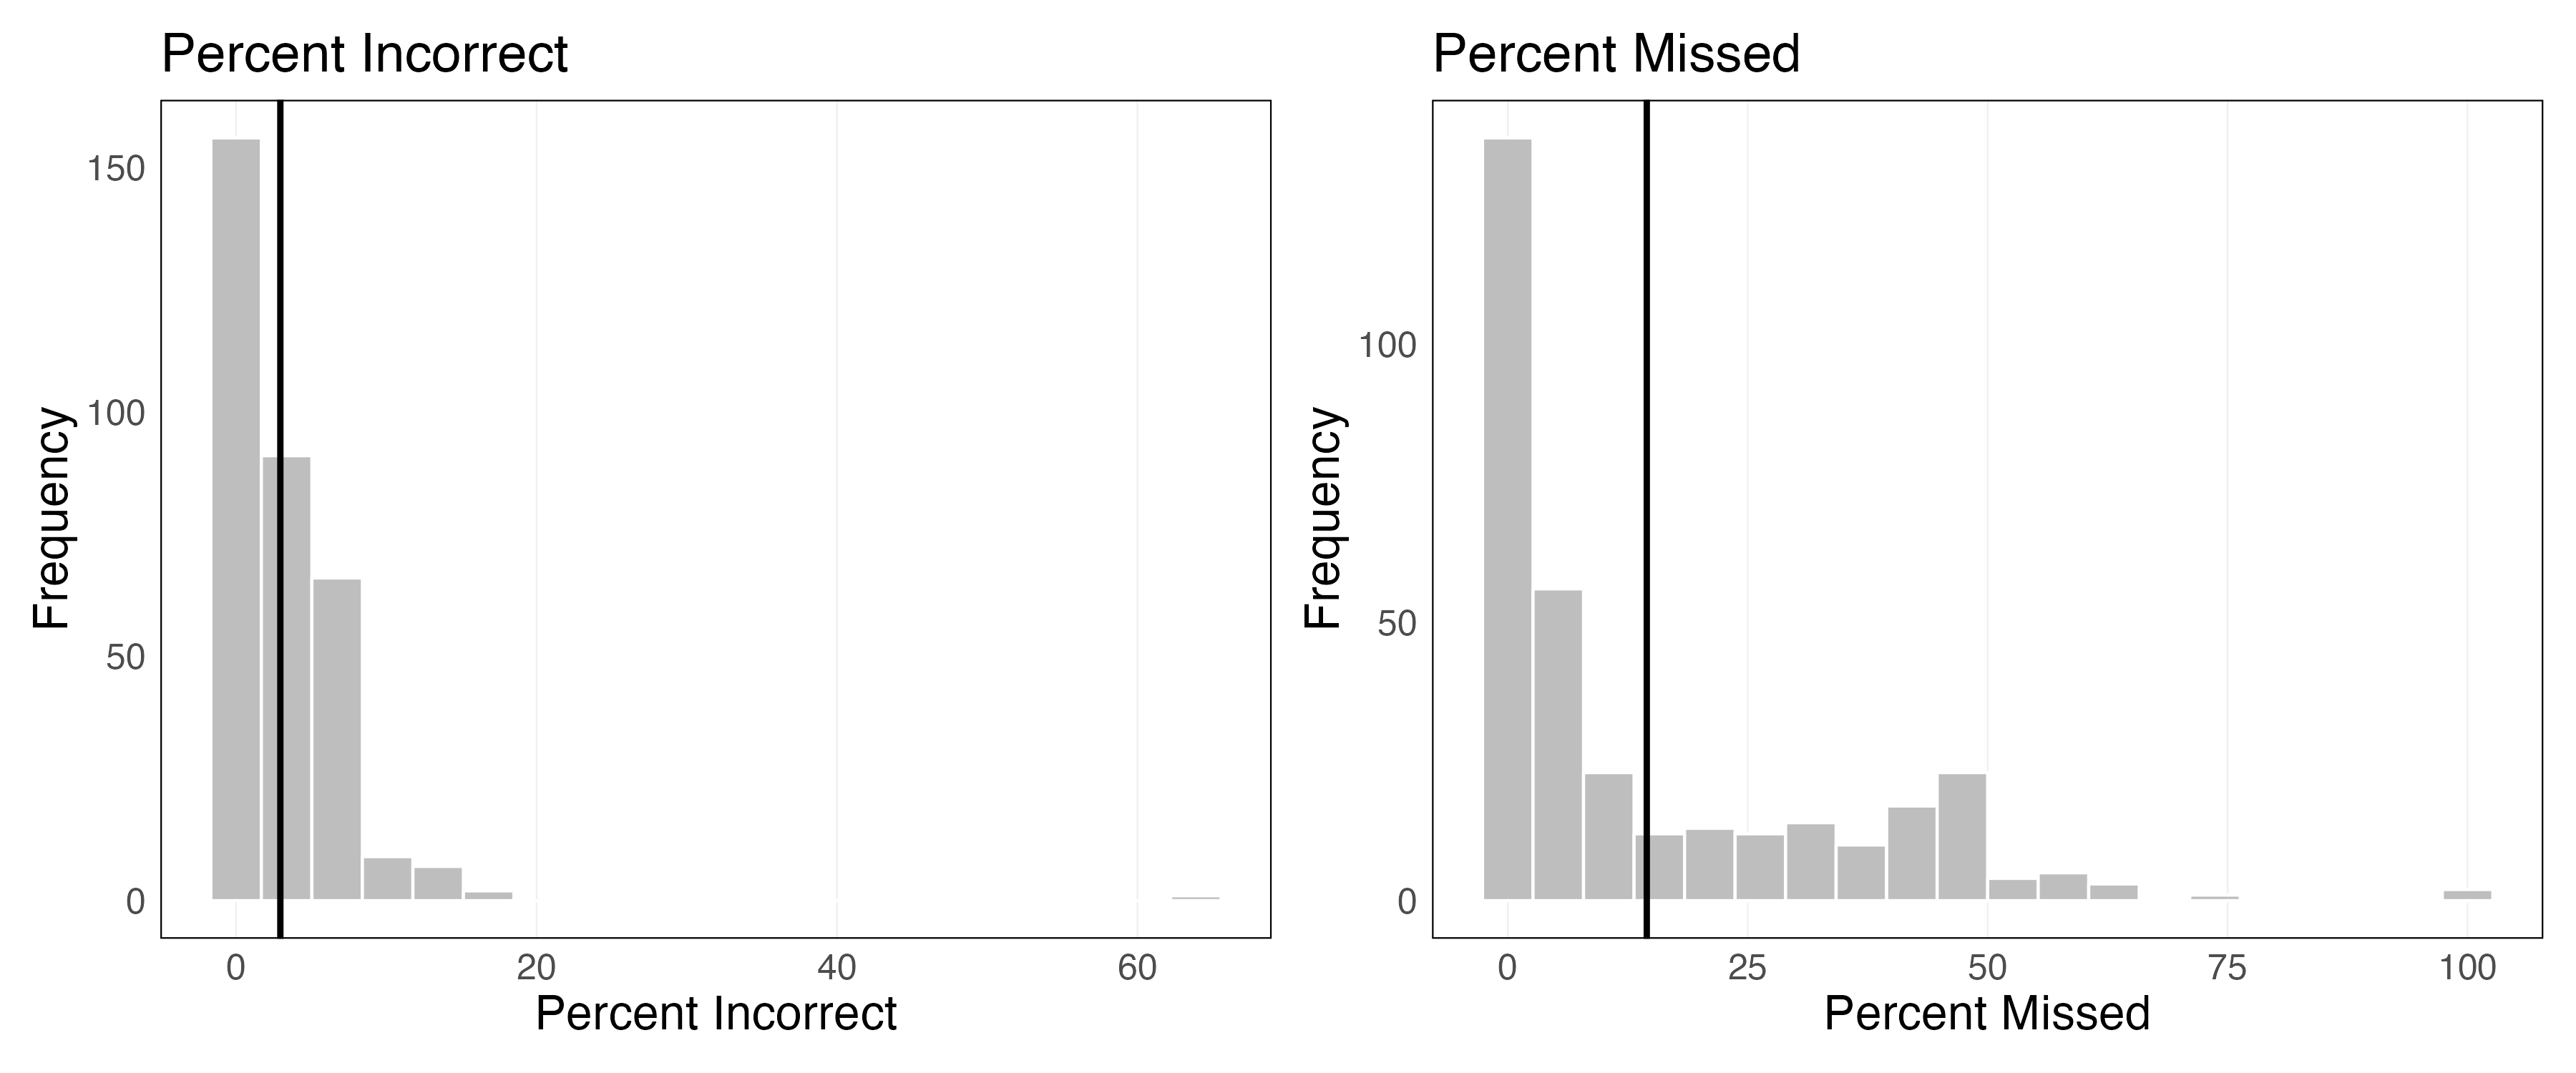
The emotion processing task involved subjects making a button press to identify which stimuli matched a target image displayed at the top of the screen. This button press was designed to ensure subjects were attending to the task and also to provide a contrast setting where passive ‘emotion processing’ activity could be dissociated. This button press provides the opportunity to evaluate two different task performance measures: task accuracy and response time. Task accuracy is measured as the percentage of trials in which the subject correctly matched the target face or shape (aka. percent correct). Response time is measured as the time it took the subject to make a response during the task.
Task Accuracy
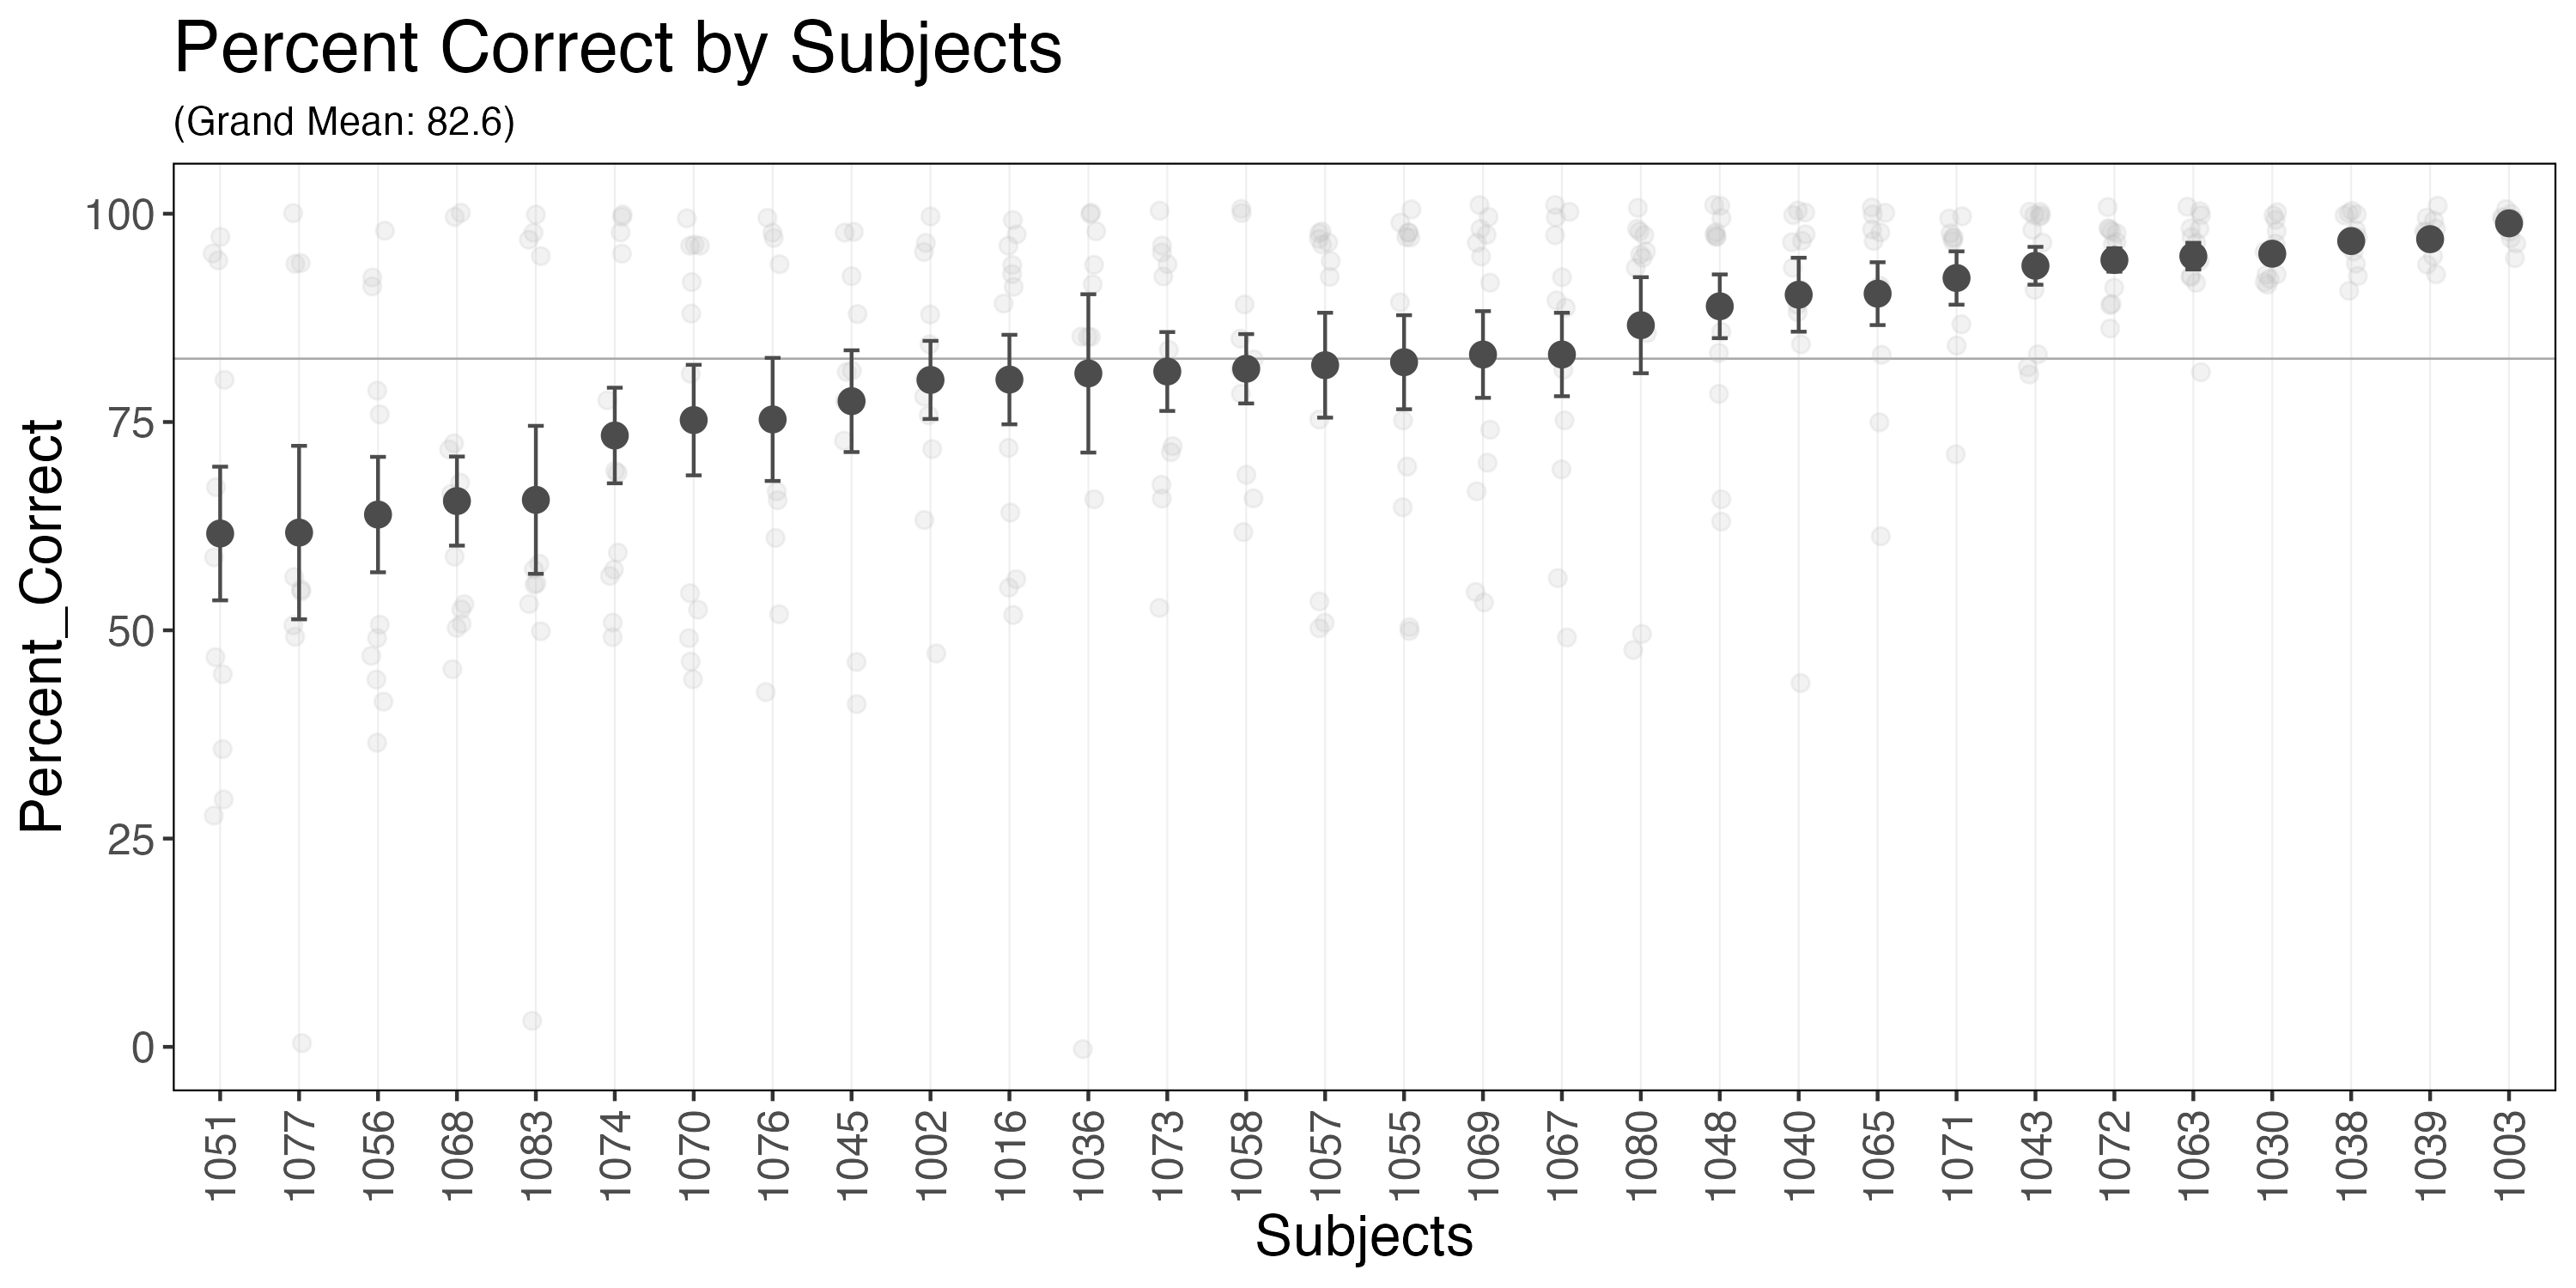
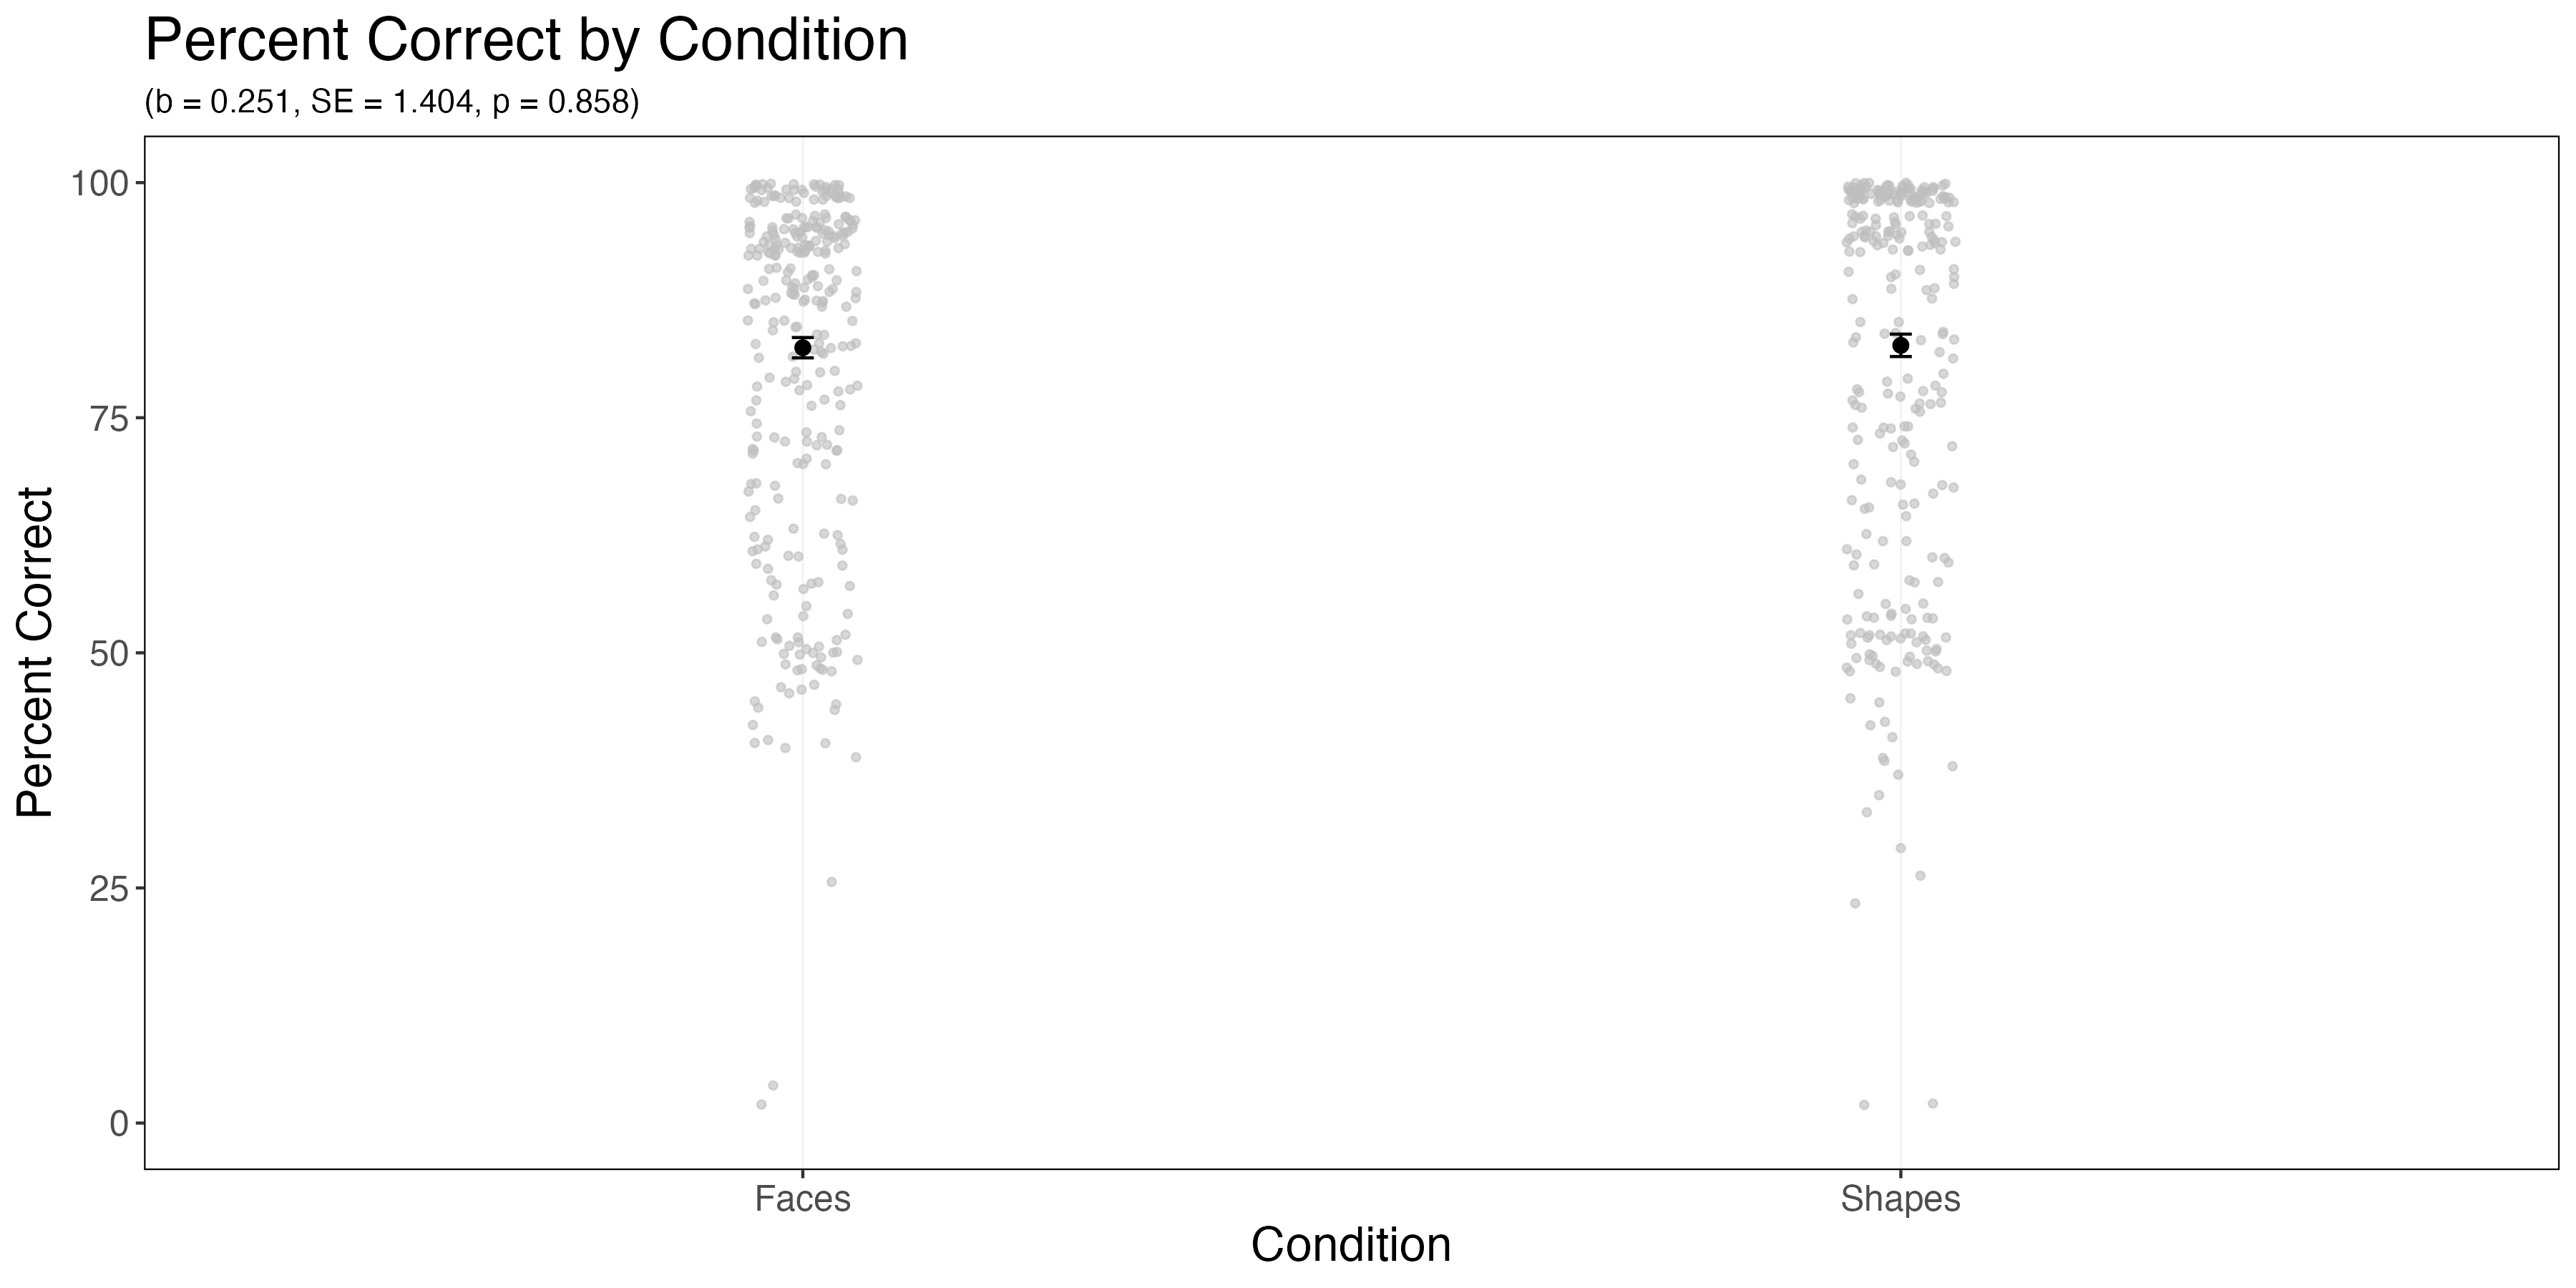
The emotion processing task is an extremely easy task, with subjects performance at an average of 83%. 55% of subjects performed at 90% accuracy or higher on average across both conditions. There was not a significant difference in task accuracy across the two conditions (faces and shapes) (b = 0.251, SE = 1.404, p = 0.858).
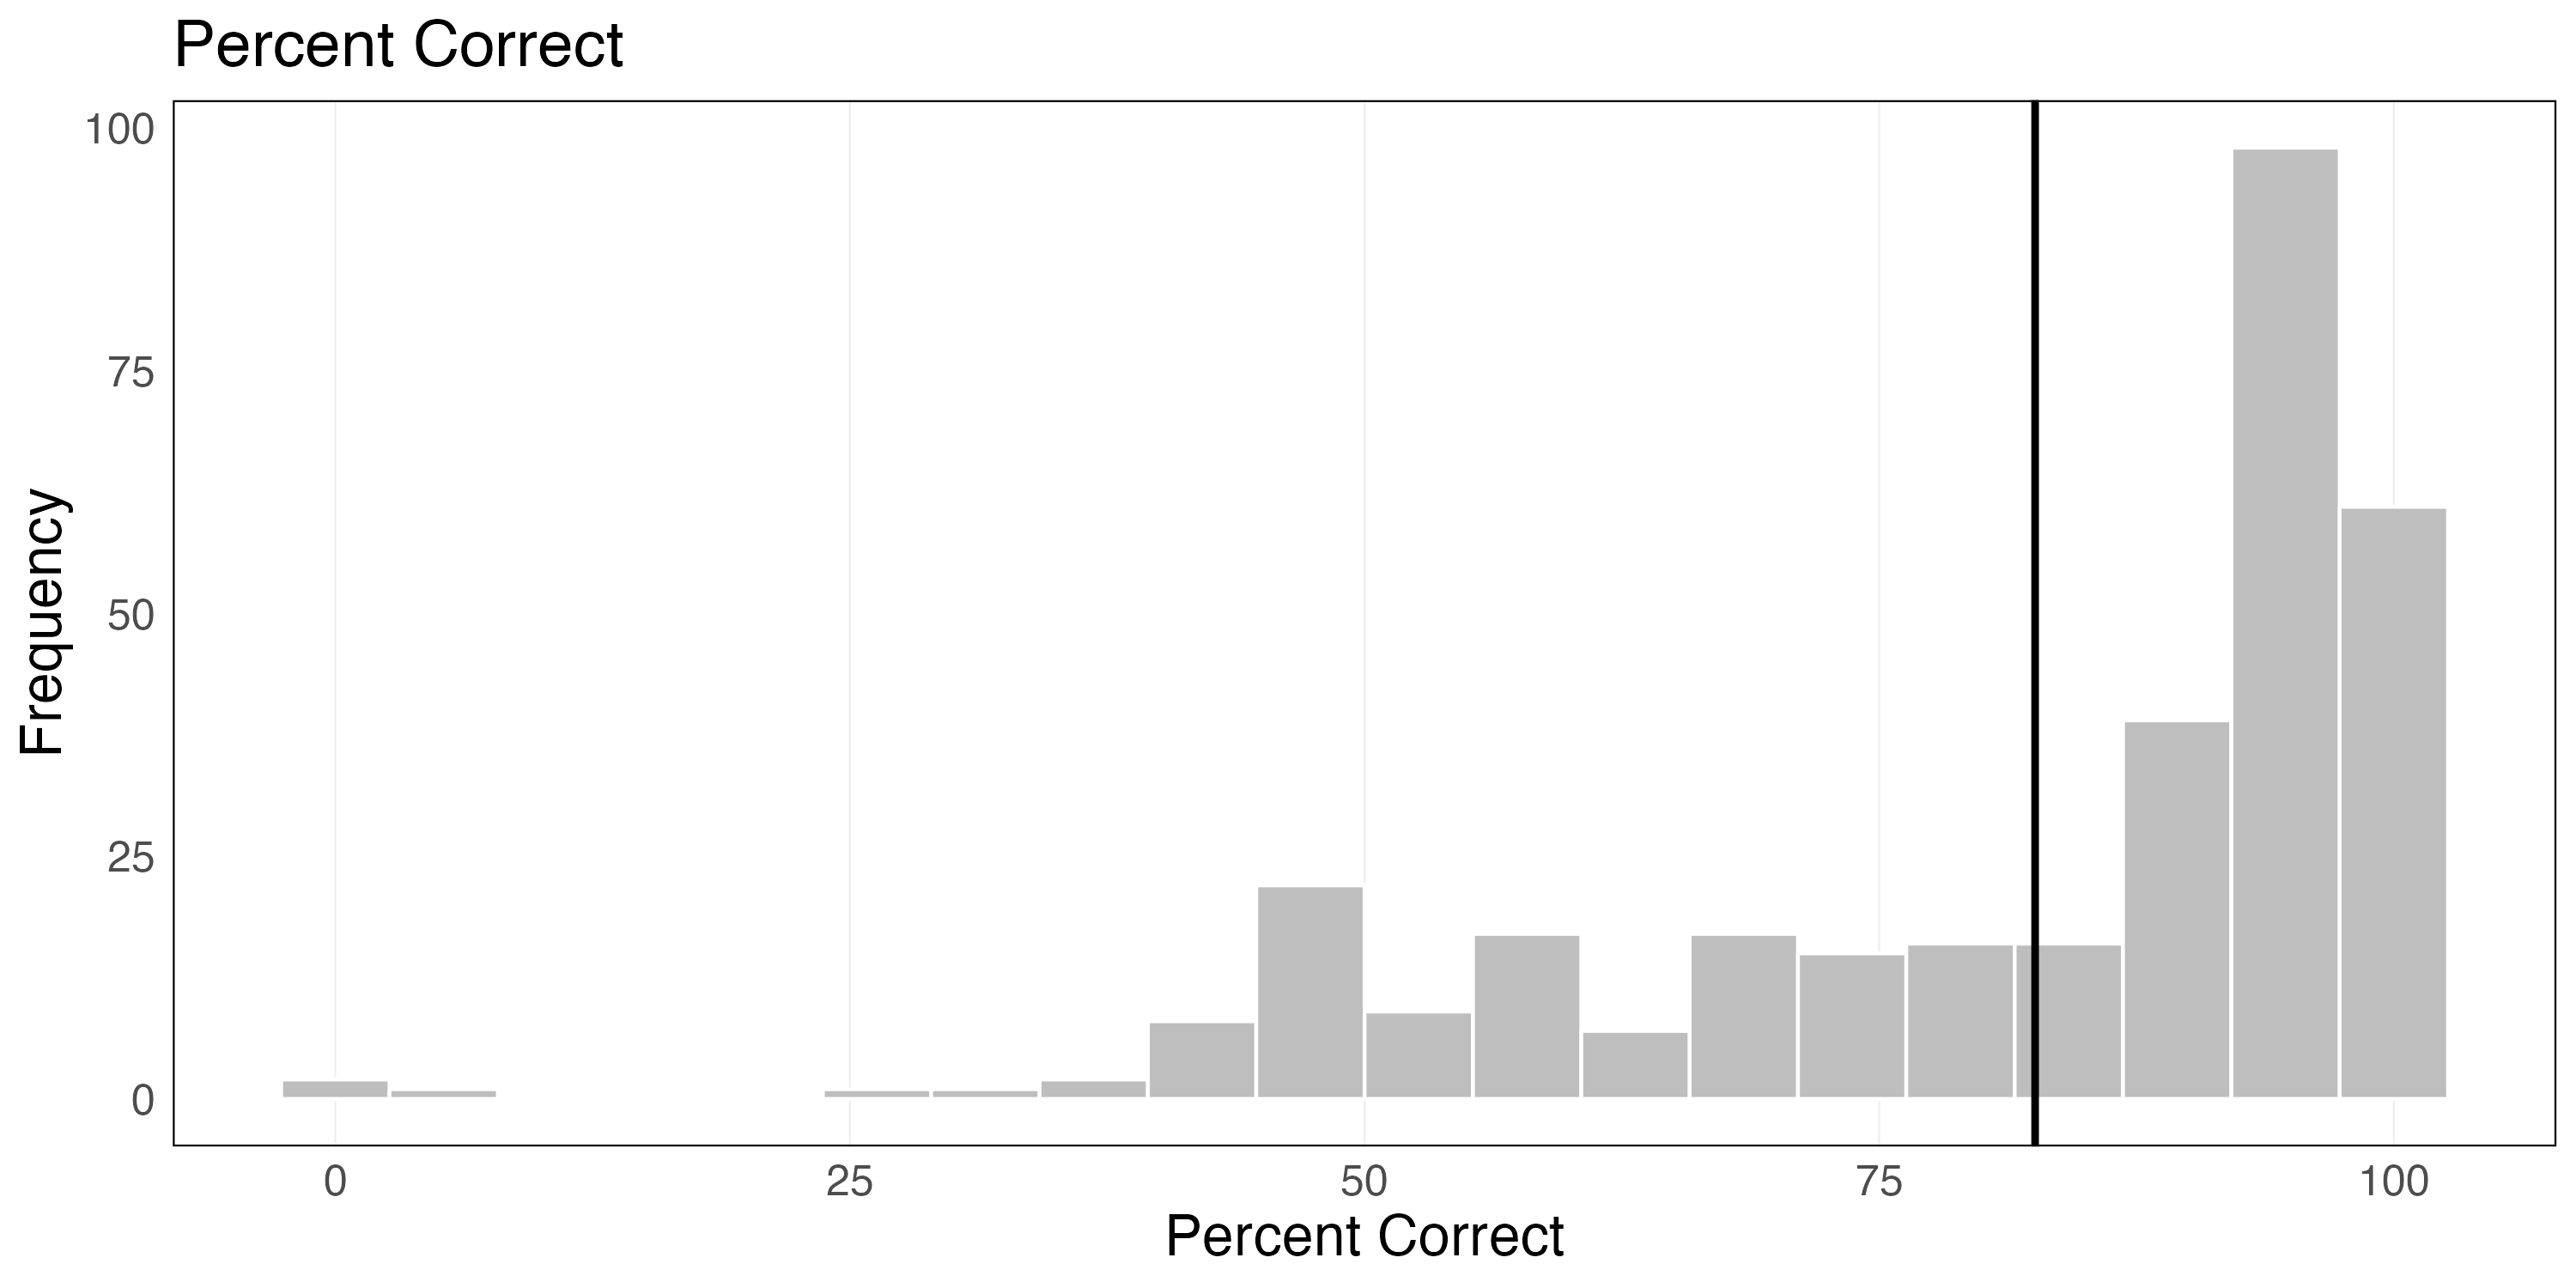
The observed ceiling effects makes it difficult to observe any meaningful associations between task accuracy and ‘emotion processing’ activity as there is limited variability in accuracy. However, I will still examine the extent to which task accuracy is associated with activity in the target boundaries.
Associations Between Activity and Task Accuracy
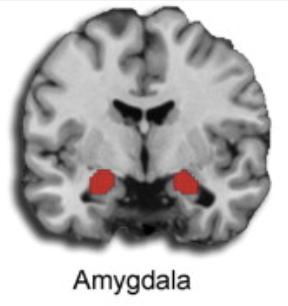
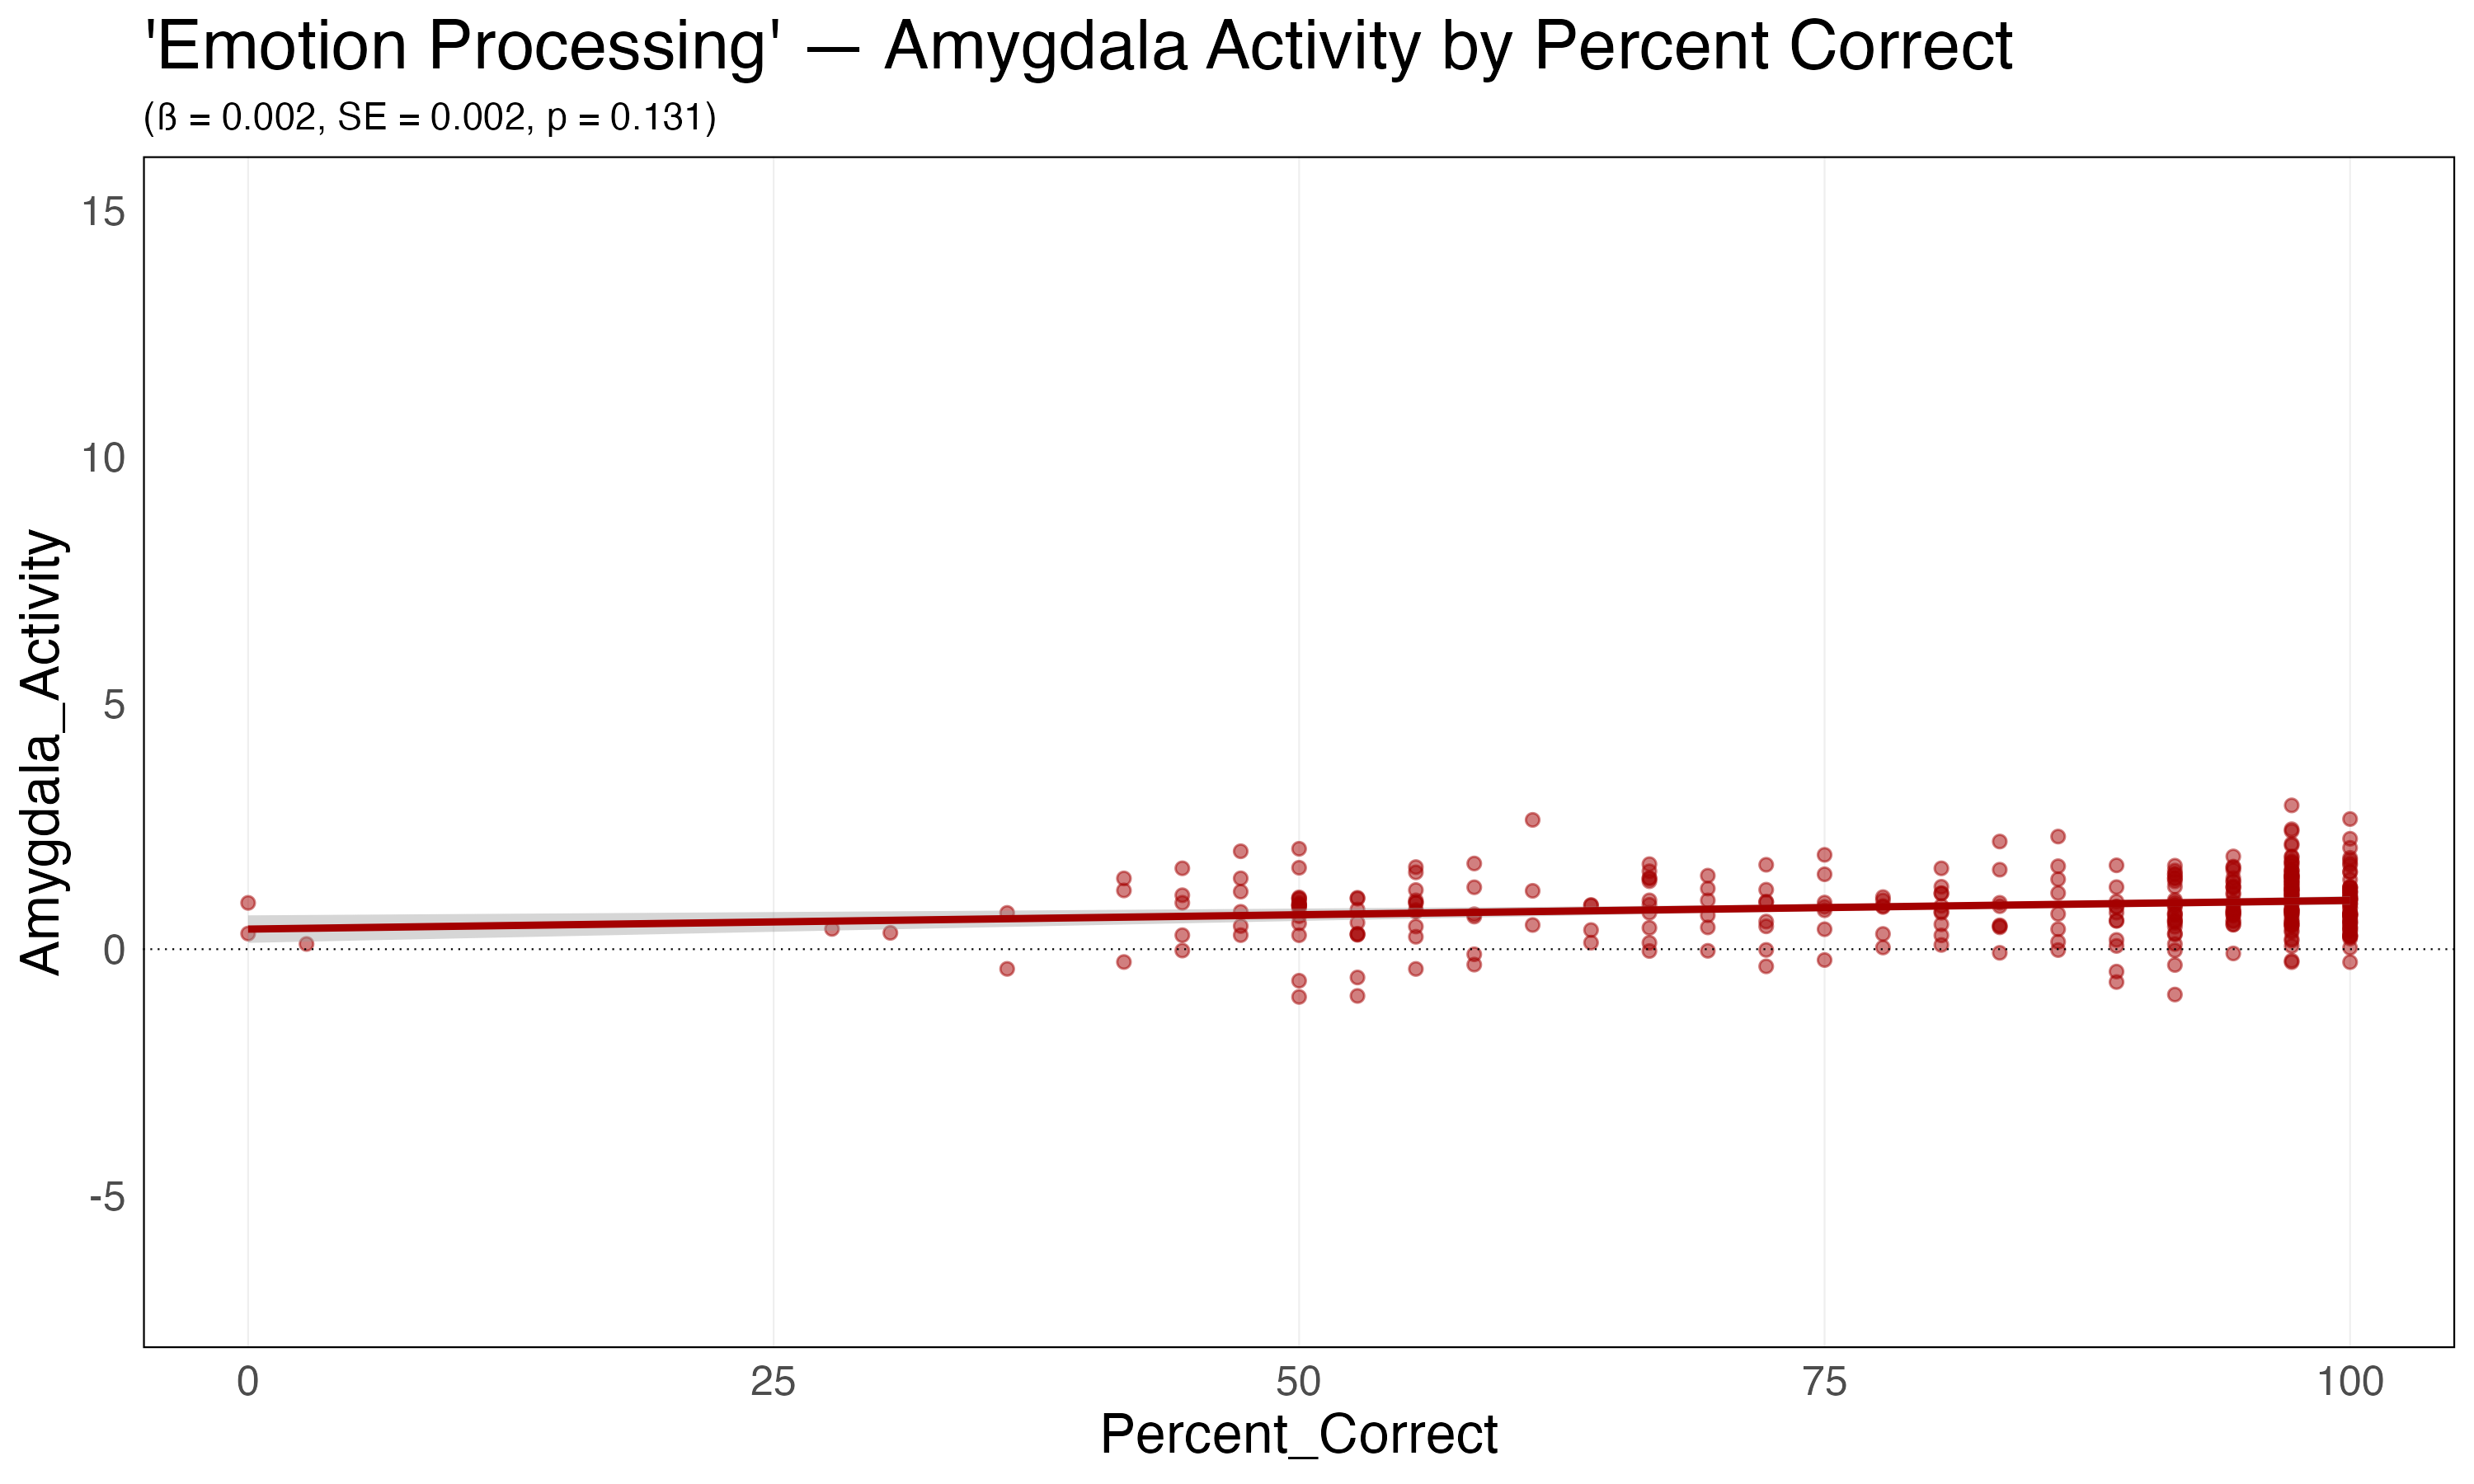

Amygdala. Amygdala activity was not associated with task accuracy (b = 0.002, SE = 0.002, p = 0.13).
Left and Right Fusiform. Both left and right fusiform activity was positively associated with task accuracy, such that higher accuracy was associated with higher activity (right fusiform: b = 0.011, SE = 0.004, p = 0.003, left fusiform: b = 0.011, SE = 0.004, p = 0.009).
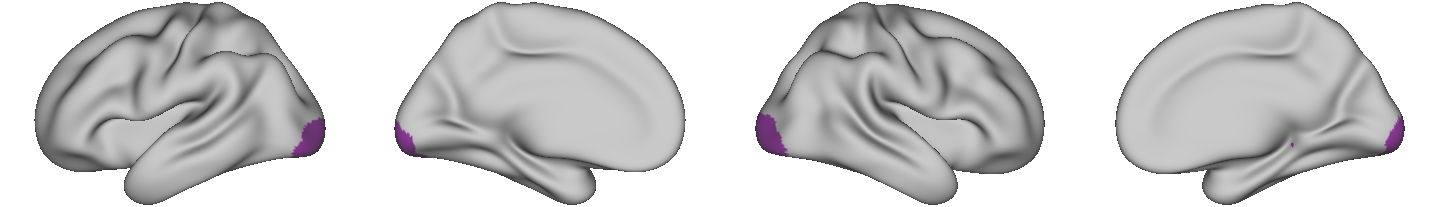
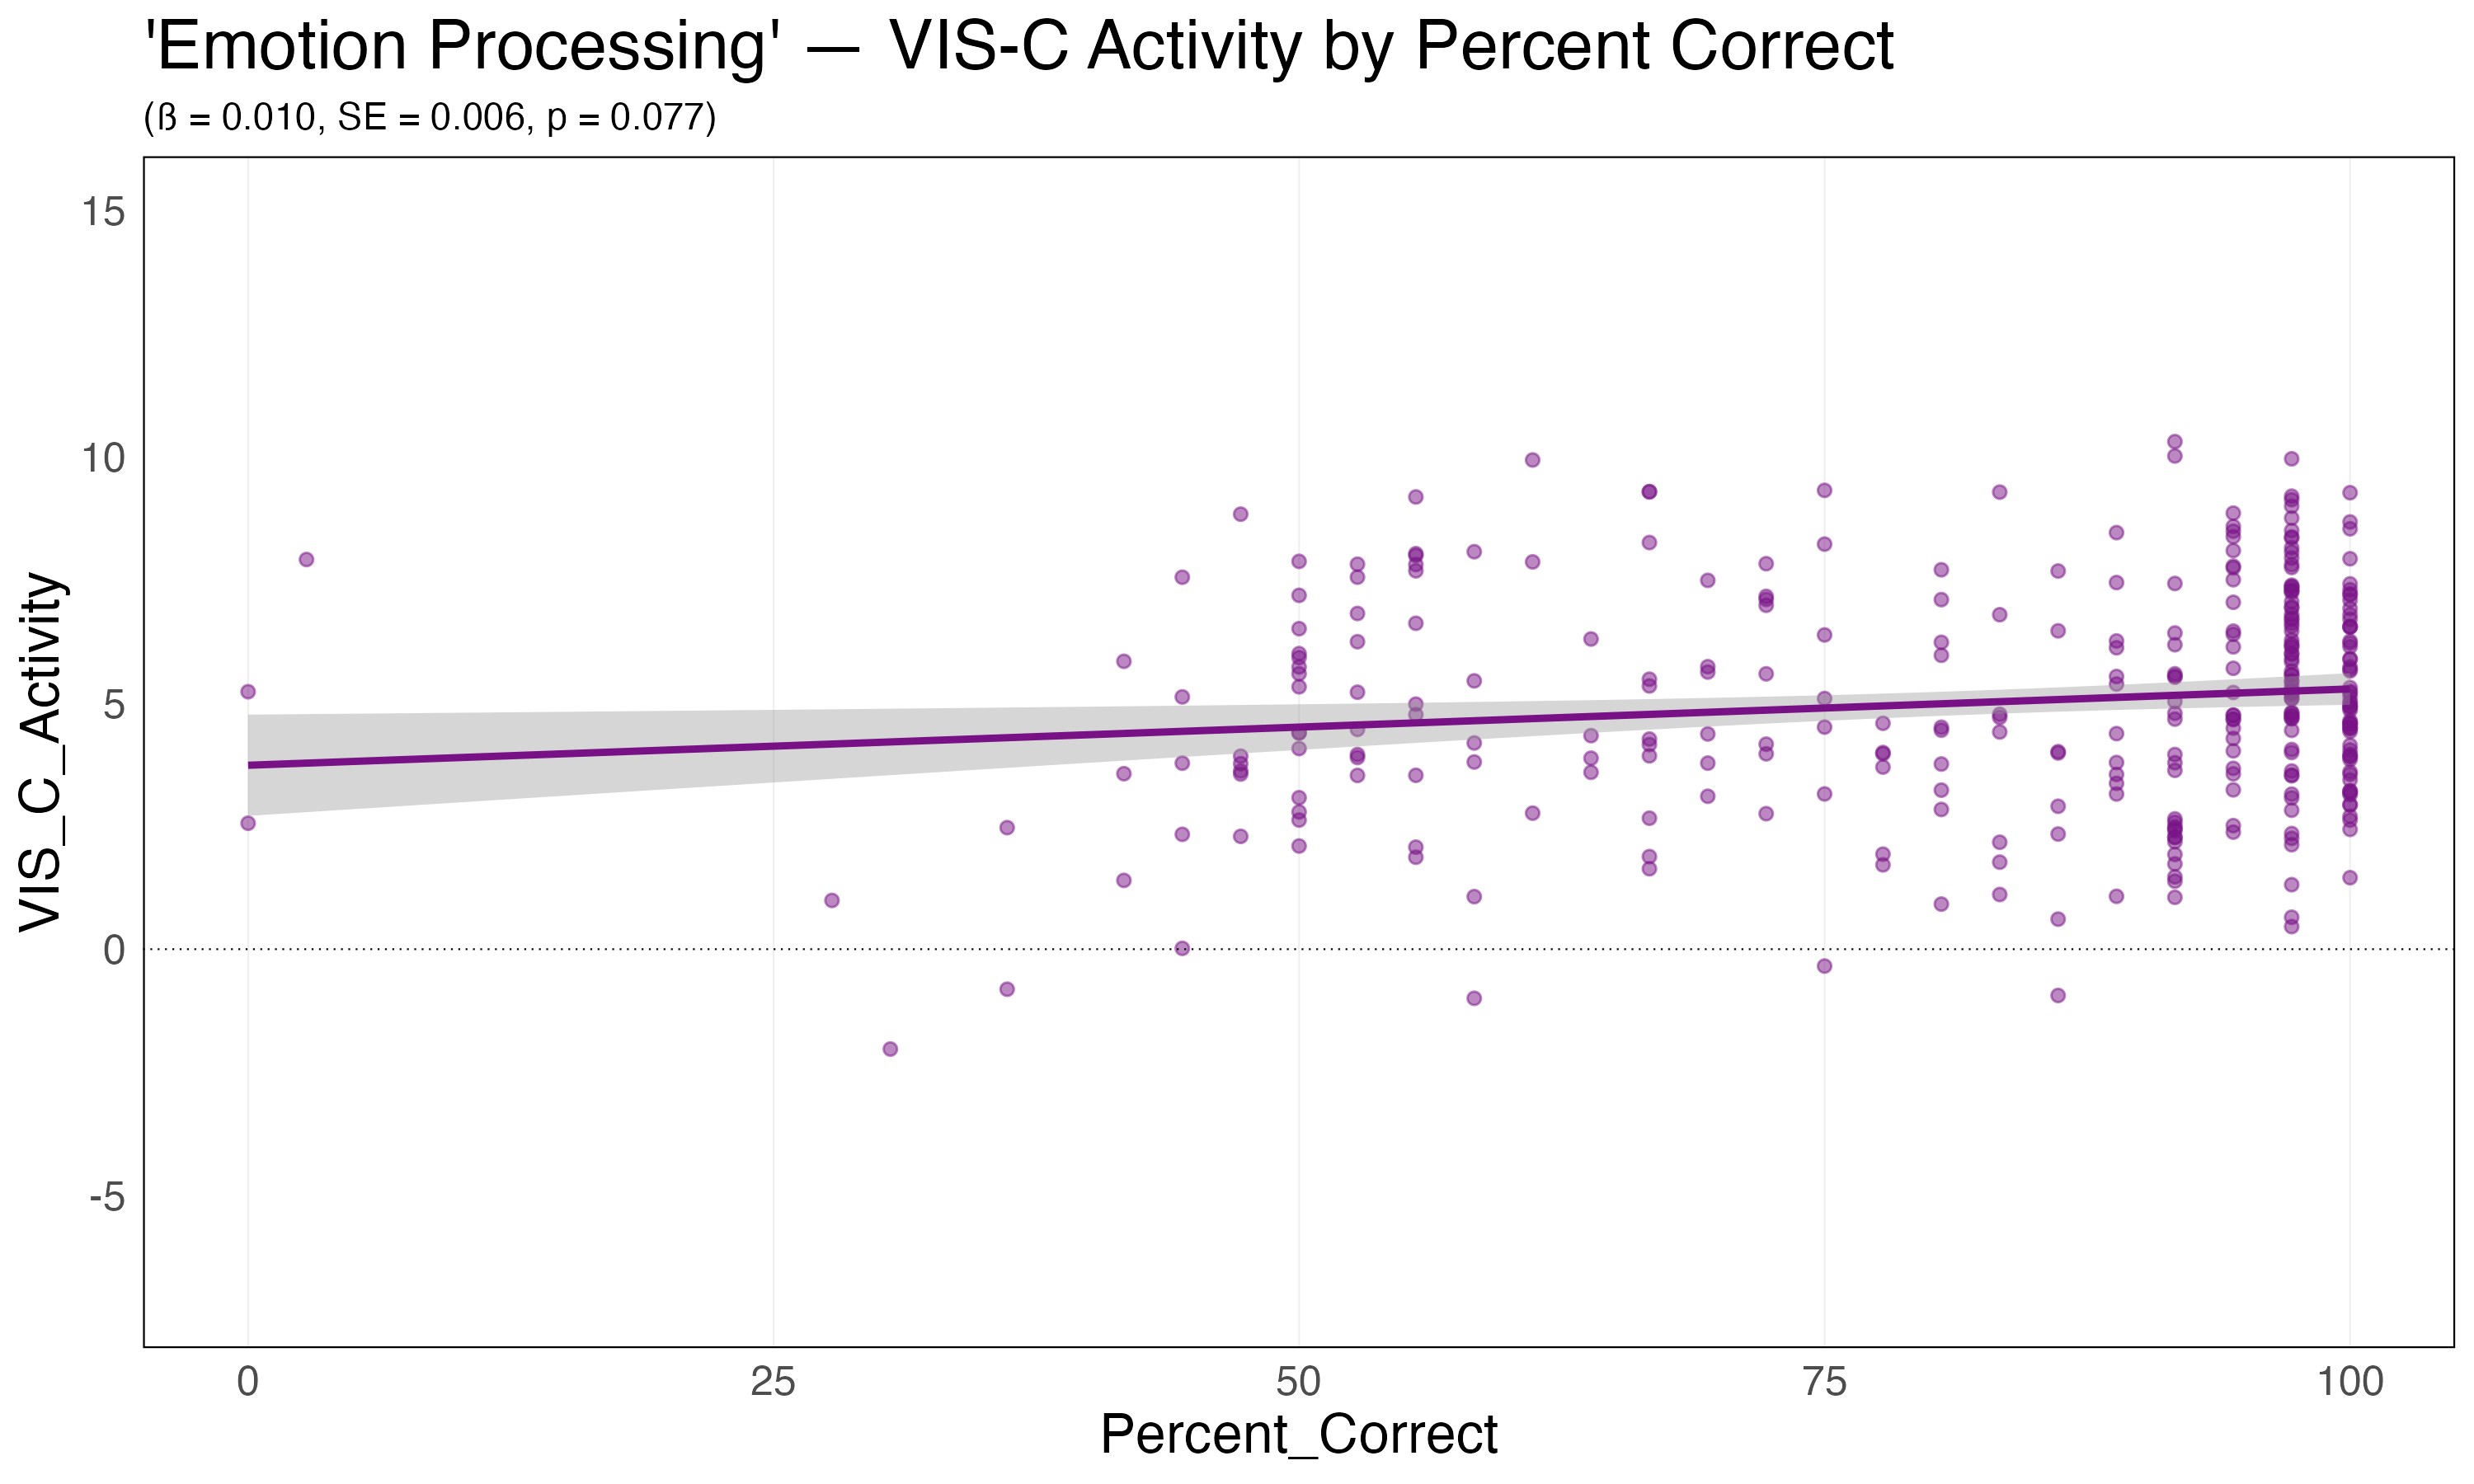
Visual-Central Network (VIS-C). Visual-central network (VIS-C) activity exhibited a slight positive association with task accuracy, but this association was not meaningfully significant (b = 0.010, SE = 0.006, p = 0.077).
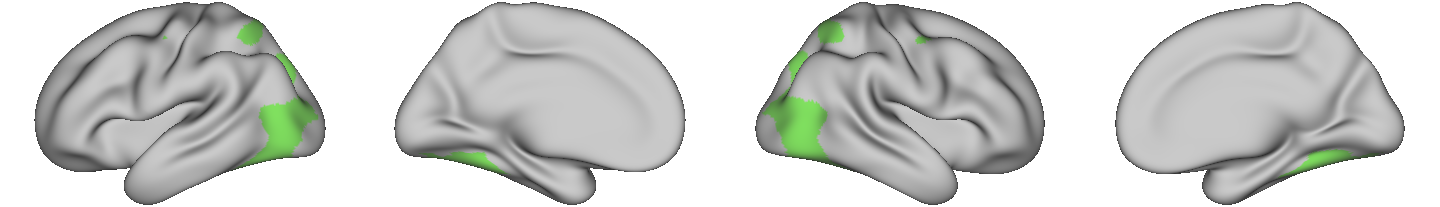
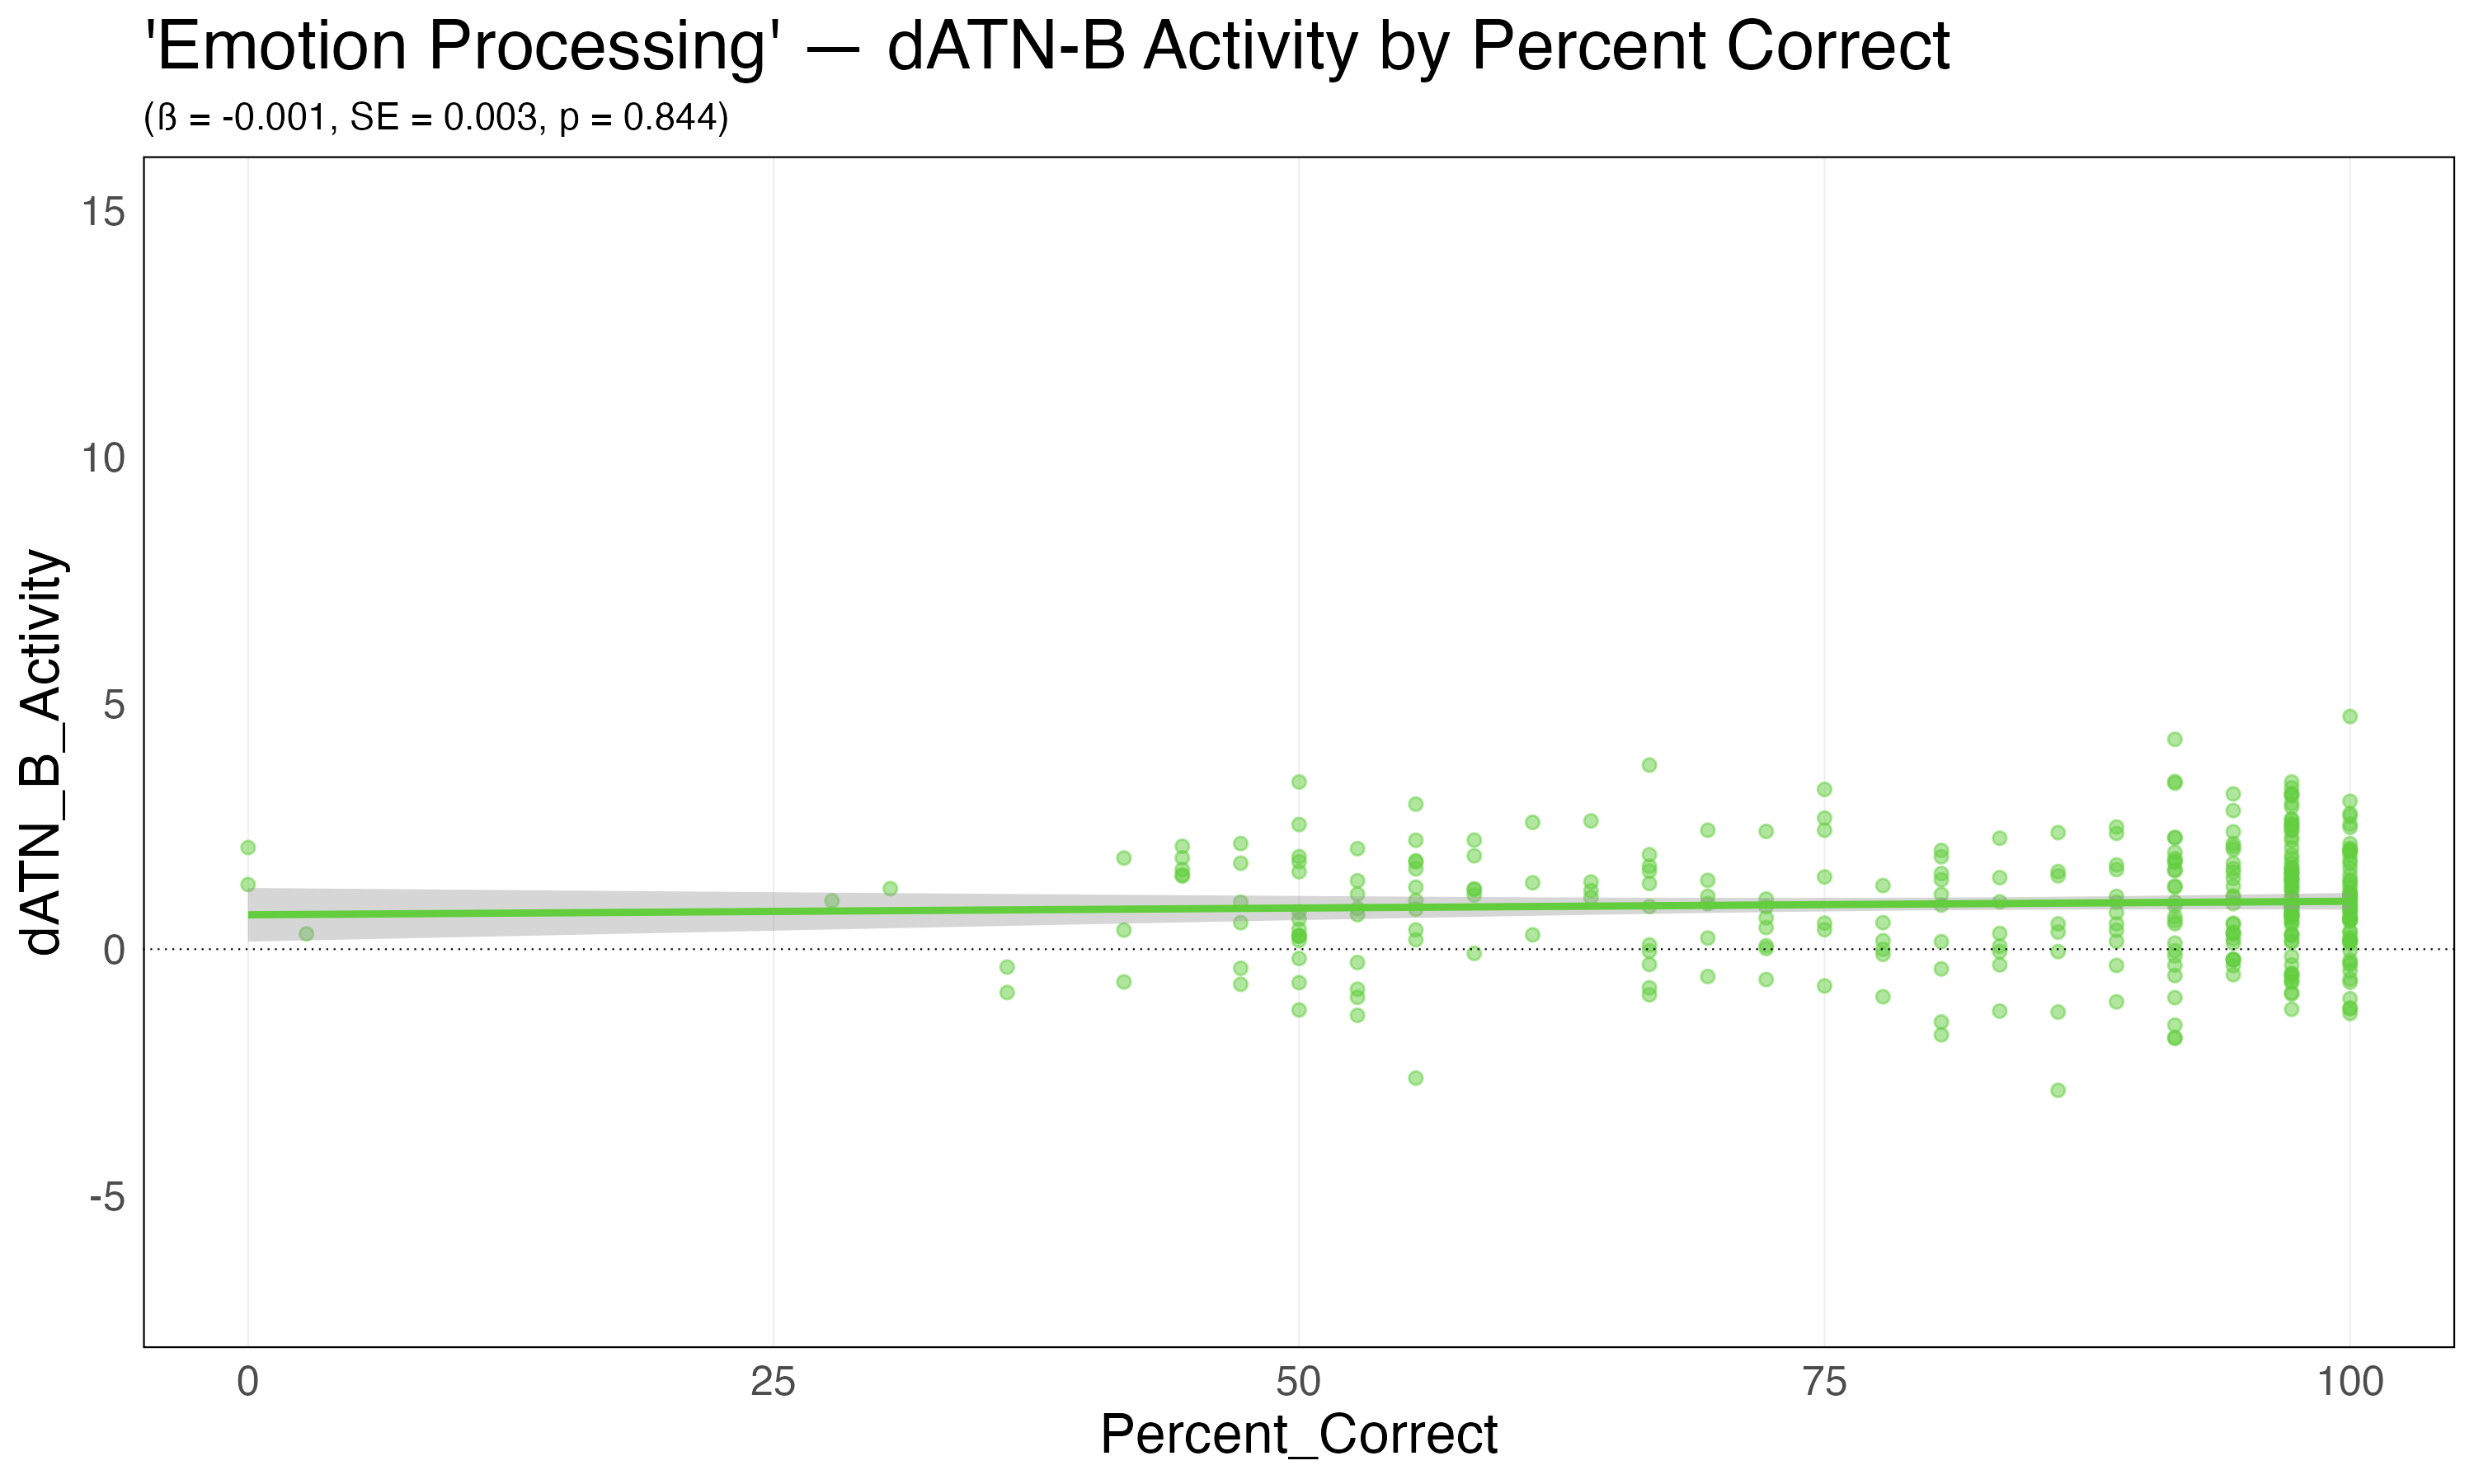
Dorsal Attention Network B (dATN-B). dorsal attention network B (dATN-B) activity is not associated with task accuracy, such that higher accuracy was associated with higher activity (b = -0.001, SE = 0.003, p = 0.003).
In sum, only the Meta-Analytic Regions (right and left fusiform) showed a significant association with task accuracy. Though the visual-central network (VIS-C) seemed to show a slight association with accuracy, this effect was not significant and neither was associations in dorsal attention network B (dATN-B). These findings suggest that cortical regions may be more sensitive than networks to small effects and factors with limited variability.
Response Time
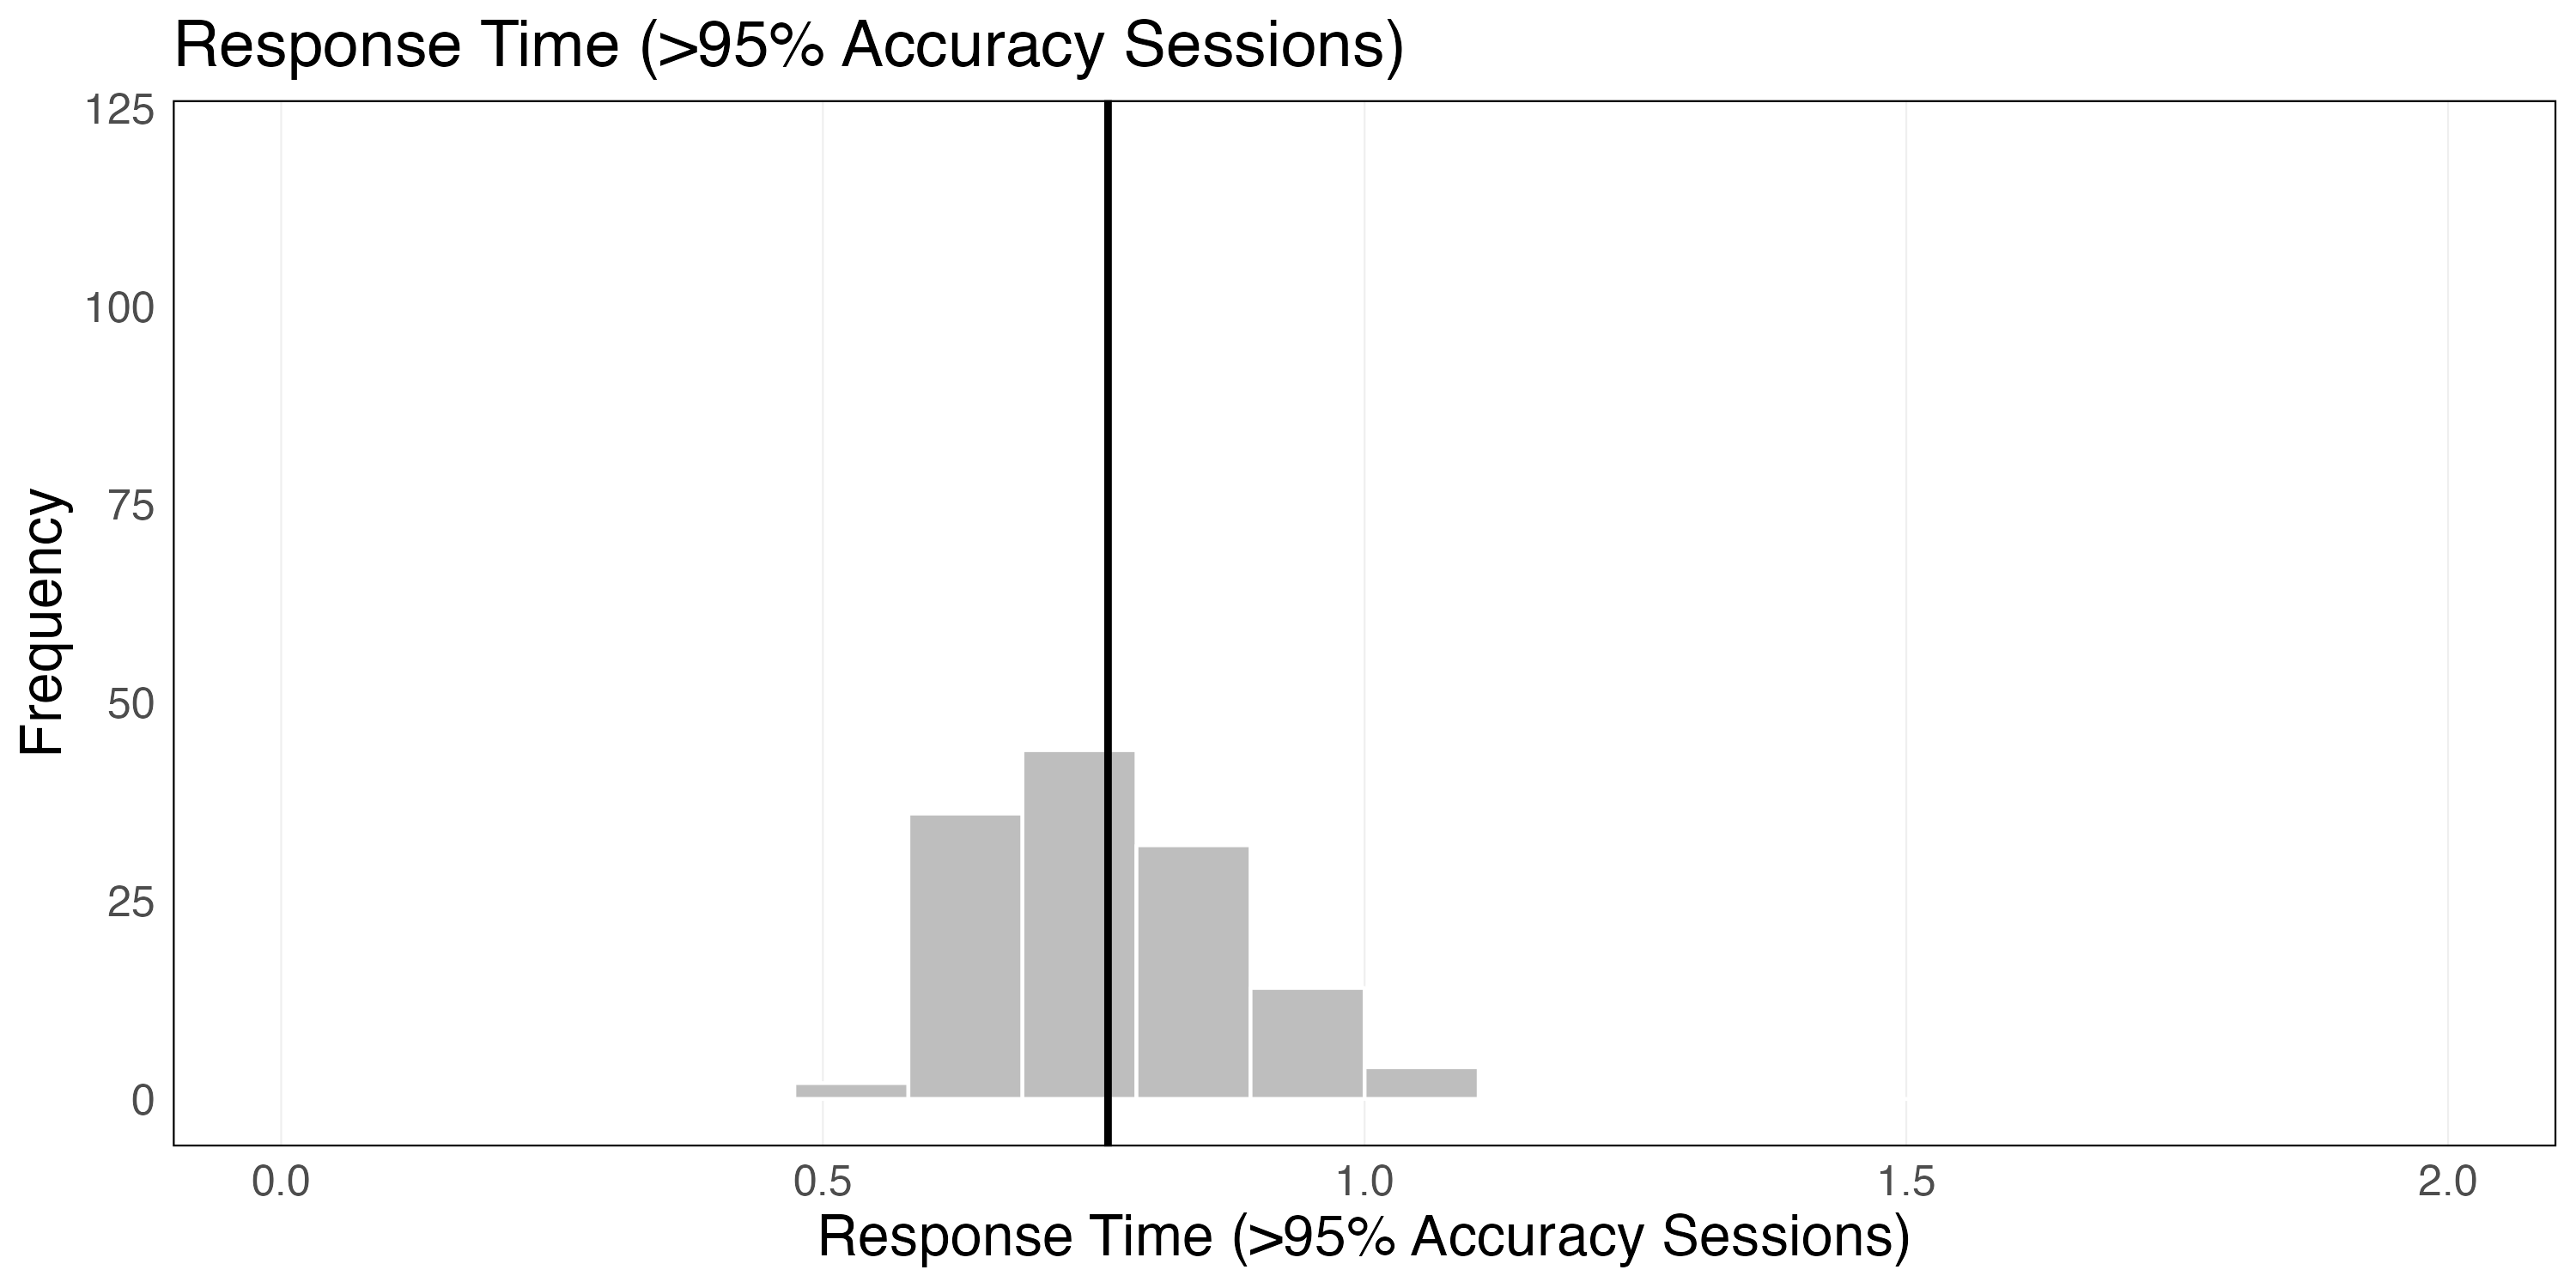
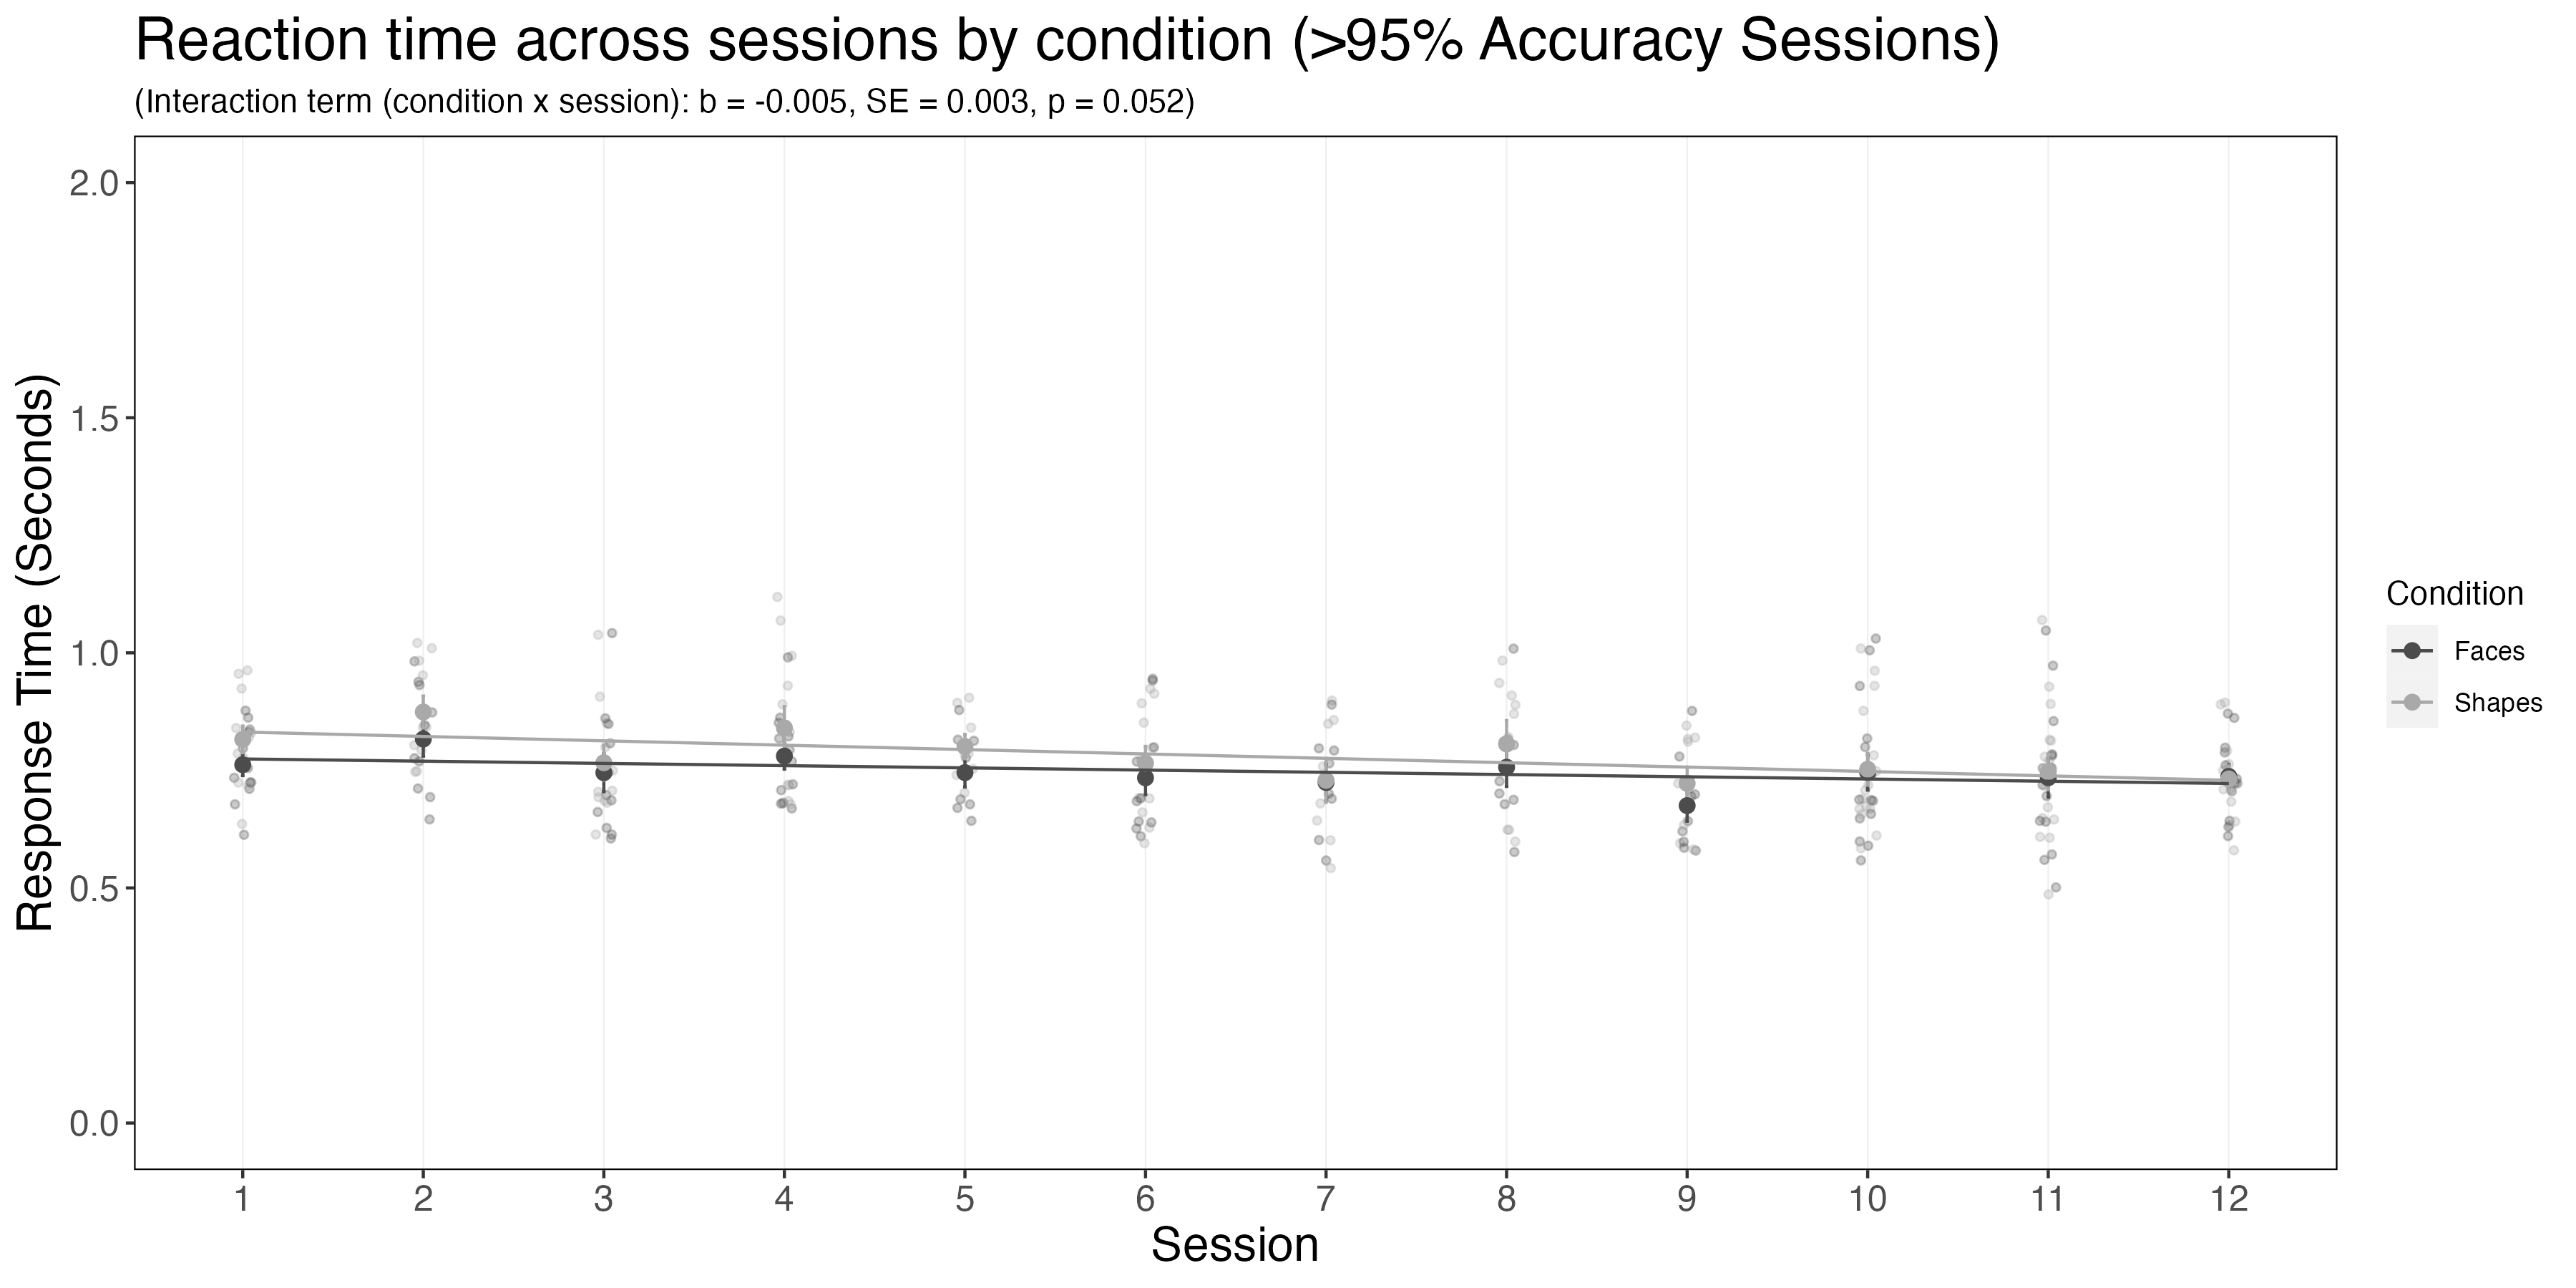
For the purposes of the follow analysis, I will only examine the effect of response time on activity for sessions where the subject’s accuracy was greater than 95%. We did this to dissociate response time effects from overall accuracy.
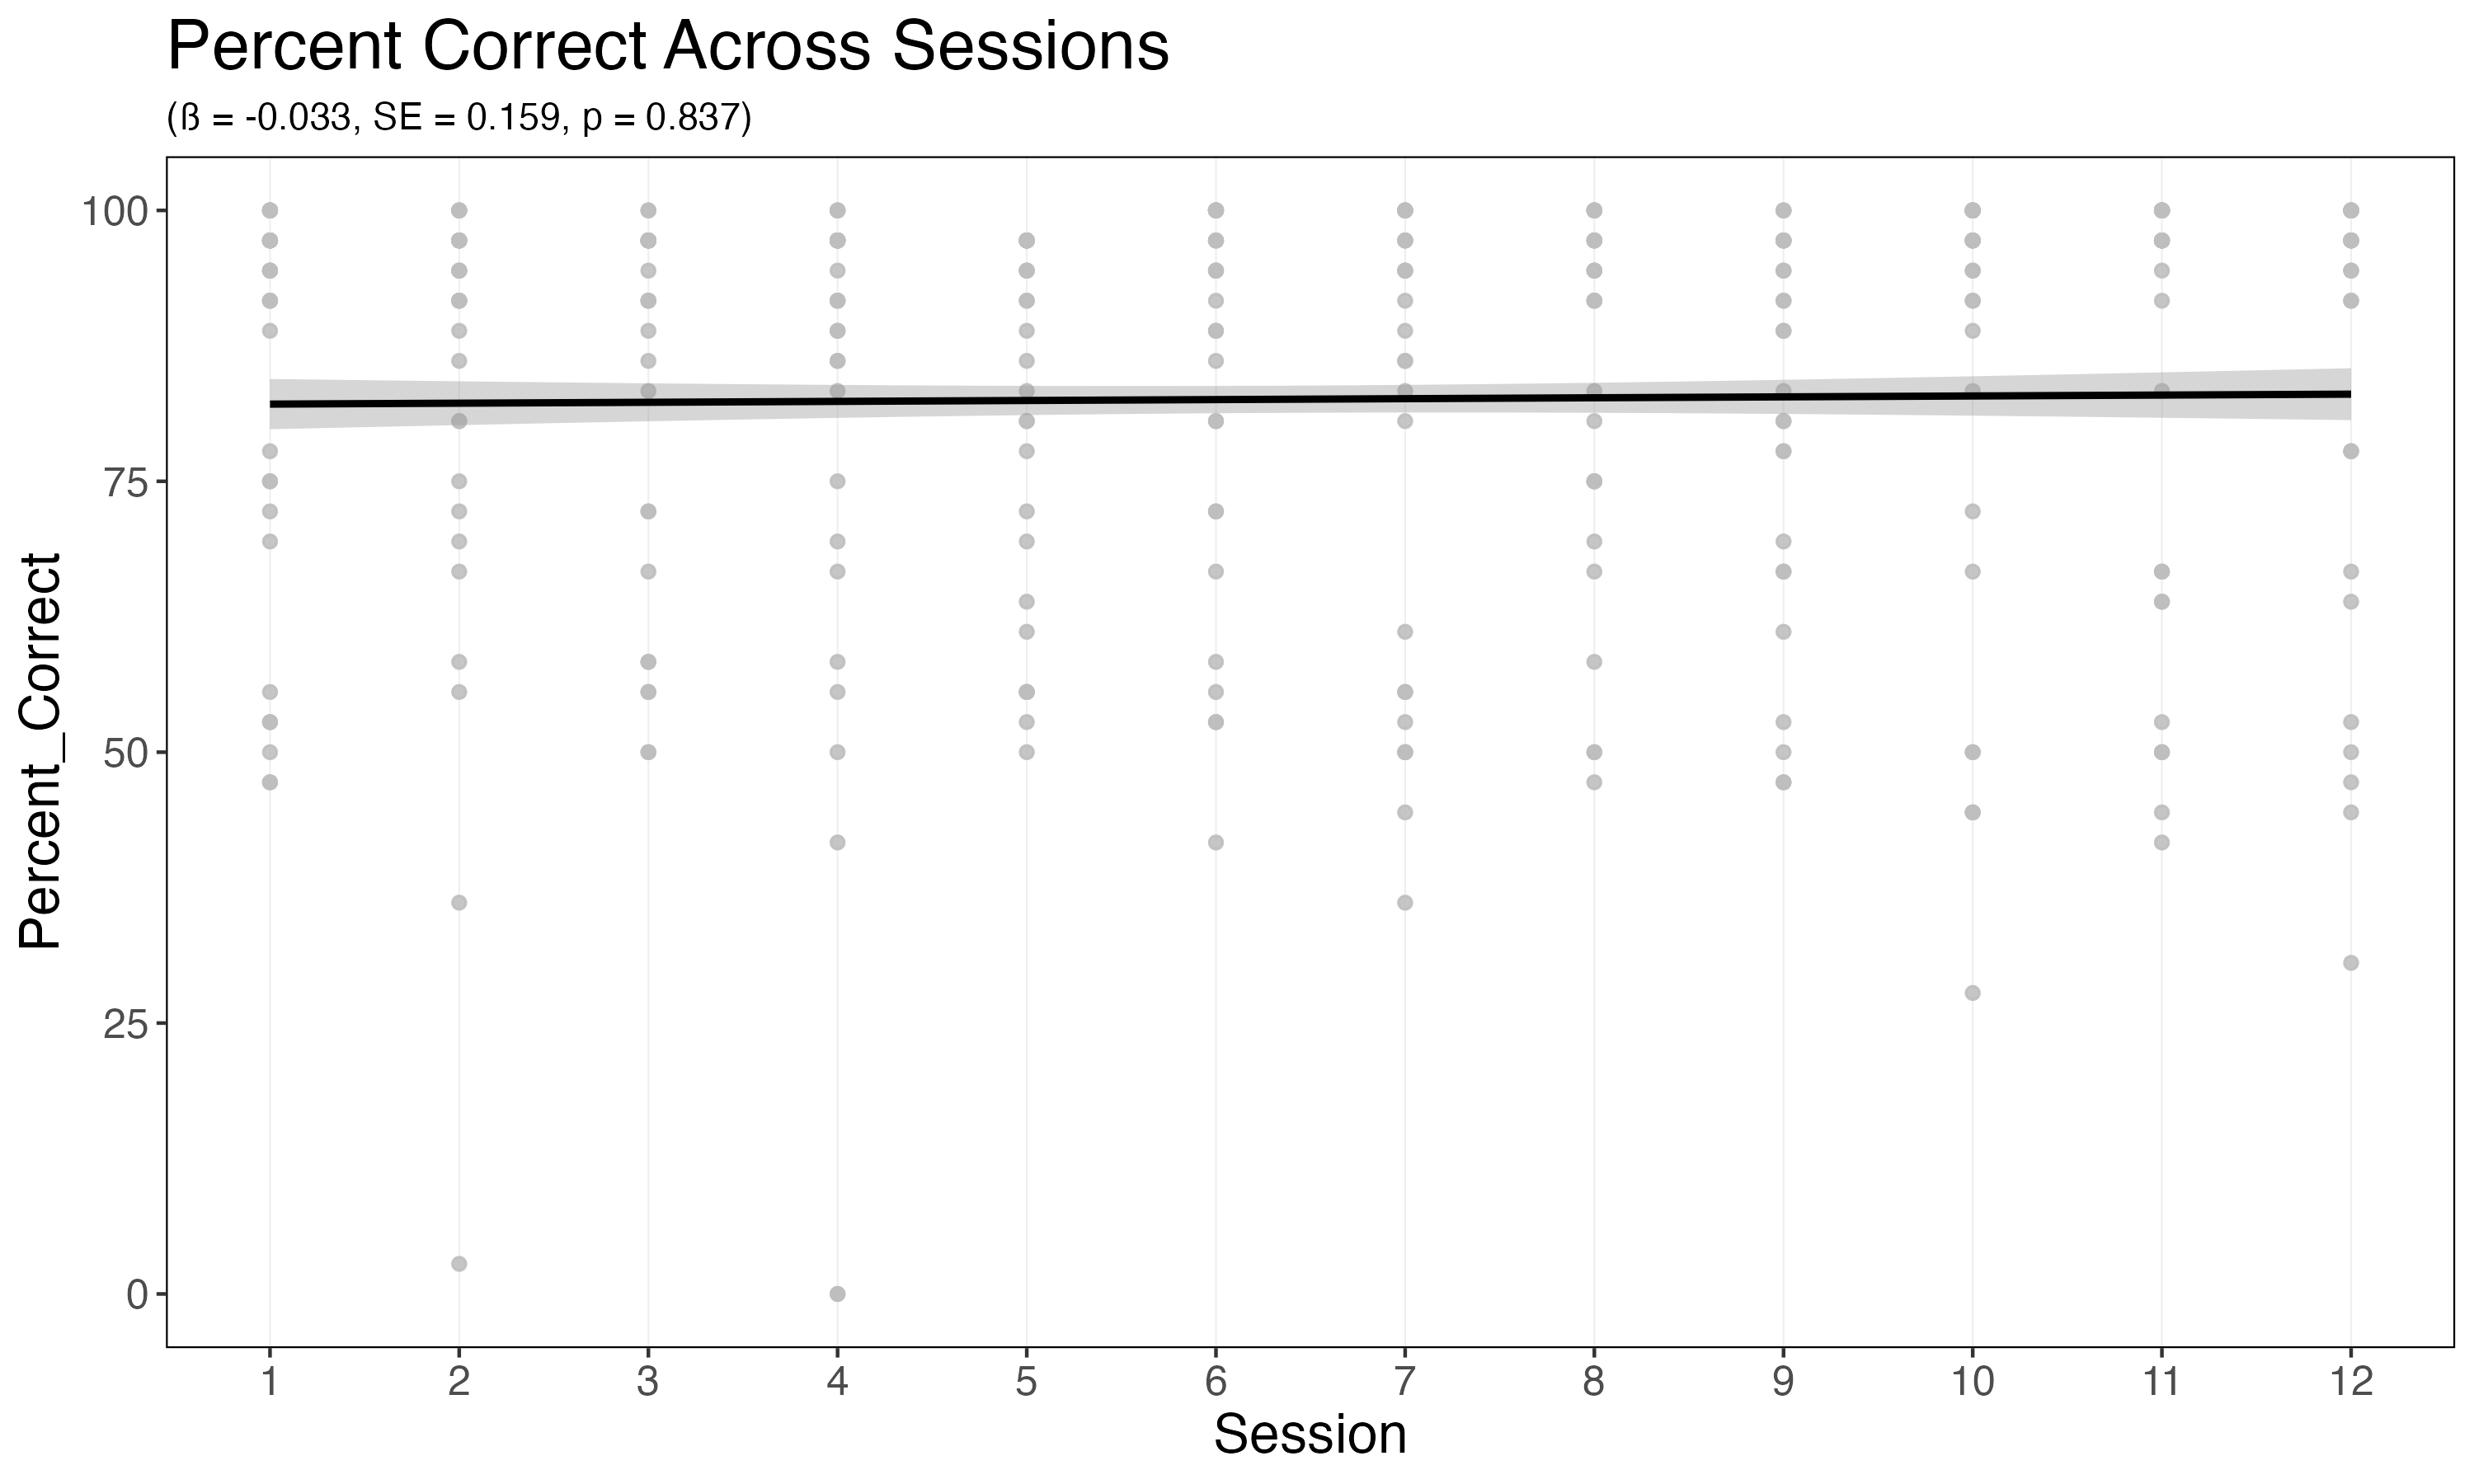
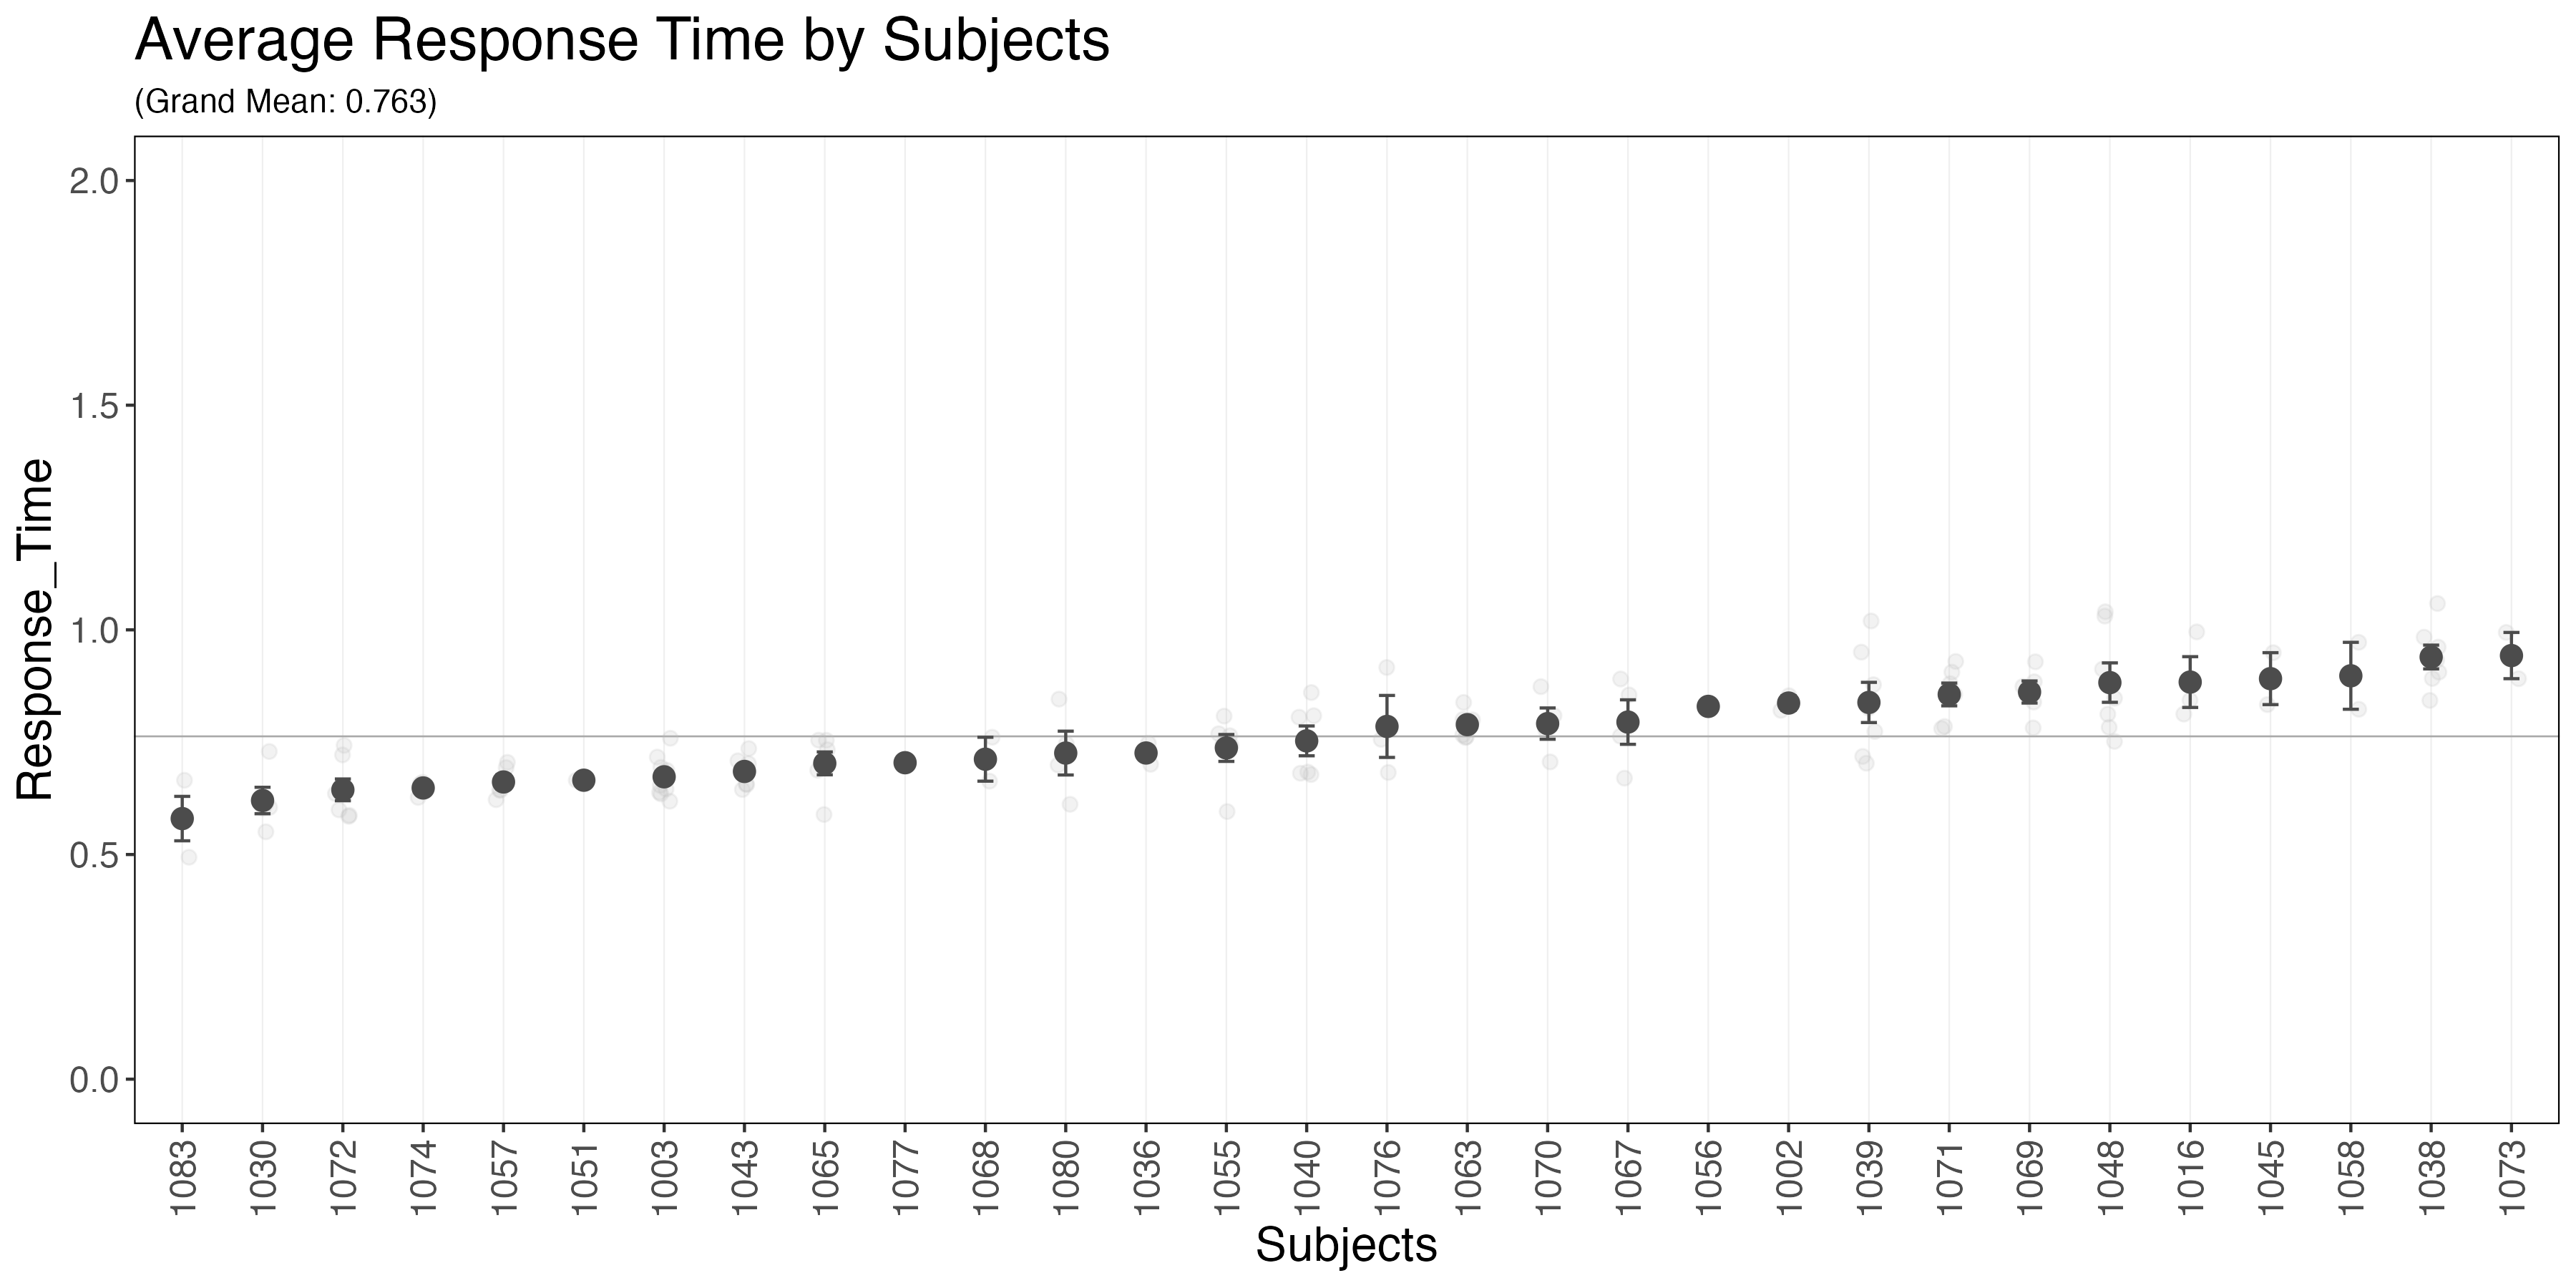
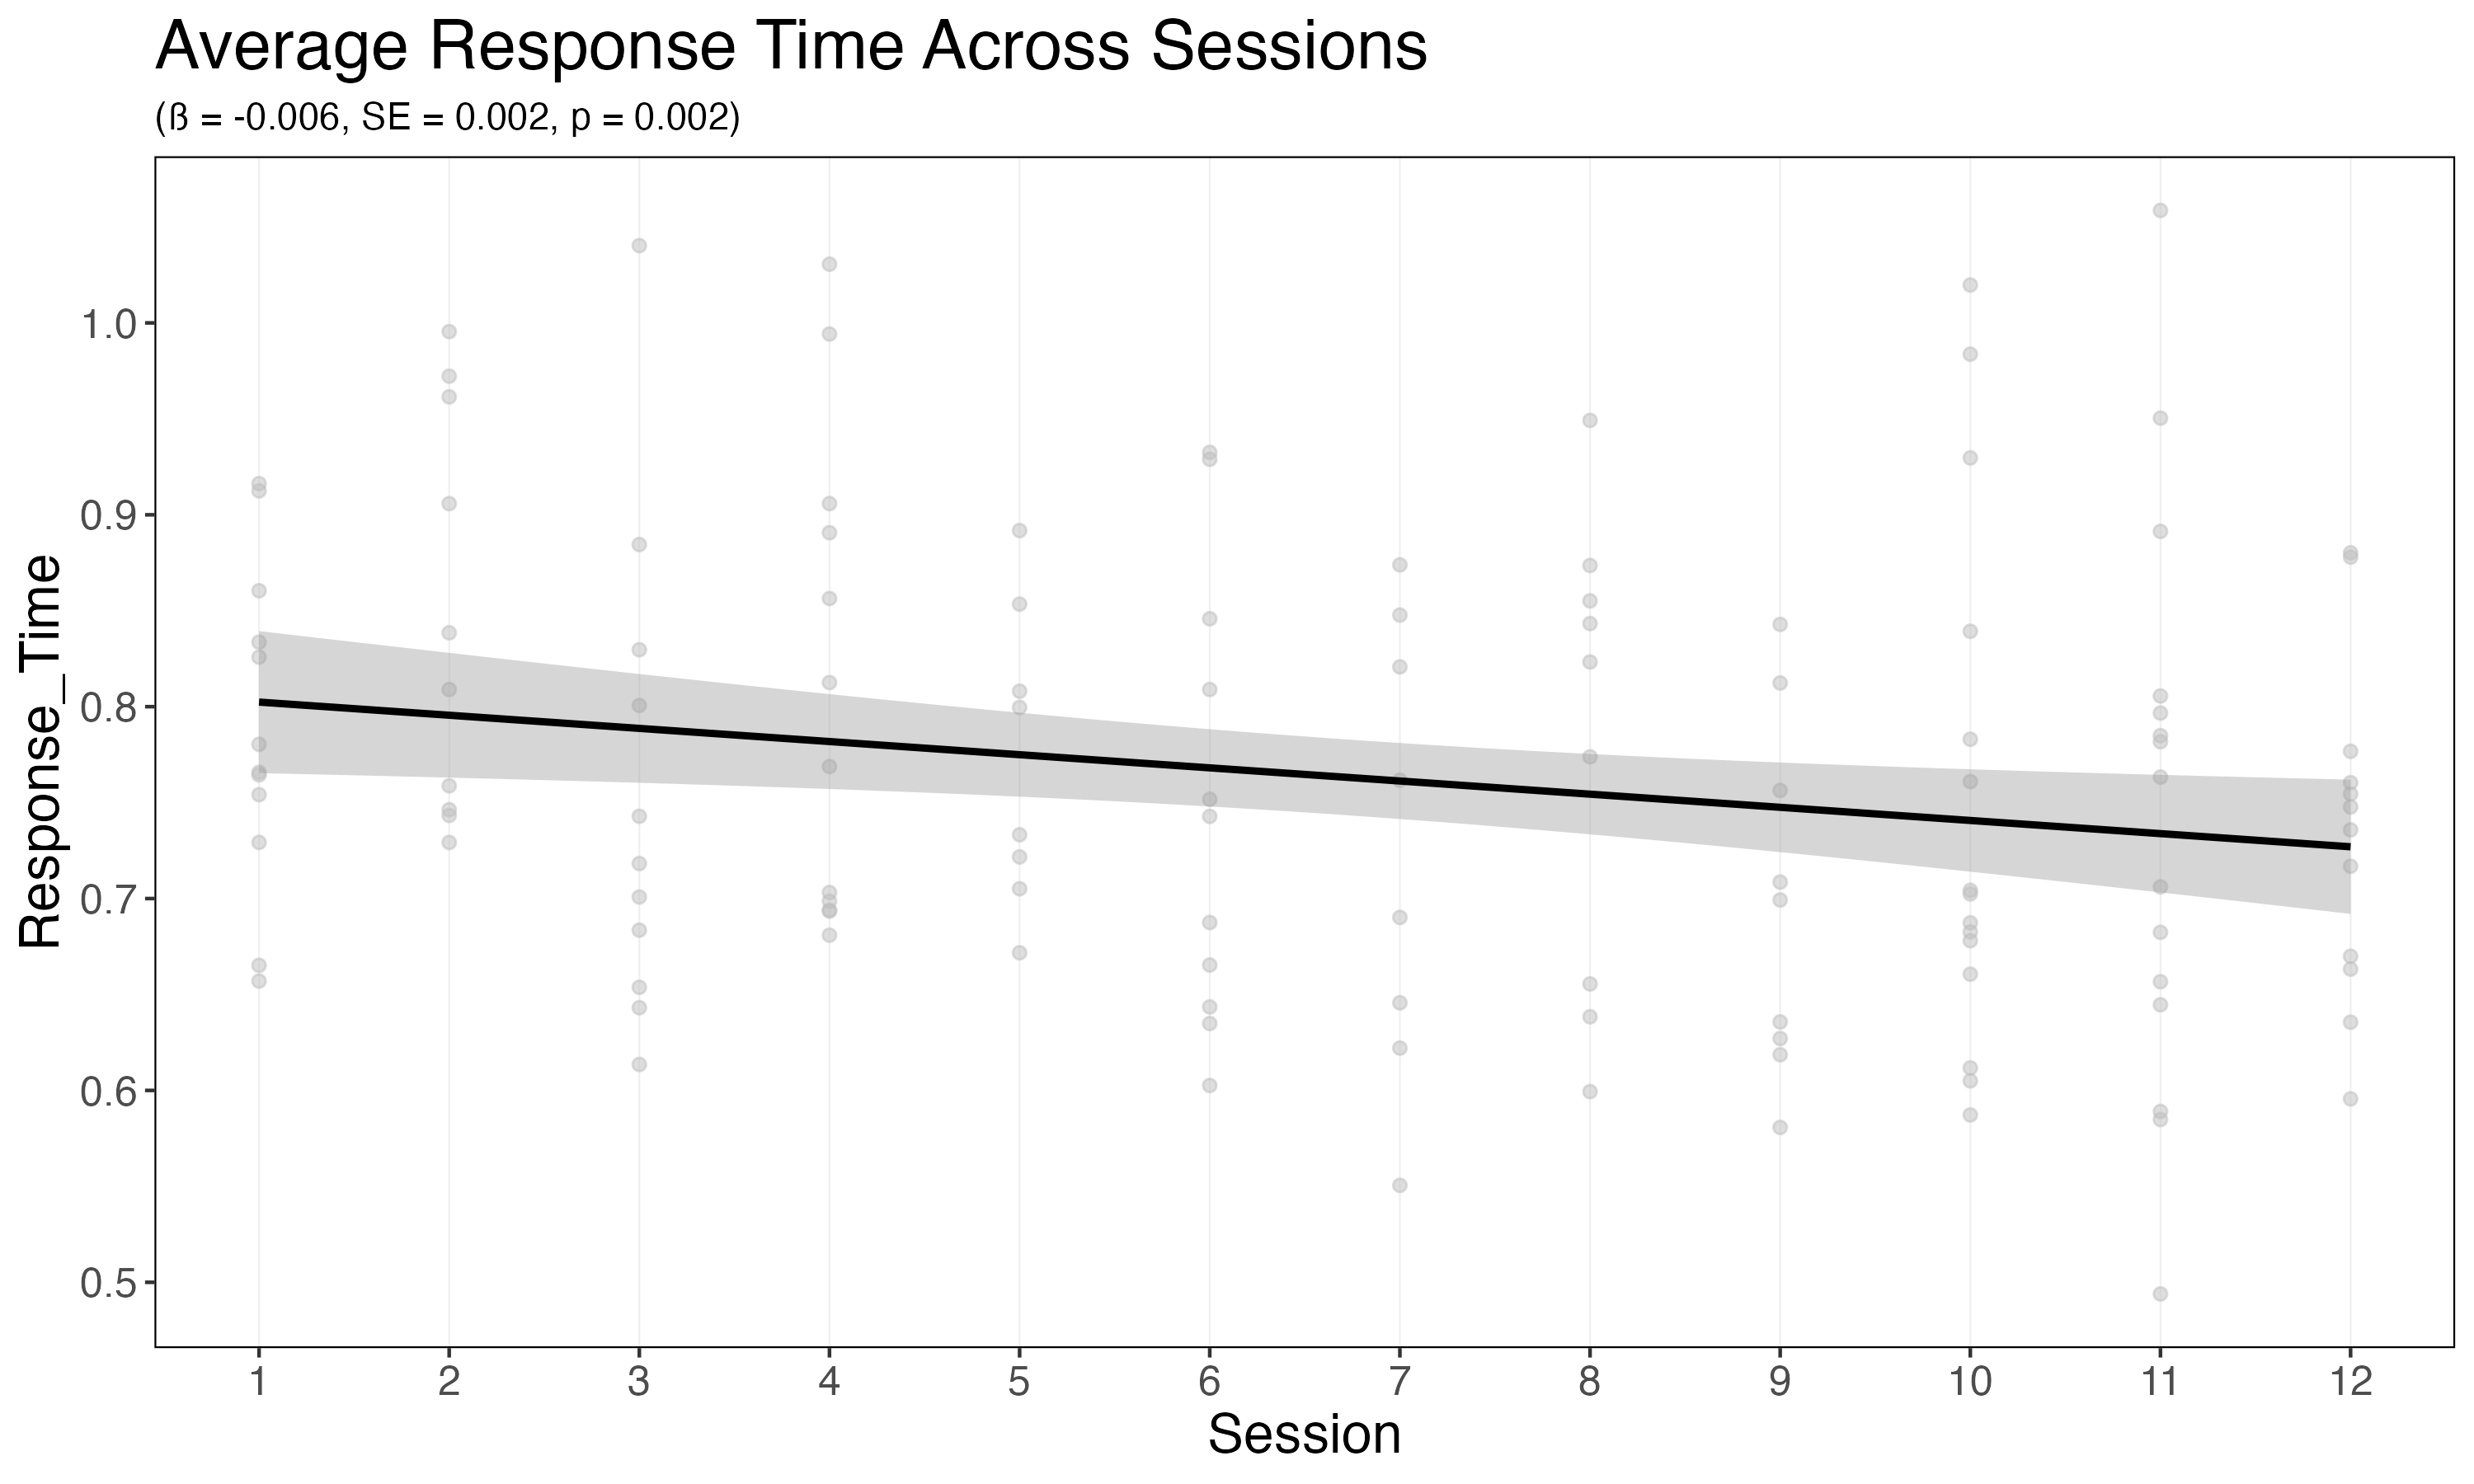
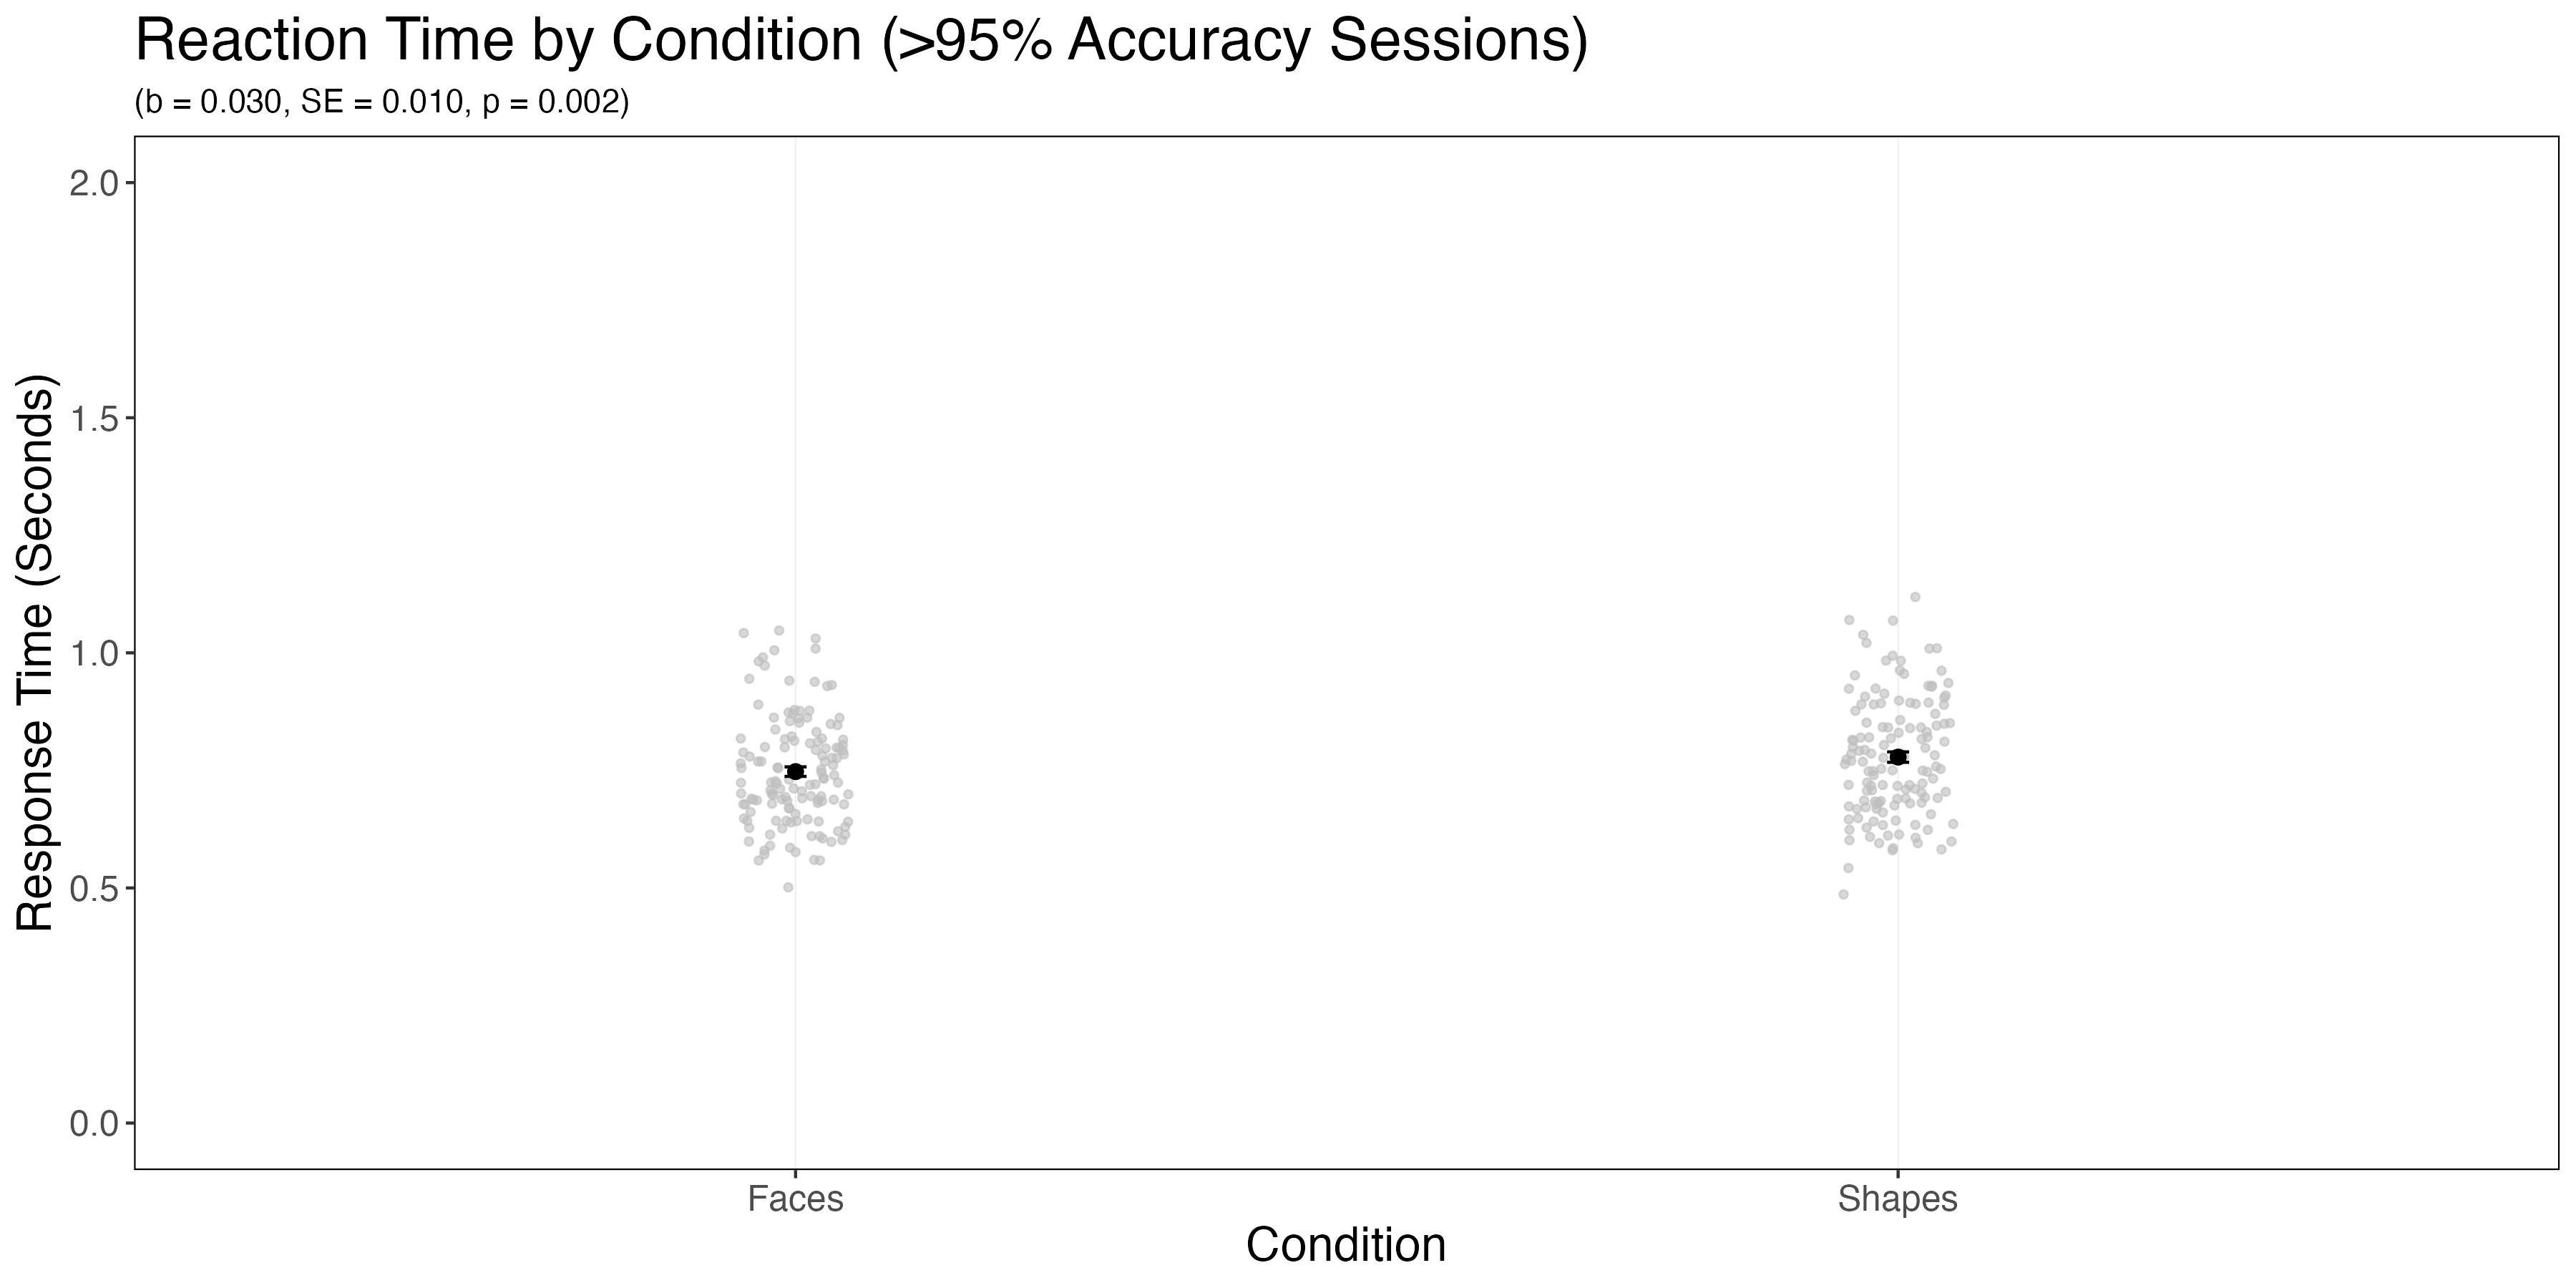
Subjects were given 2.0 seconds to make a response during the task. The average response time across all subjects, for session in which accuracy was greater than 95%, was 0.8 seconds. There was a significant decrease in response time across the sessions (b = -0.0006, SE = 0.002, p = 0.002) and subjects responded faster to the faces condition relative to the shapes condition (b = 0.030, SE = 0.010, p = 0.002). Though there were difference in response time across the two conditions, I have elected to examine the effect of average response time, as interpretations are clearer.
Associations Between Activity and Response Time
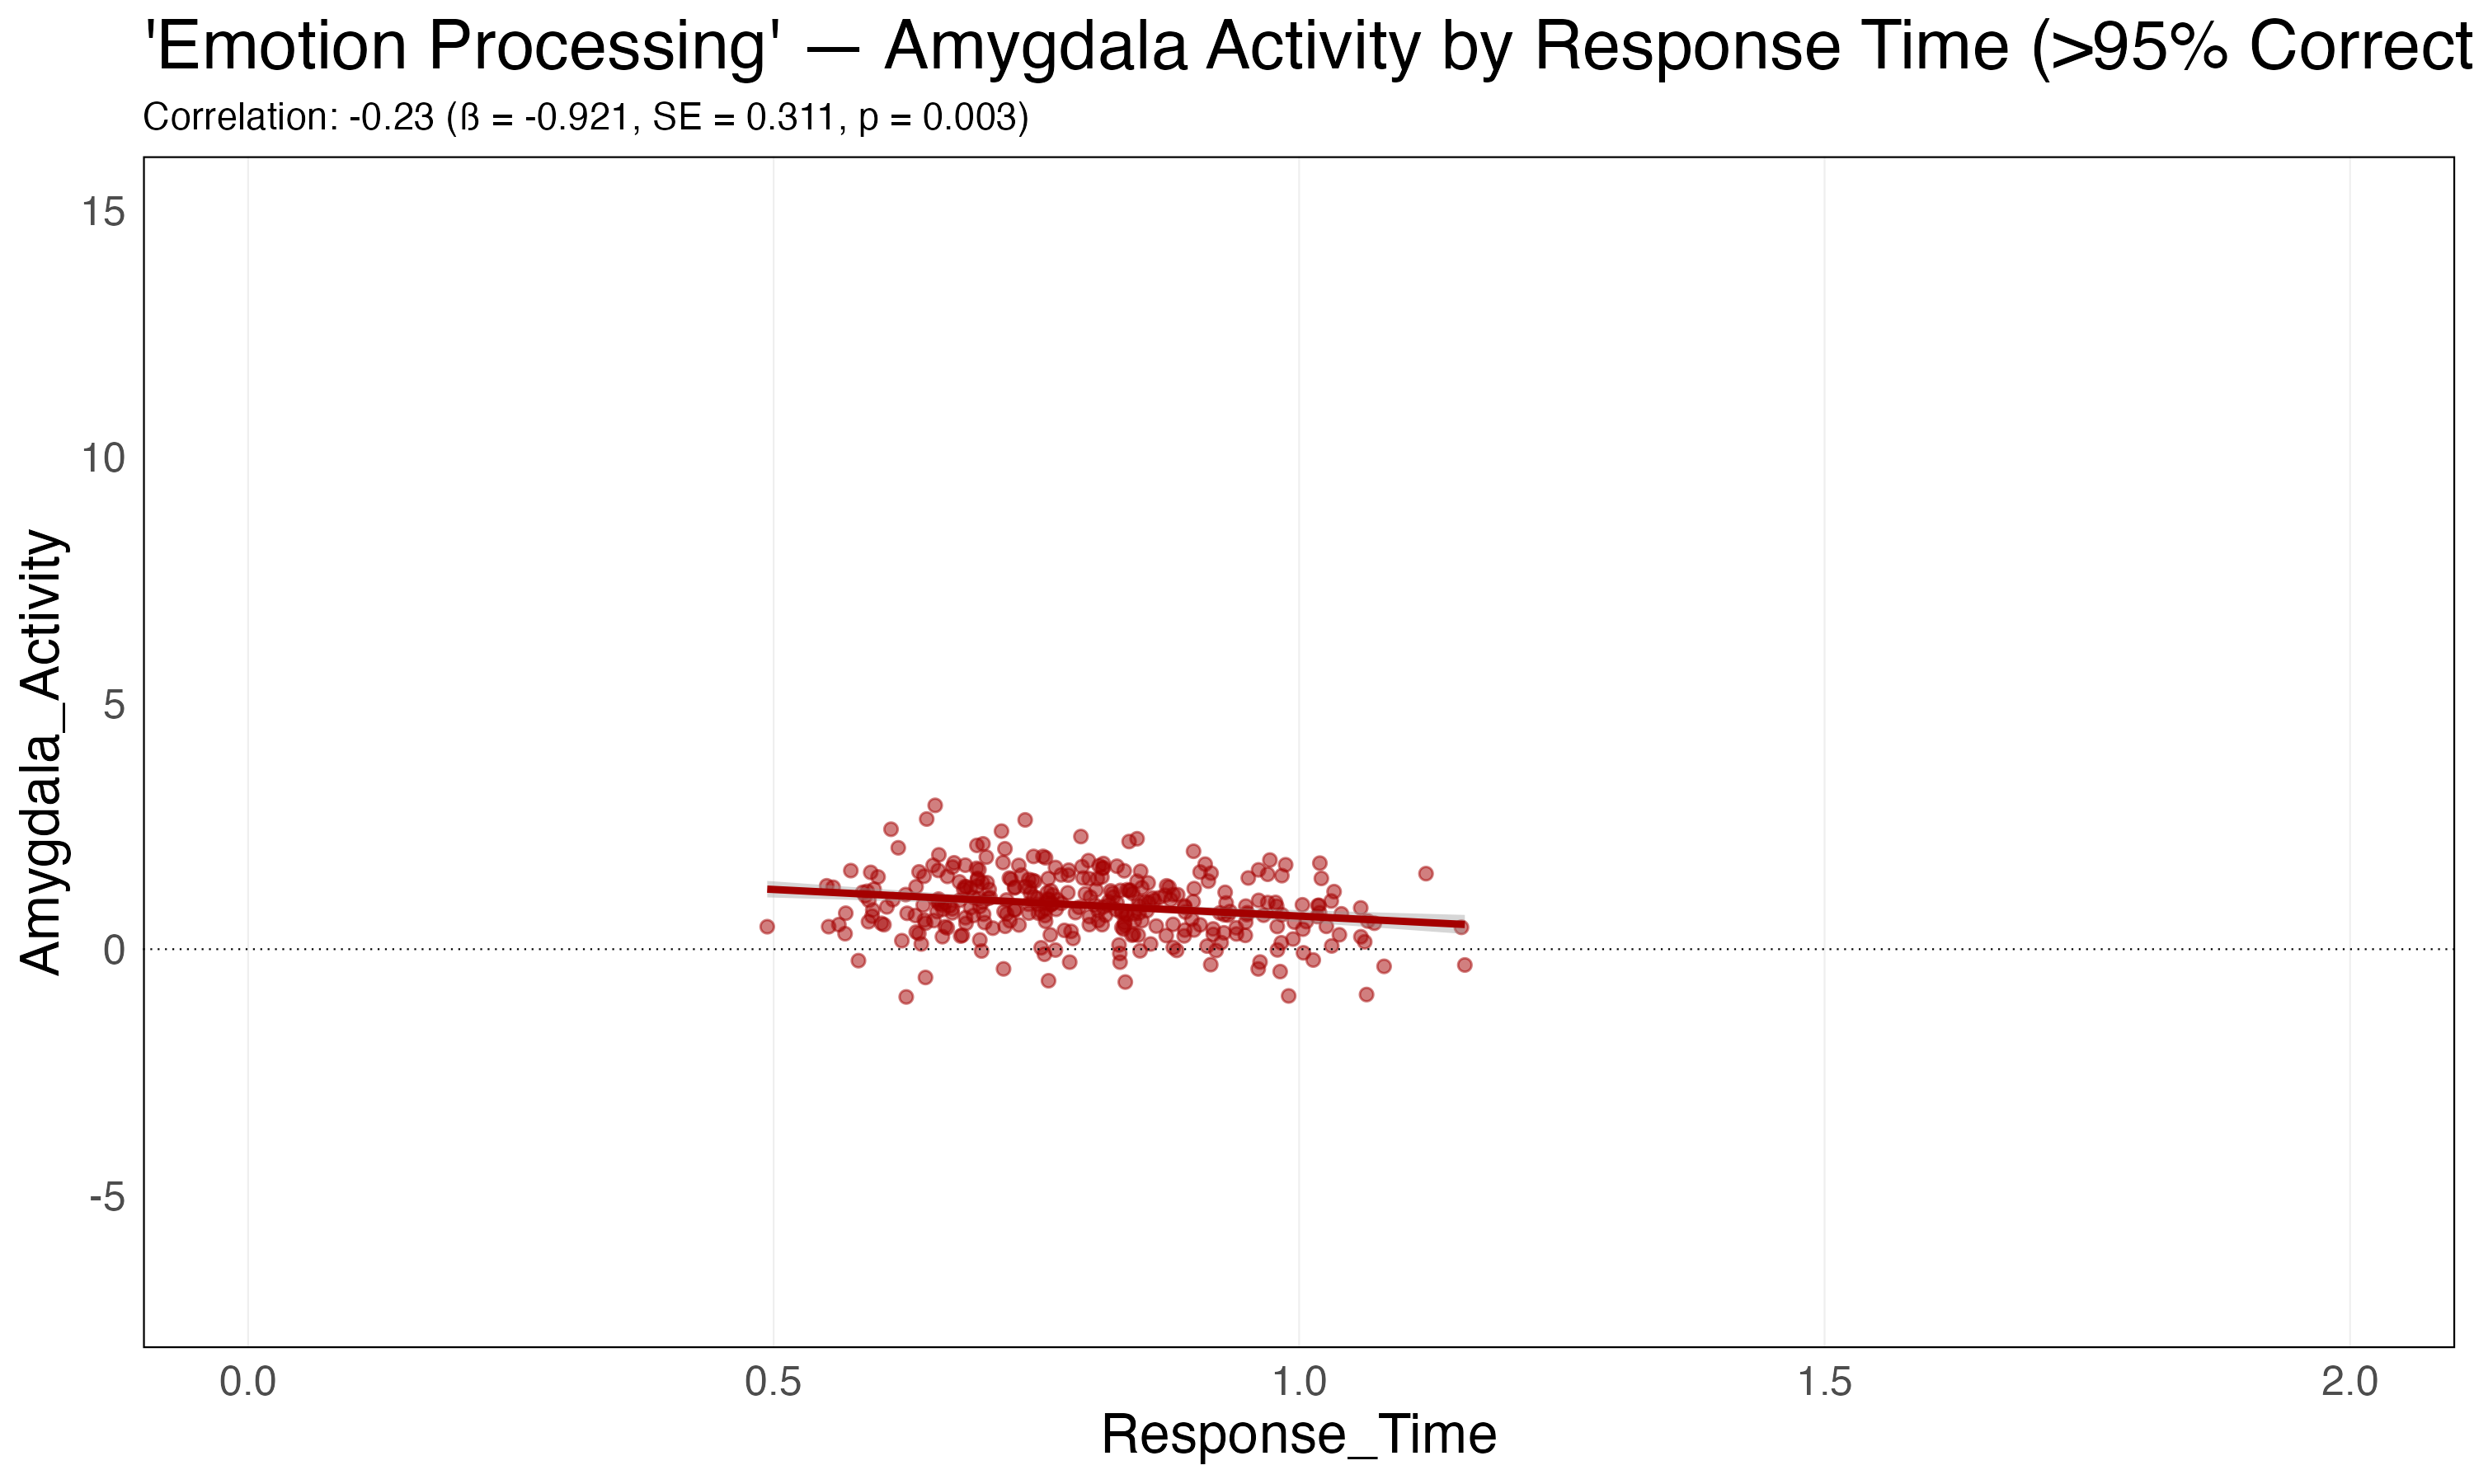

Amygdala. Amygdala activity was negatively associated with response time, such that faster response time was associated with higher activity (b = -0.92, SE = 0.31, p = 0.0003)
Left and Right Fusiform. Both right and left fusiform activity was negatively associated with response time, such that faster response time was associated with higher activity (right fusiform: b = -2.7, SE = 0.76, p < 0.001, left fusiform: b = -3.6, SE = 0.85, p < 0.001). Importantly, the response time effect within the right fusiform was notably stronger than in the left fusiform.
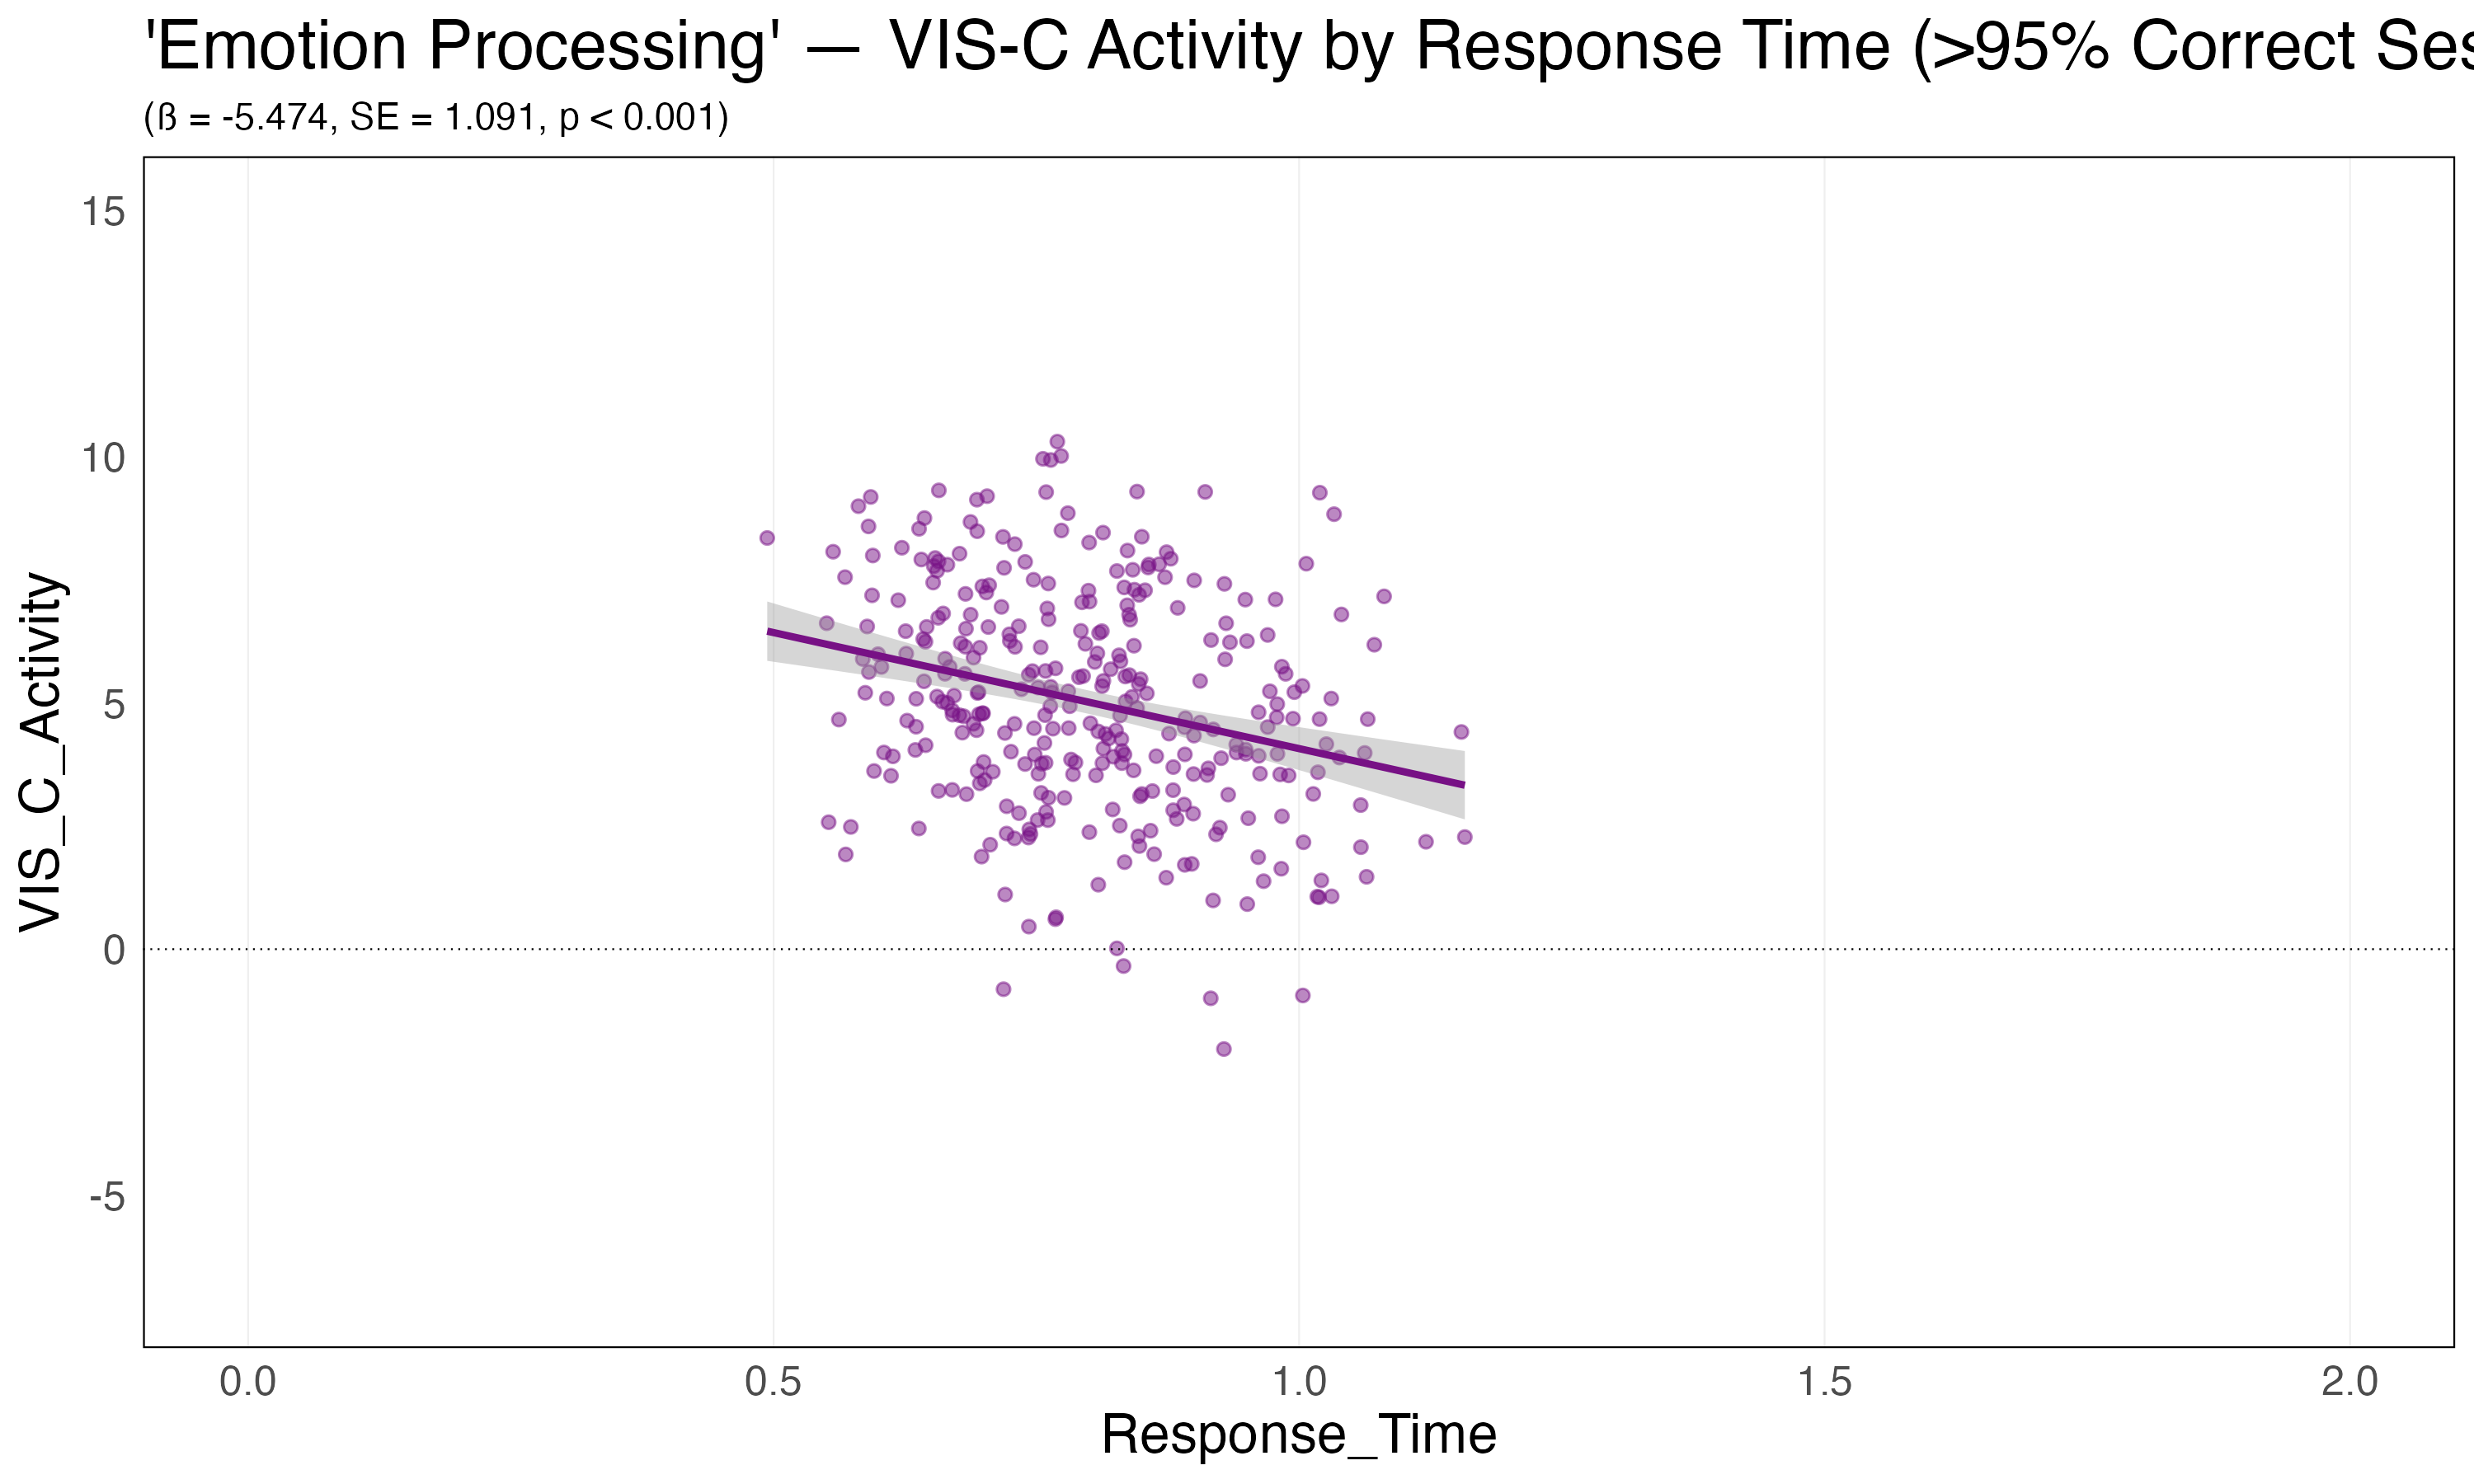
Visual-Central Network (VIS-C). Visual-central network (VIS-C) activity also exhibited significant negative association with response time (b = -5.5, SE = 1.091, p < 0.001).
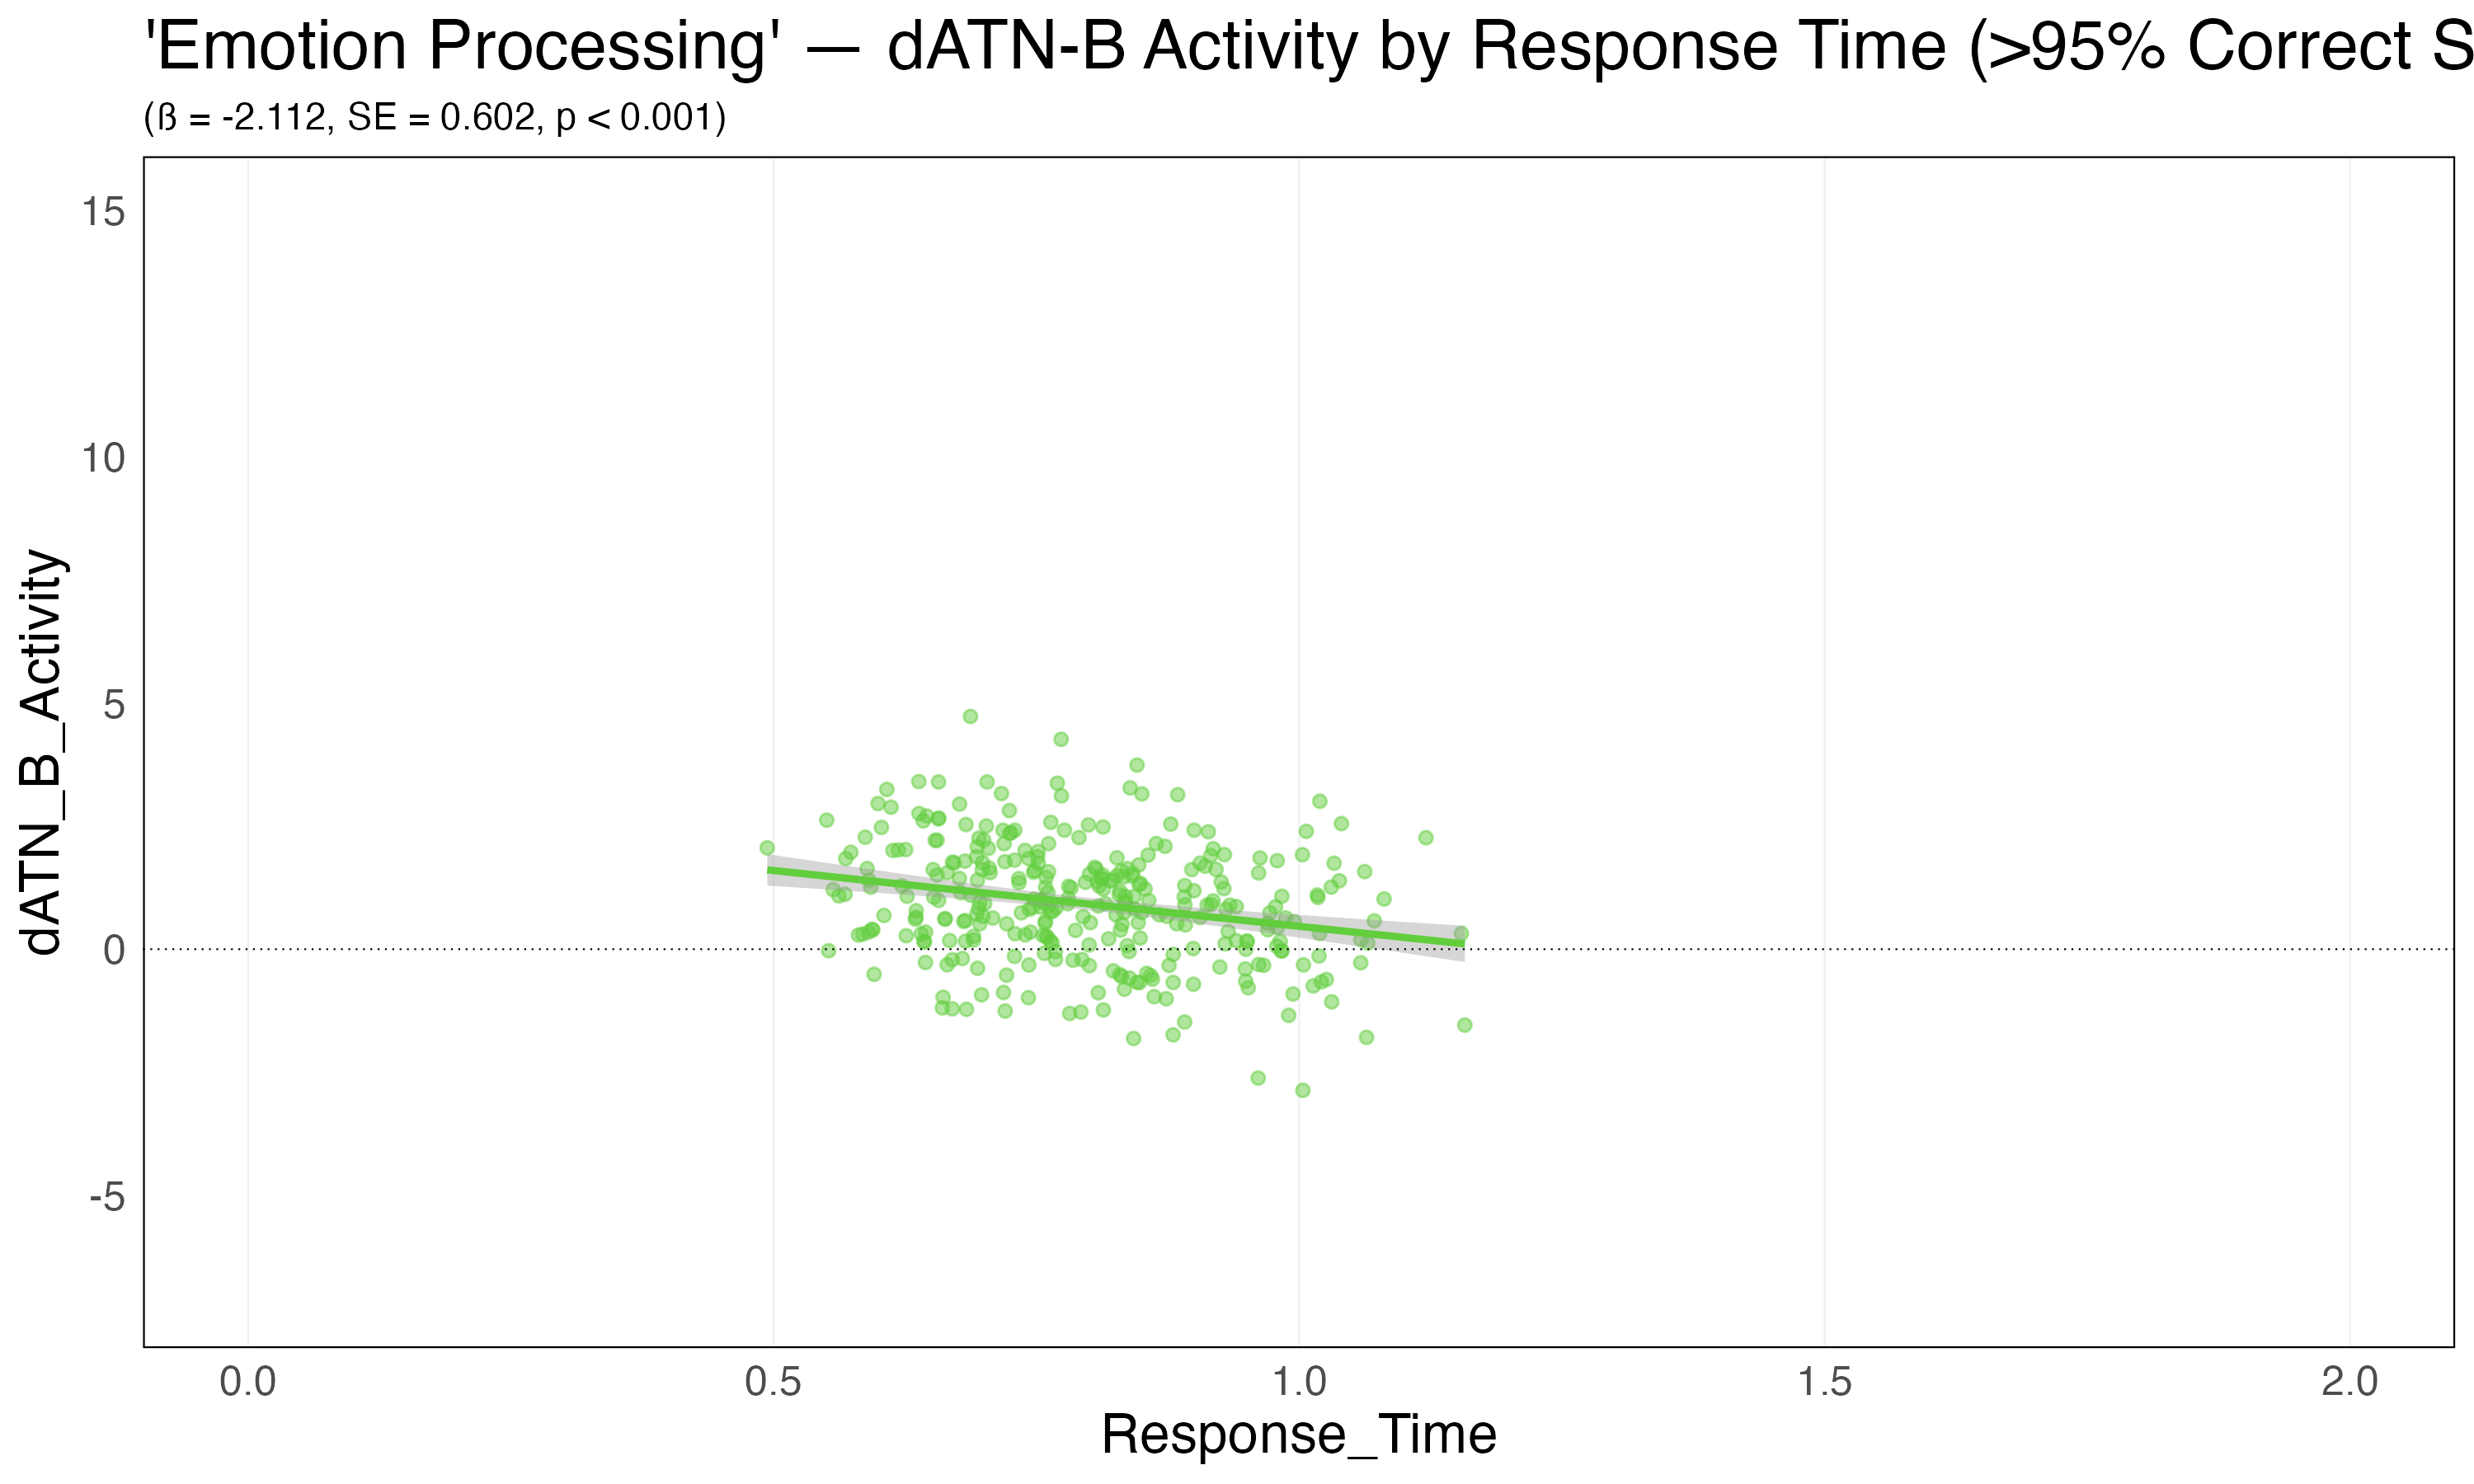
Dorsal Attention Network B (dATN-B). Dorsal attention network B (dATN-B) activity also exhibited significant negative association with response time (b = -2.1, SE = 0.60, p < 0.001).
In sum, all the boundaries show significant negative associations with response time, where by faster responses were associated with higher activity. These findings suggest that the faster subjects respond, the more differentiated the contrast activity is between the faces condition and the shapes condition. These findings confirm that the activity within the individualized networks are sensitive to task behavior.