Boundary Activity
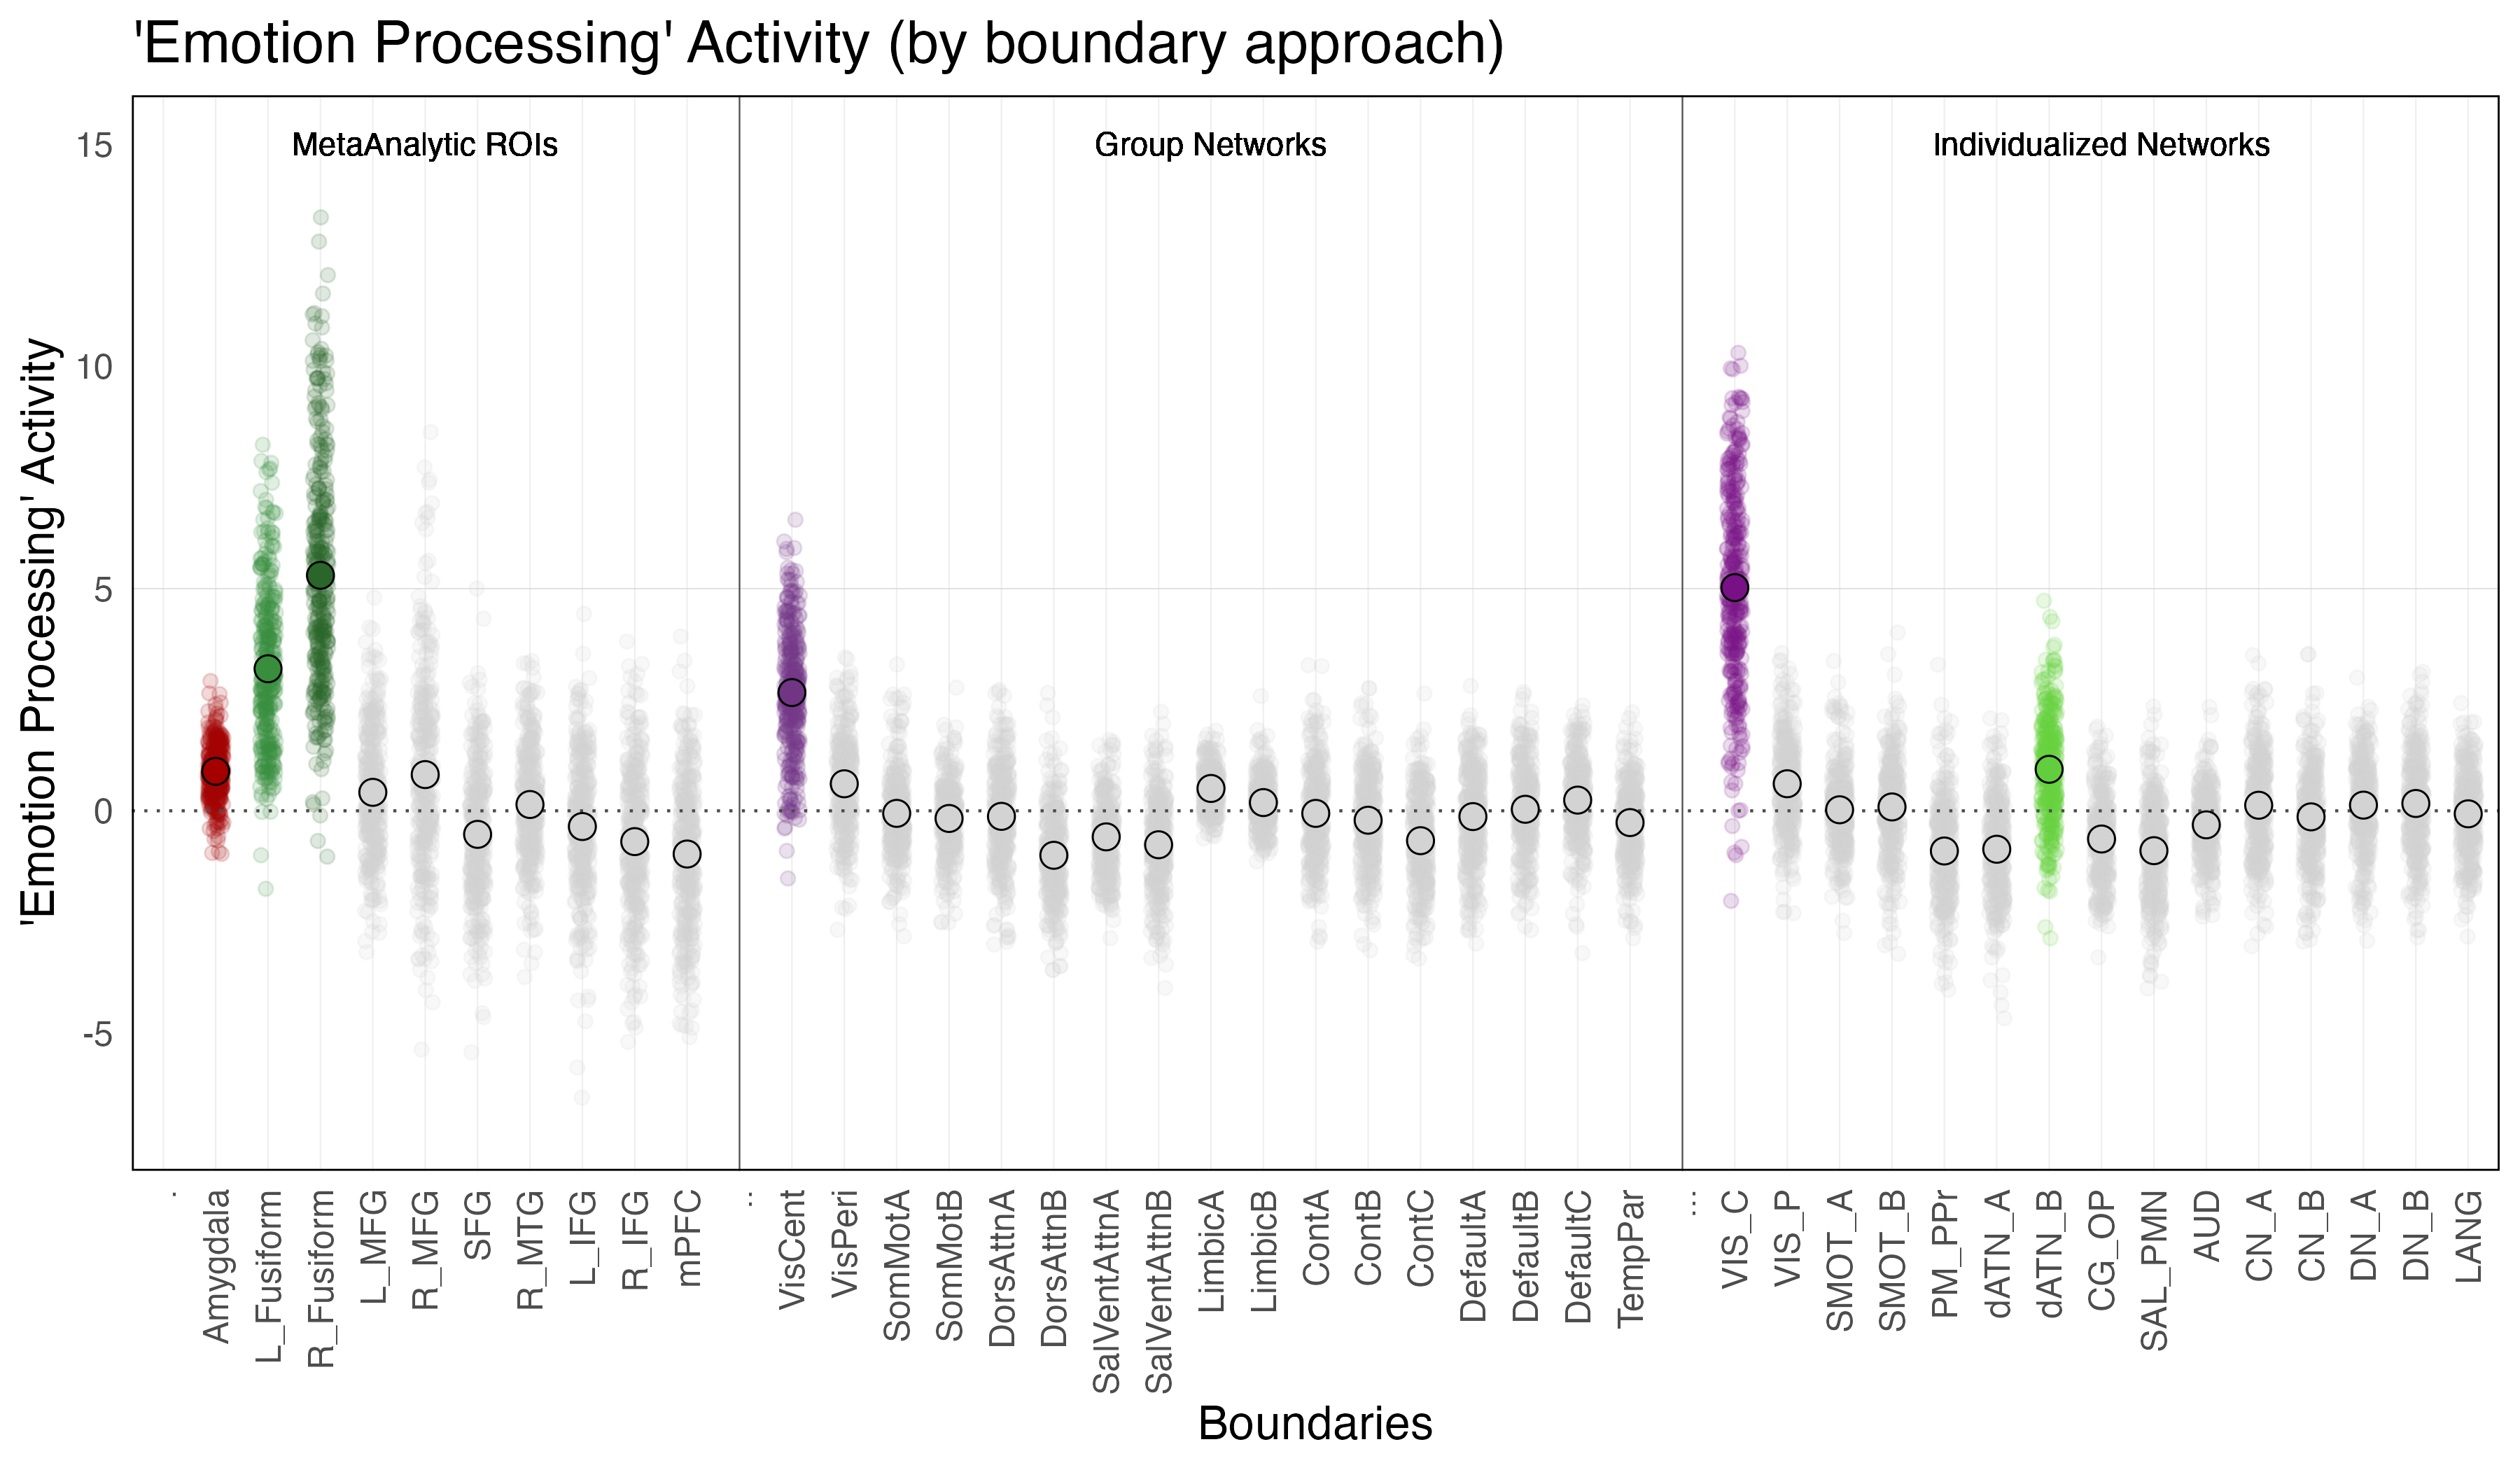
In the following analysis the activity during emotion processing within individualized networks will be examined alongside activity in the the amygdala, as well as in a set of meta-analytic regions of interest, and group average networks.
Primary Question: Do the individualized networks exhibit significant activity during emotion processing?
Reminder: We will only consider activity during emotion processing that is the result of more positive activity during the faces condition as compared to the shapes condition. Any activity that is the result of less negative activity during the faces condition as compared to the shapes condition will not be highlighted below.
Boundary Activity:

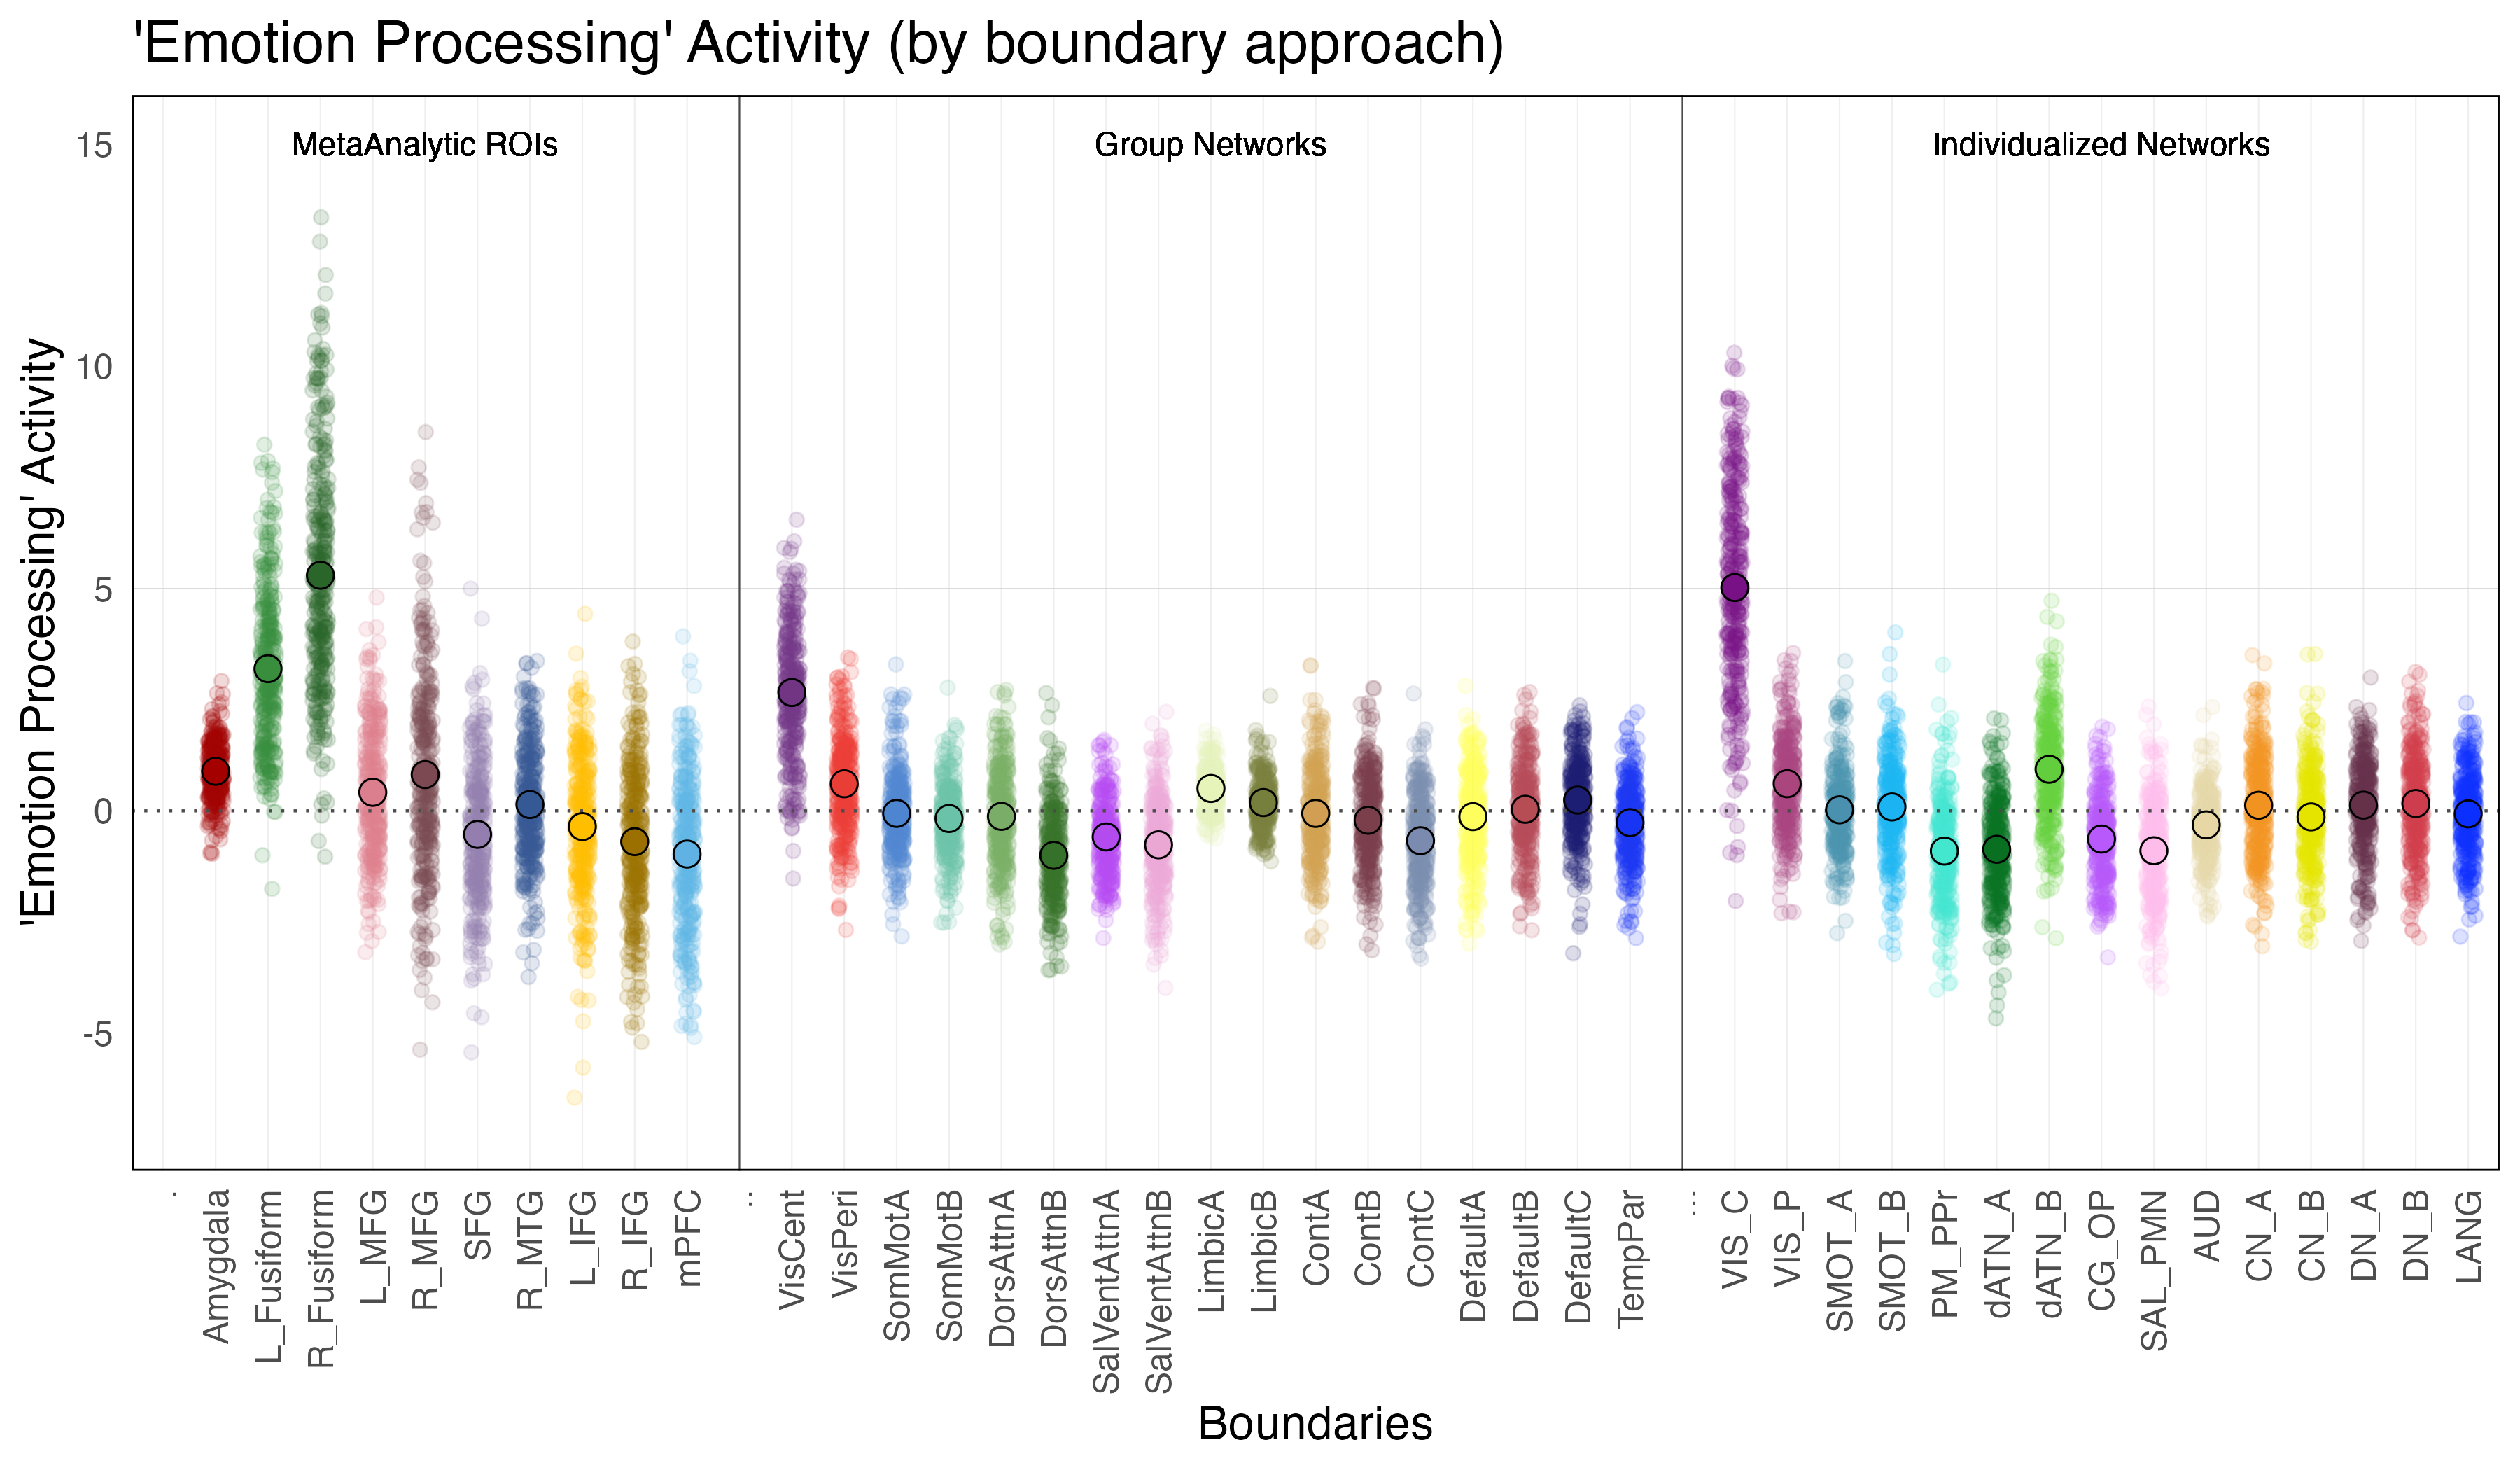
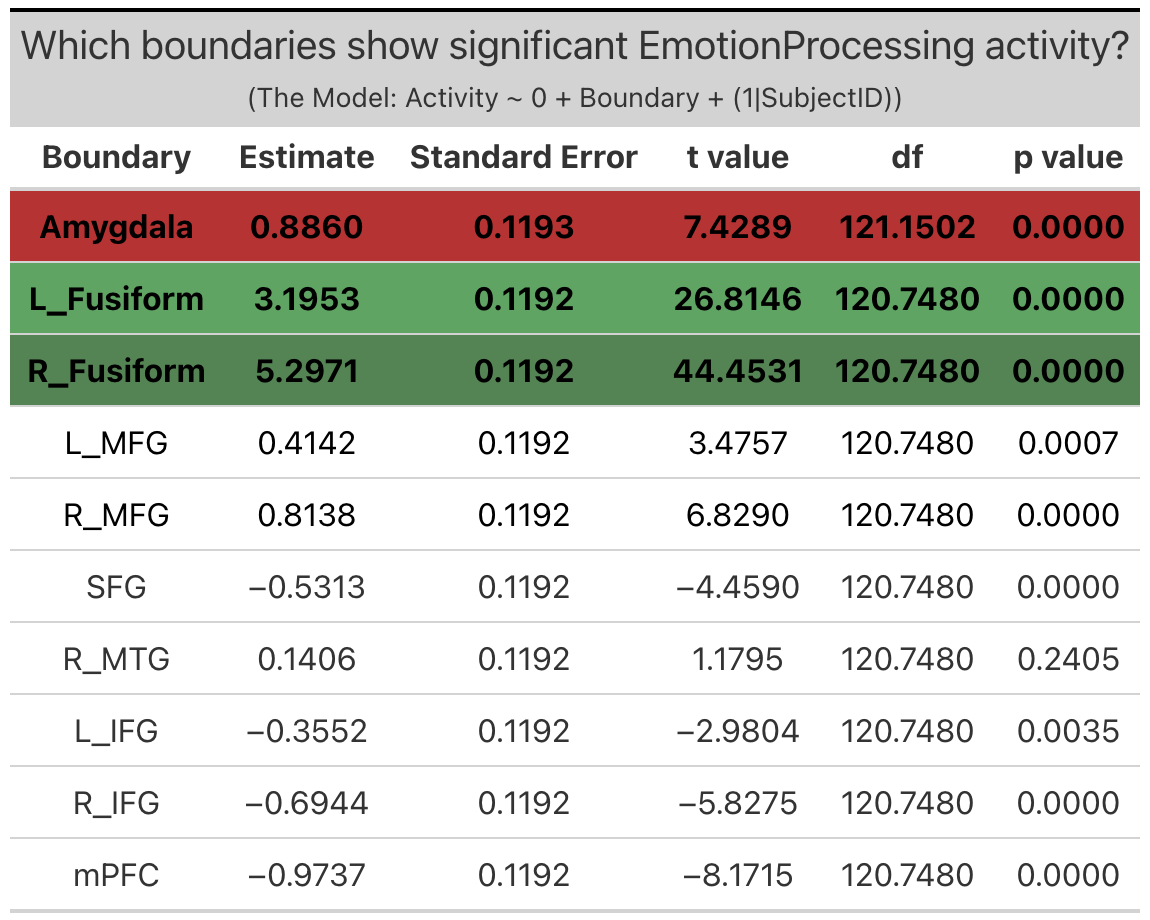
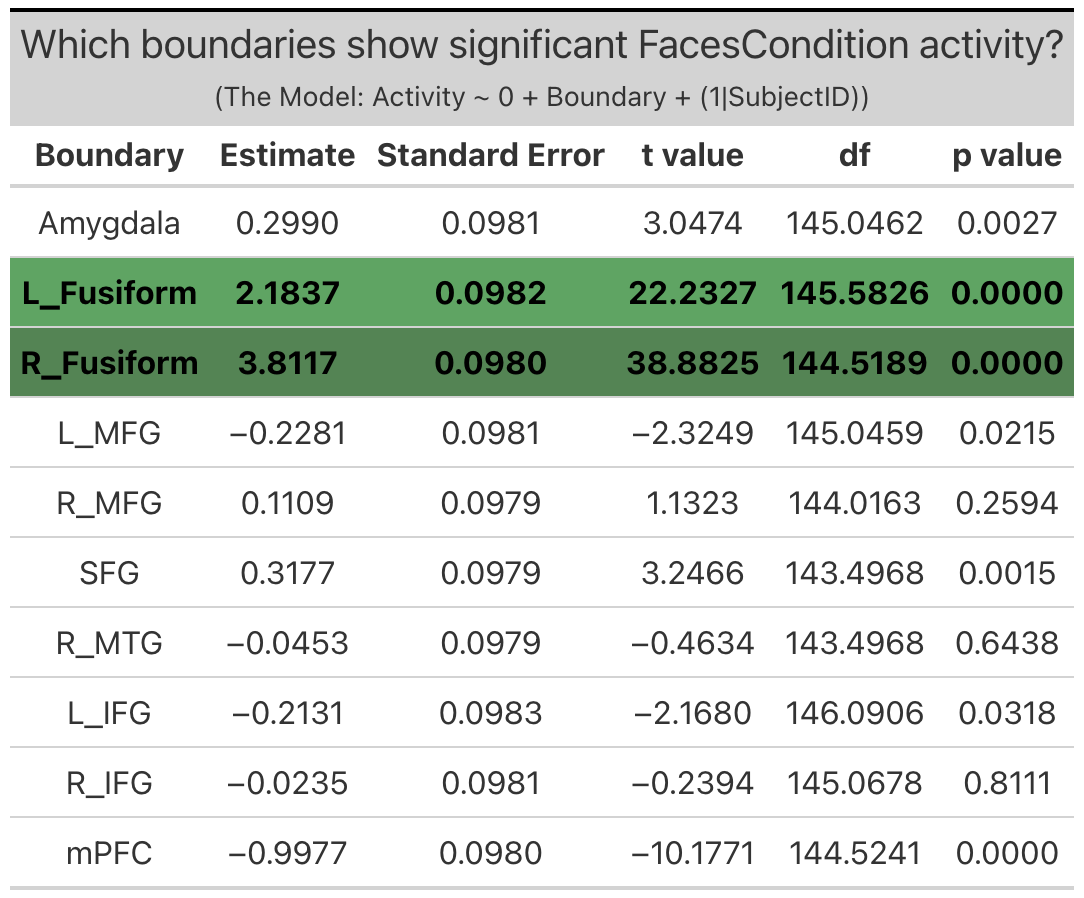
Amygdala. The amygdala exhibited significant activity during emotion processing (b = 0.89; SE = 0.12, p < 0.0001). Though the amygdala exhibited significant activity, examination of amygdala activity during the faces and shape conditions independently reveals that the emotion processing activity observed is the result of only a slight increase in activity above zero during the faces condition and a slight decrease below zero during the shapes condition.
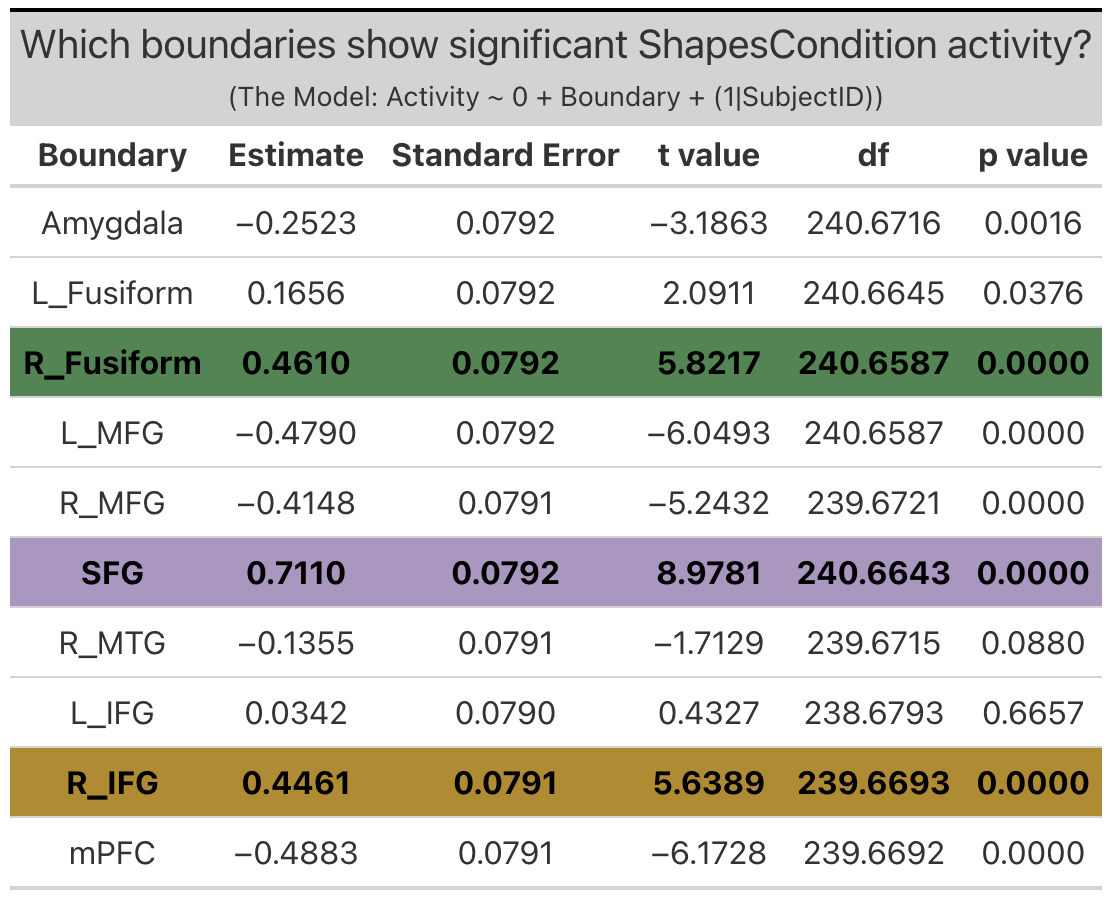
Meta-Analytic Regions of Interest (ROIs). Two meta-analytic regions of interest (ROIs) exhibited significant activity during emotion processing: left fusiform (b = 3.2, SE = 0.13, p < 0.0001) and right fusiform ((b = 5.3, SE = 0.13, p < 0.0001). It is interesting to note the laterilization in activity between the right and left fusiform, with the right fusiform exhibiting notably more activity that the left. (Note: left MFG, right MFG and right MTG technically exhibited significant activity during emotion processing, but this activity was the result of less negative activity during the faces condition as compared to the shapes condition, and so will not be considered in further investigations).
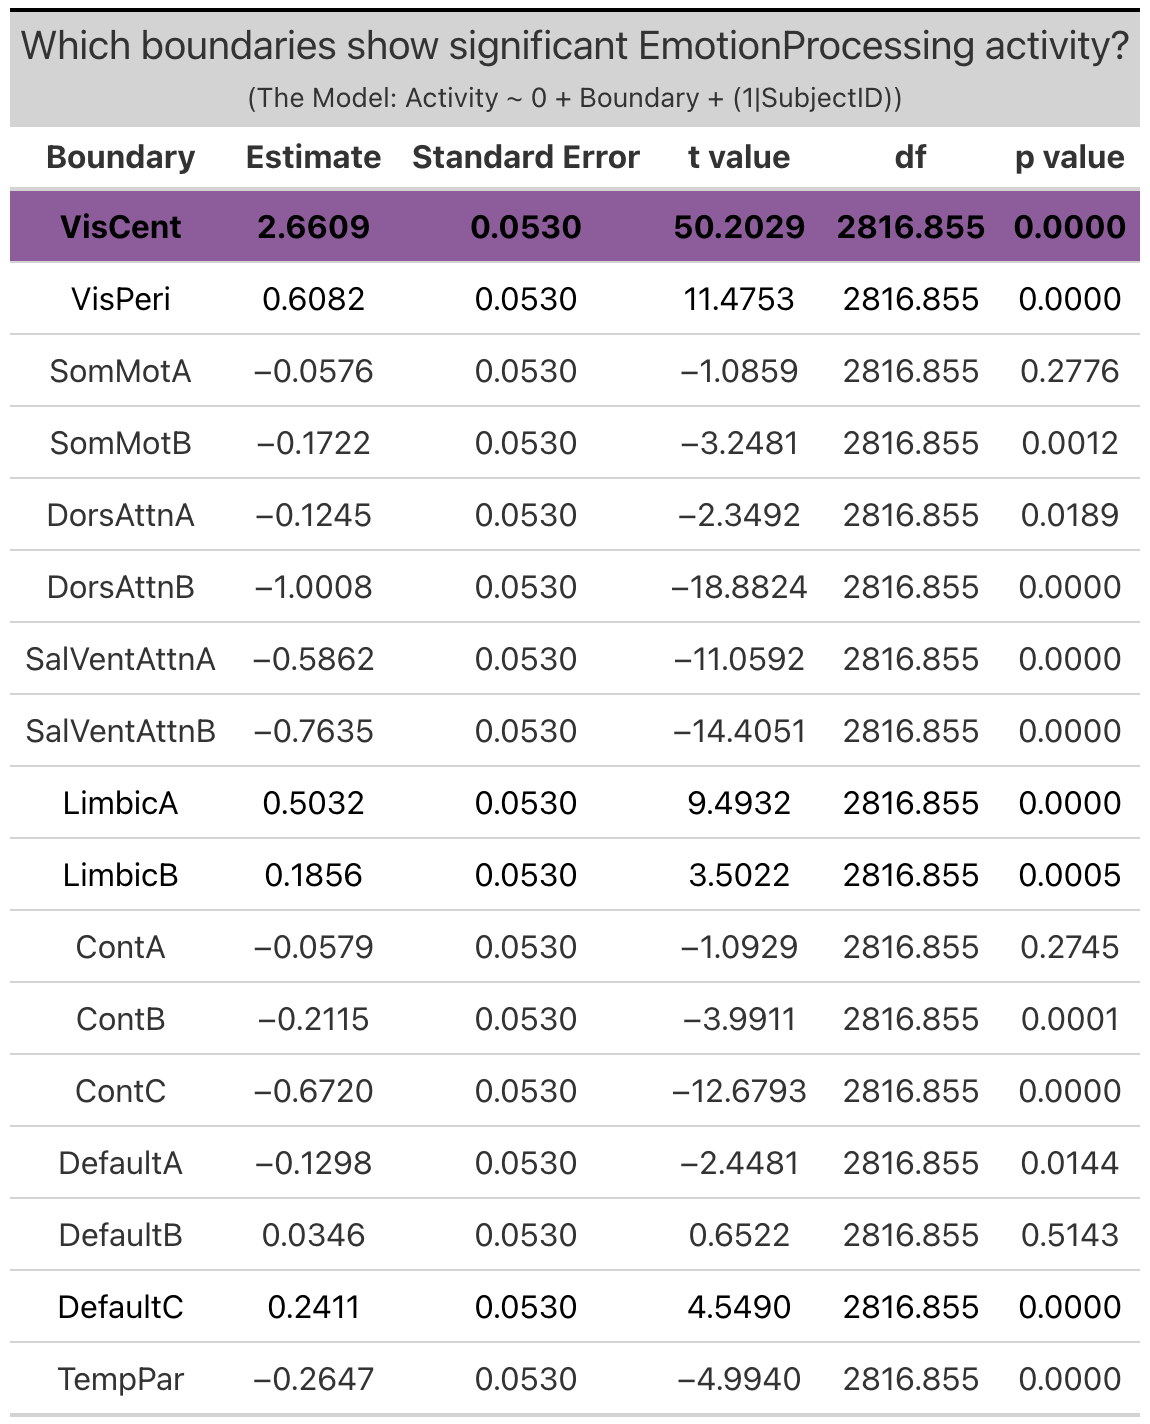
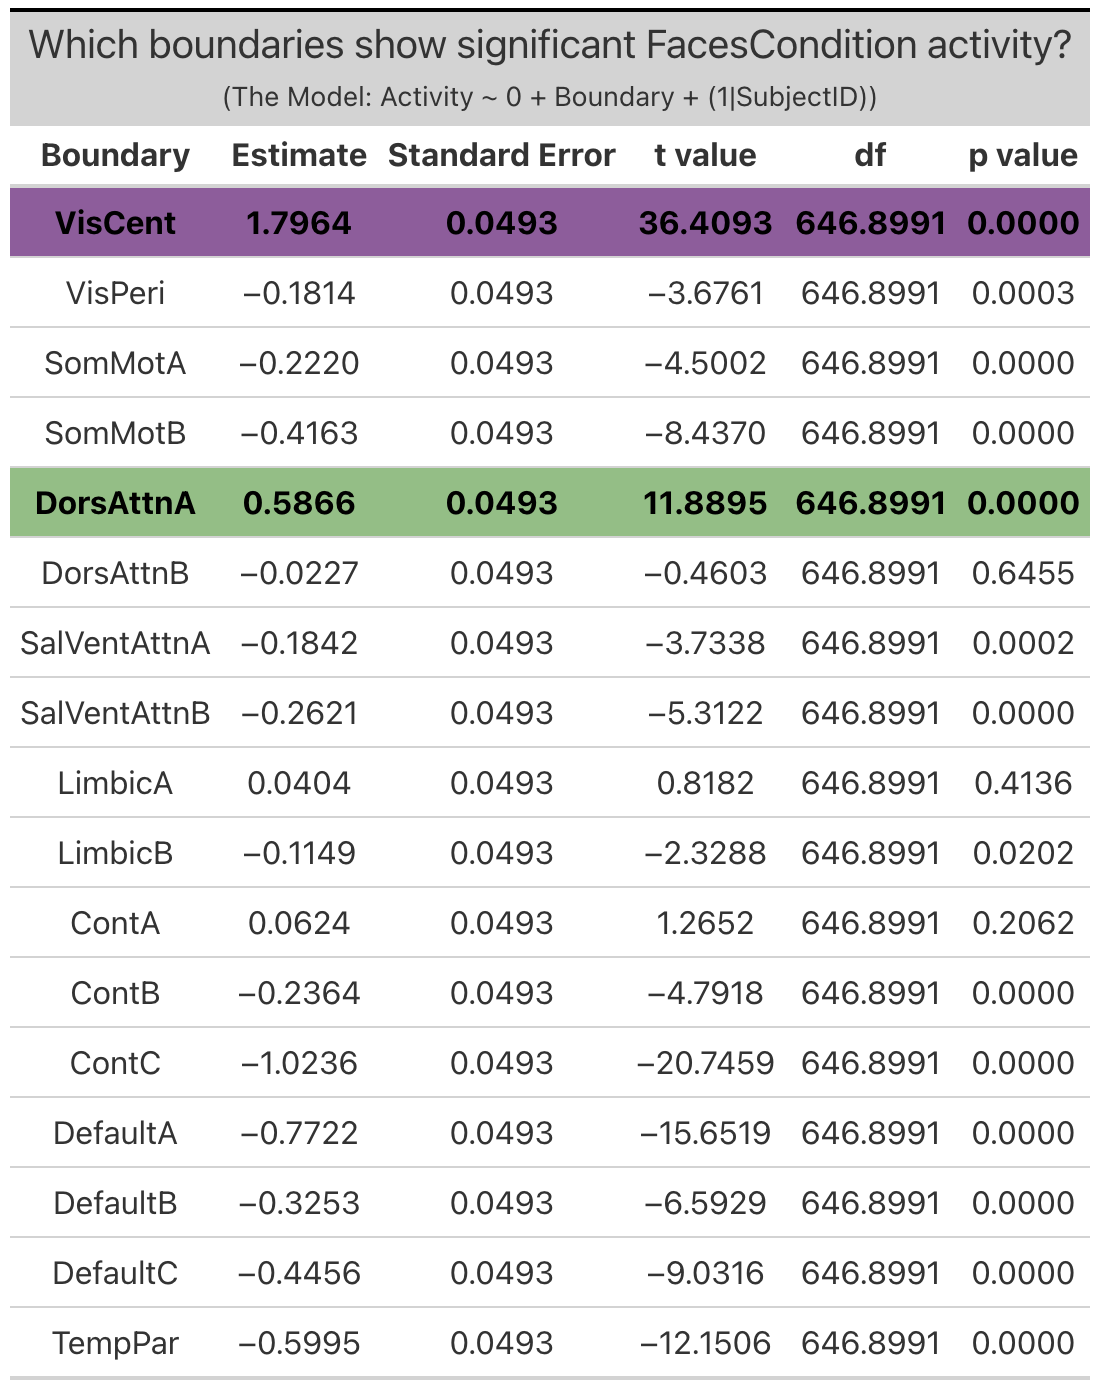
Group Networks. The only group network that exhibited significant activity during emotion processing was the visual-central network (VisCent) (b = 2.7, SE = 0.053, p < 0.0001). (Note: visual-peripheral network (VisPeri), default network C (DefaultC), limbic A and limbic B technically also exhibited significant activity, but again this activity was the result of less negative activity during the faces condition as compared to the shapes condition, and so will not be considered in further investigations). Given the effects observed within the dorsal attention network B of the individualized networks (detailed below) I additionally reviewed activity within dorsal attention A of the group networks, the topological equivalent network despite alternate naming convention. Reviewing the face and shapes condition activity independently revealed significant activity within dorsal attention network a (DorsAttnA) for both the faces condition (b = 0.59, SE = 0.049, p < 0.0001) and the shapes condition (b = 0.68,SE = 0.048, p < 0.0001)). However, this activity was not meaningfully different between conditions, unlike in the individualized networks, where dorsal attention network B (dATN-B) exhibited significant activity during emotion processing given increased activation during the faces condition as compared to the shapes condition.
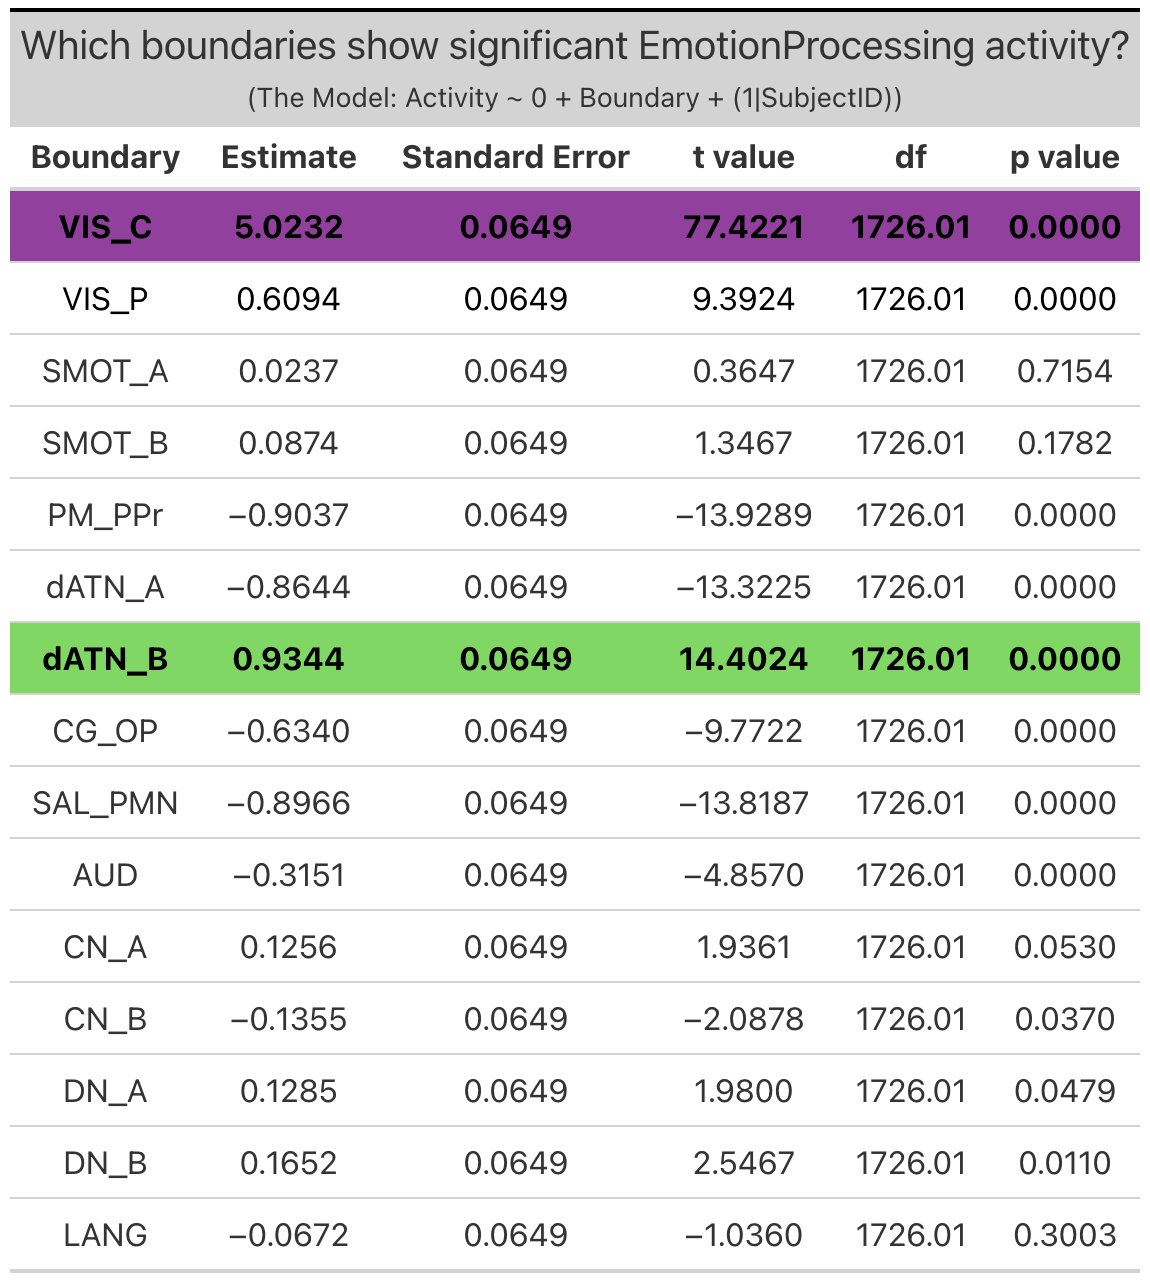
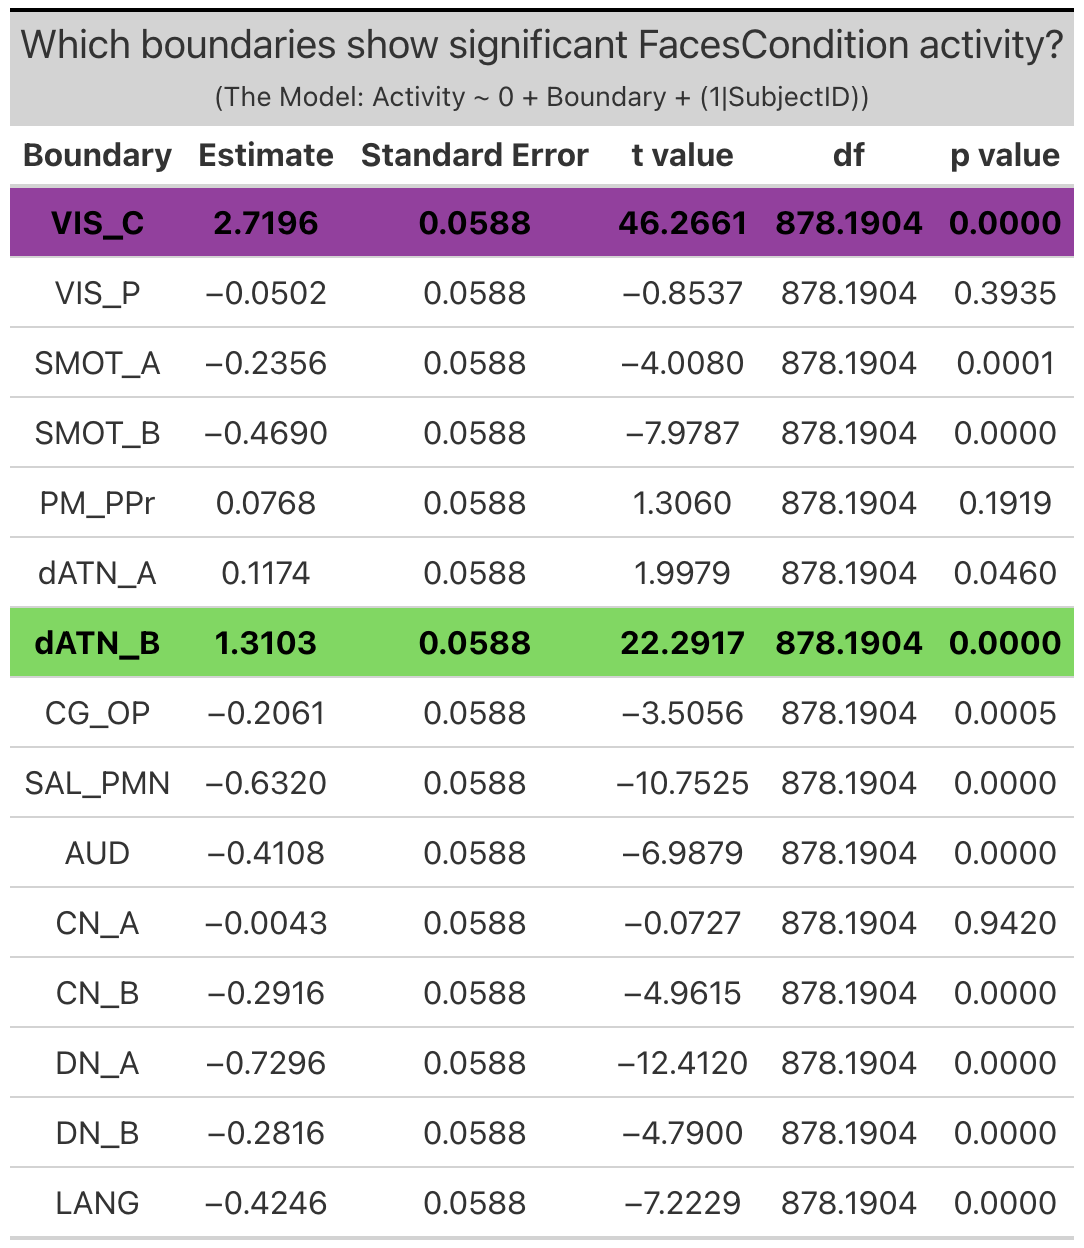
Individualized Networks. Two individualized networks exhibited significant activity during emotion processing: the visual-central network (VIS-C) (b = 5.0, SE = 0.065, p < 0.0001), and dorsal attention network B (dATN-B) (b = 0.93, SE = 0.065, p < 0.0001). (Note: visual-peripheral network (VIS-P), but again this activity was the result of less negative activity during the faces condition as compared to the shapes condition, and so will not be considered in further investigations).
Results Tables
Amygdala. The amygdala exhibited significant activity during emotion processing (b = 0.89; SE = 0.12, p < 0.0001). Though the amygdala exhibited significant activity, examination of amygdala activity during the faces and shape conditions independently reveals that the emotion processing activity observed is the result of only a slight increase in activity above zero during the faces condition and a slight decrease below zero during the shapes condition.
Meta-Analytic Regions of Interest (ROIs). Two meta-analytic regions of interest (ROIs) exhibited significant activity during emotion processing: left fusiform (b = 3.2, SE = 0.13, p < 0.0001) and right fusiform ((b = 5.3, SE = 0.13, p < 0.0001). It is interesting to note the laterilization in activity between the right and left fusiform, with the right fusiform exhibiting notably more activity that the left. (Note: left MFG, right MFG and right MTG technically exhibited significant activity during emotion processing, but this activity was the result of less negative activity during the faces condition as compared to the shapes condition, and so will not be considered in further investigations).
Group Networks. The only group network that exhibited significant activity during emotion processing was the visual-central network (VisCent) (b = 2.7, SE = 0.053, p < 0.0001). (Note: visual-peripheral network (VisPeri), default network C (DefaultC), limbic A and limbic B technically also exhibited significant activity, but again this activity was the result of less negative activity during the faces condition as compared to the shapes condition, and so will not be considered in further investigations). Given the effects observed within the dorsal attention network B of the individualized networks (detailed below) I additionally reviewed activity within dorsal attention A of the group networks, the topological equivalent network despite alternate naming convention. Reviewing the face and shapes condition activity independently revealed significant activity within dorsal attention network a (DorsAttnA) for both the faces condition (b = 0.59, SE = 0.049, p < 0.0001) and the shapes condition (b = 0.68,SE = 0.048, p < 0.0001)). However, this activity was not meaningfully different between conditions, unlike in the individualized networks, where dorsal attention network B (dATN-B) exhibited significant activity during emotion processing given increased activation during the faces condition as compared to the shapes condition.
Individualized Networks. Two individualized networks exhibited significant activity during emotion processing: the visual-central network (VIS-C) (b = 5.0, SE = 0.065, p < 0.0001), and dorsal attention network B (dATN-B) (b = 0.93, SE = 0.065, p < 0.0001). (Note: visual-peripheral network (VIS-P), but again this activity was the result of less negative activity during the faces condition as compared to the shapes condition, and so will not be considered in further investigations).
Results Tables
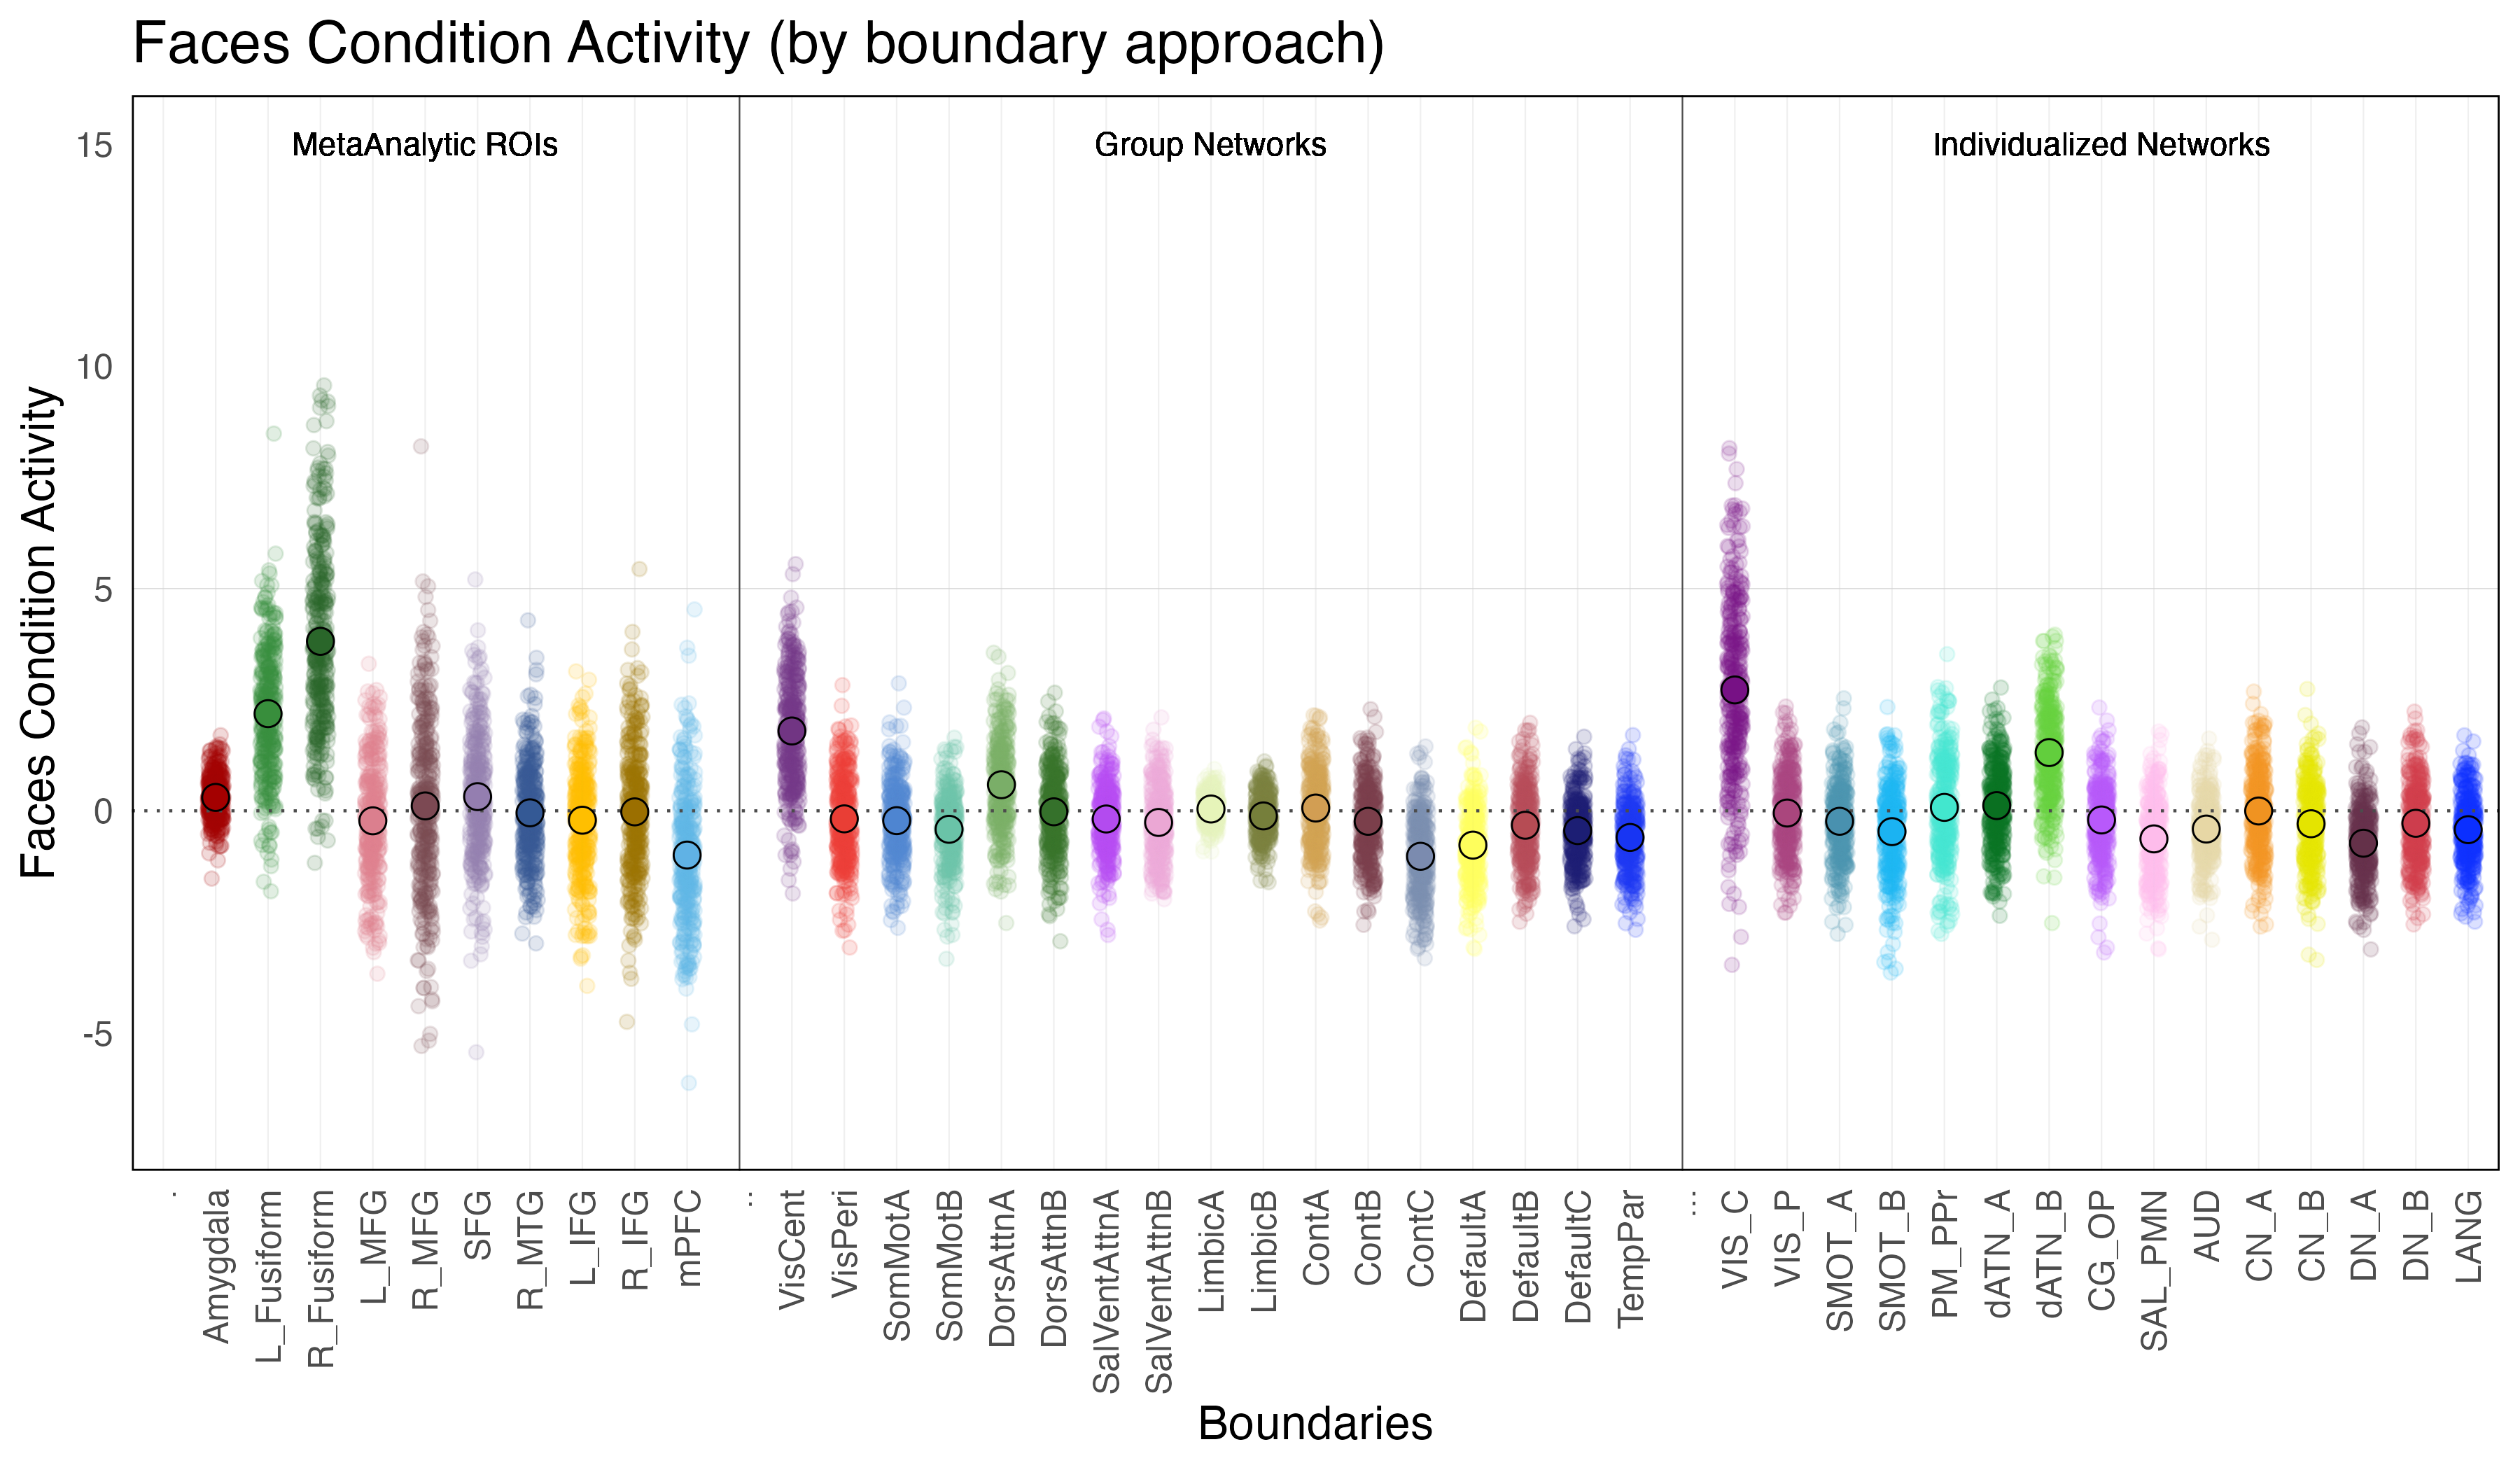
Faces Condition Activity is defined as the difference in activation during the faces condition relative to ‘baseline’ (ie. when the subjects are observing a fixation cross in between trials).
Results Tables
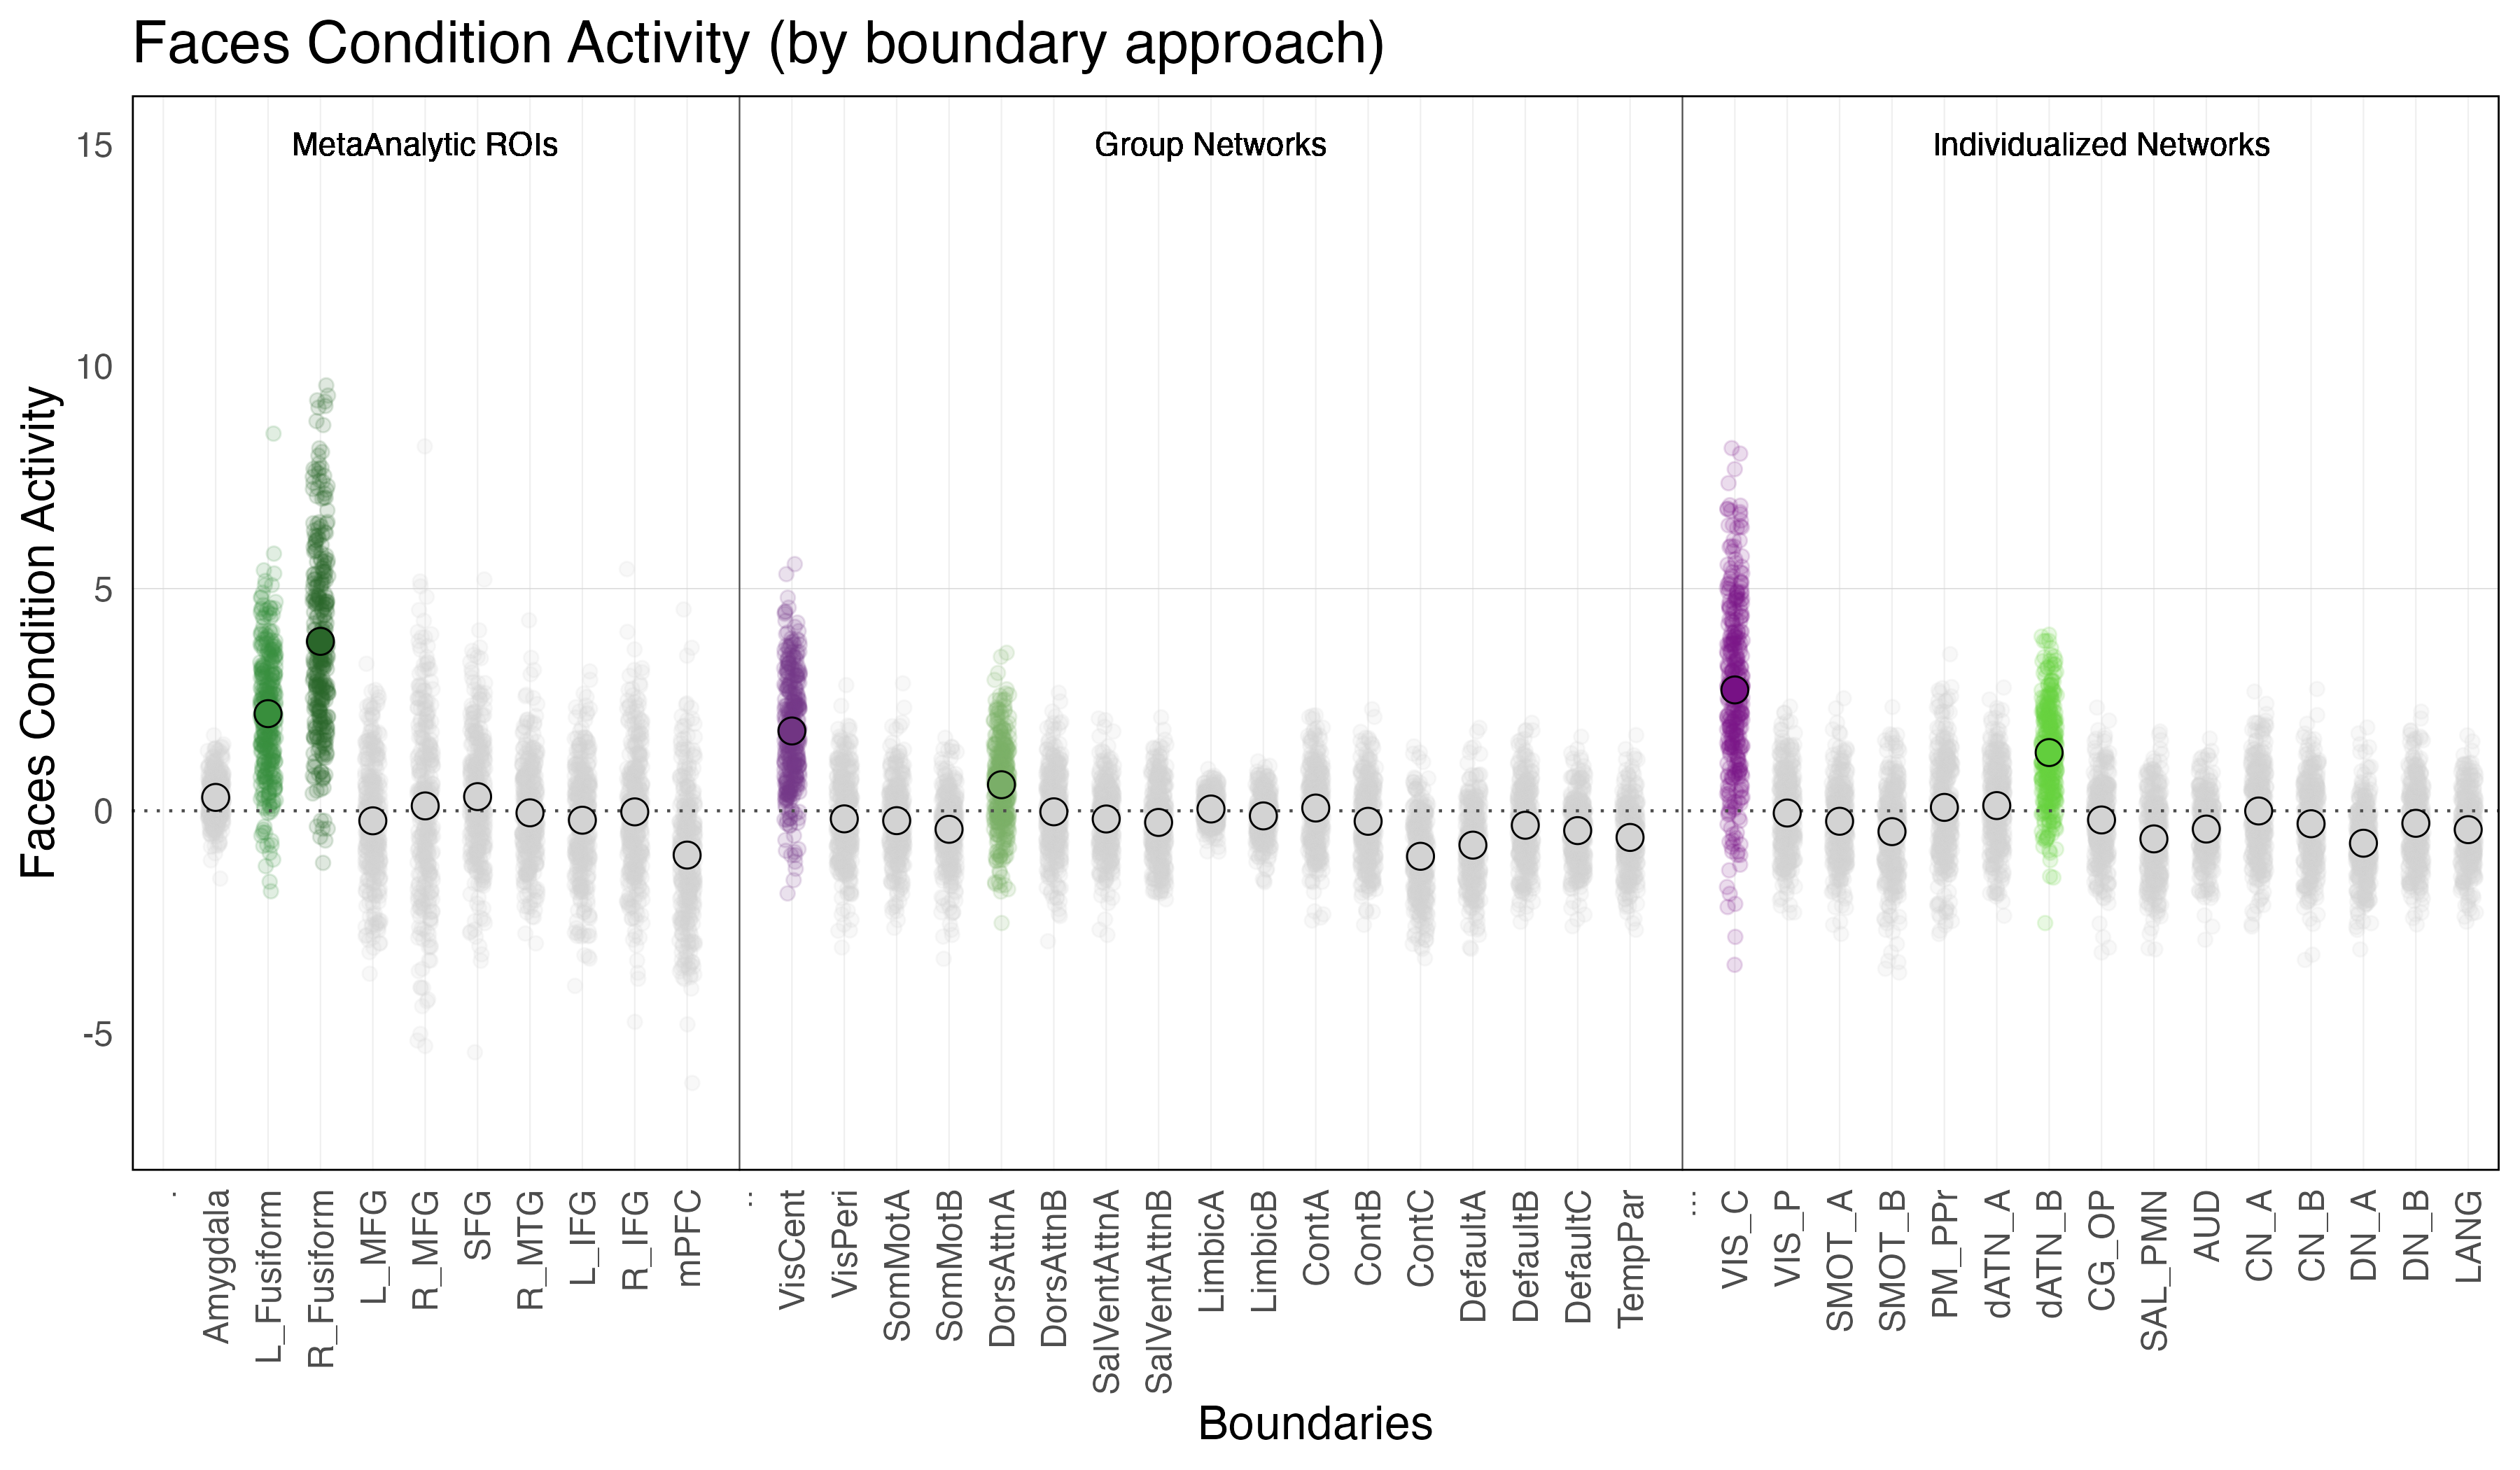
Faces Condition Activity is defined as the difference in activation during the faces condition relative to ‘baseline’ (ie. when the subjects are observing a fixation cross in between trials).
Results Tables
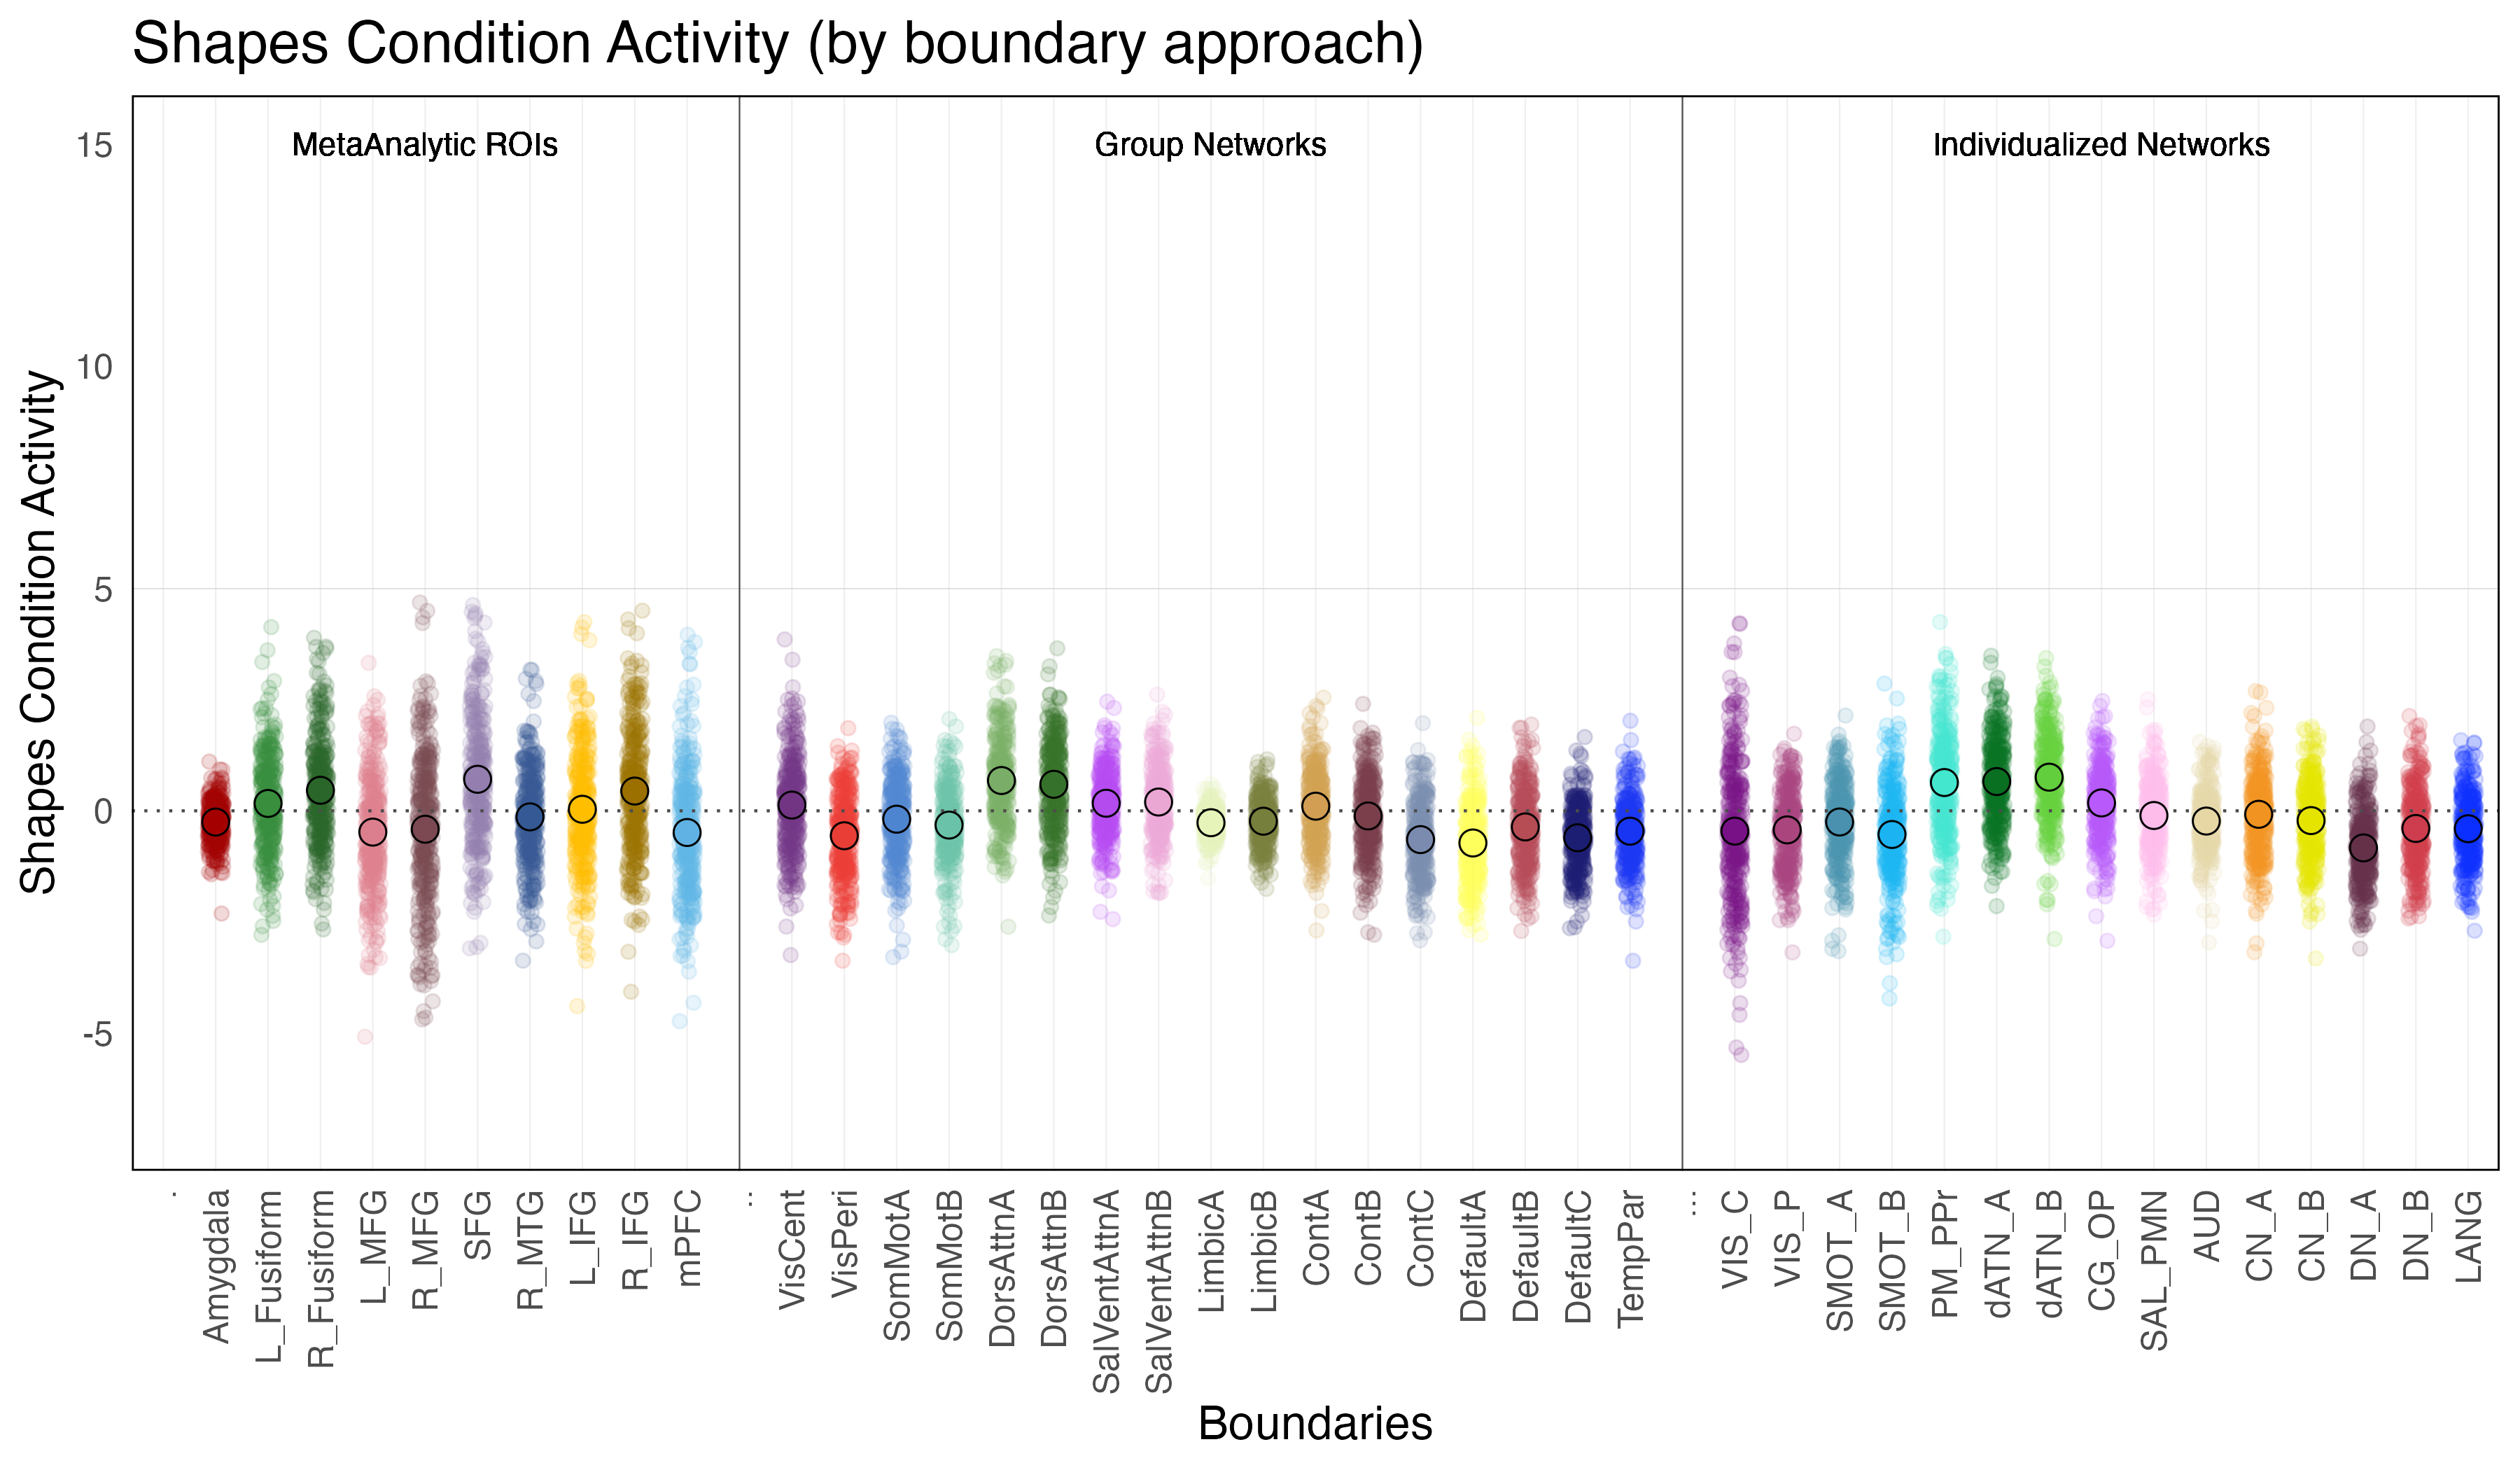
Shapes Condition Activity is defined as the difference in activation during the shapes condition relative to baseline (ie. when the subjects are observing a fixation cross in between trials).
Results Tables
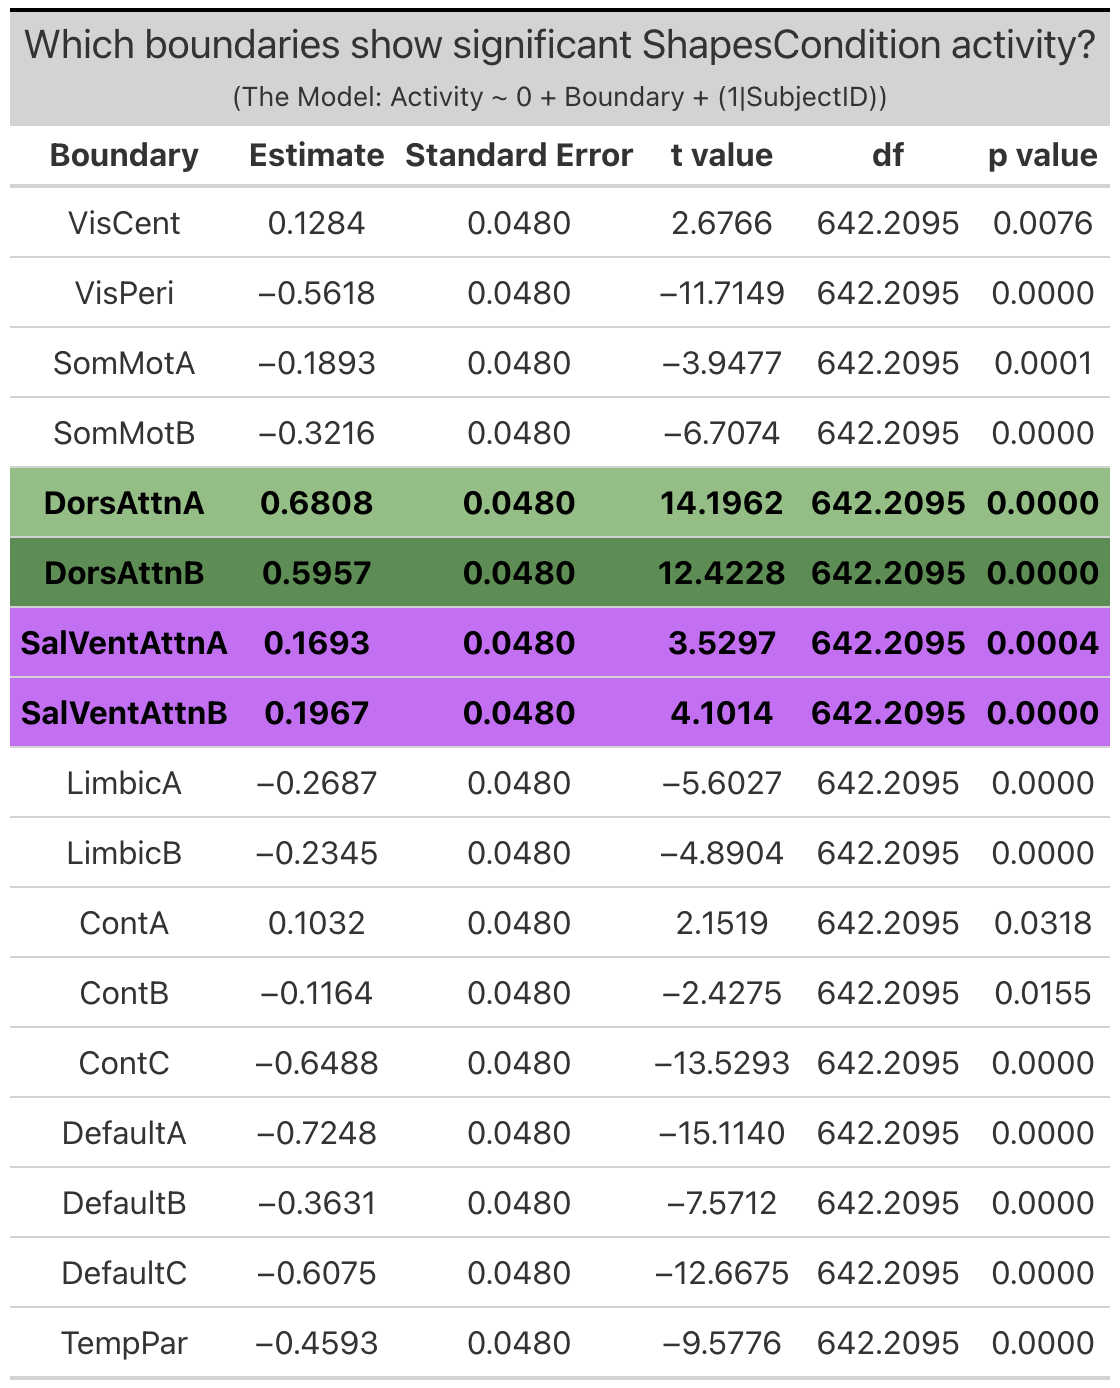
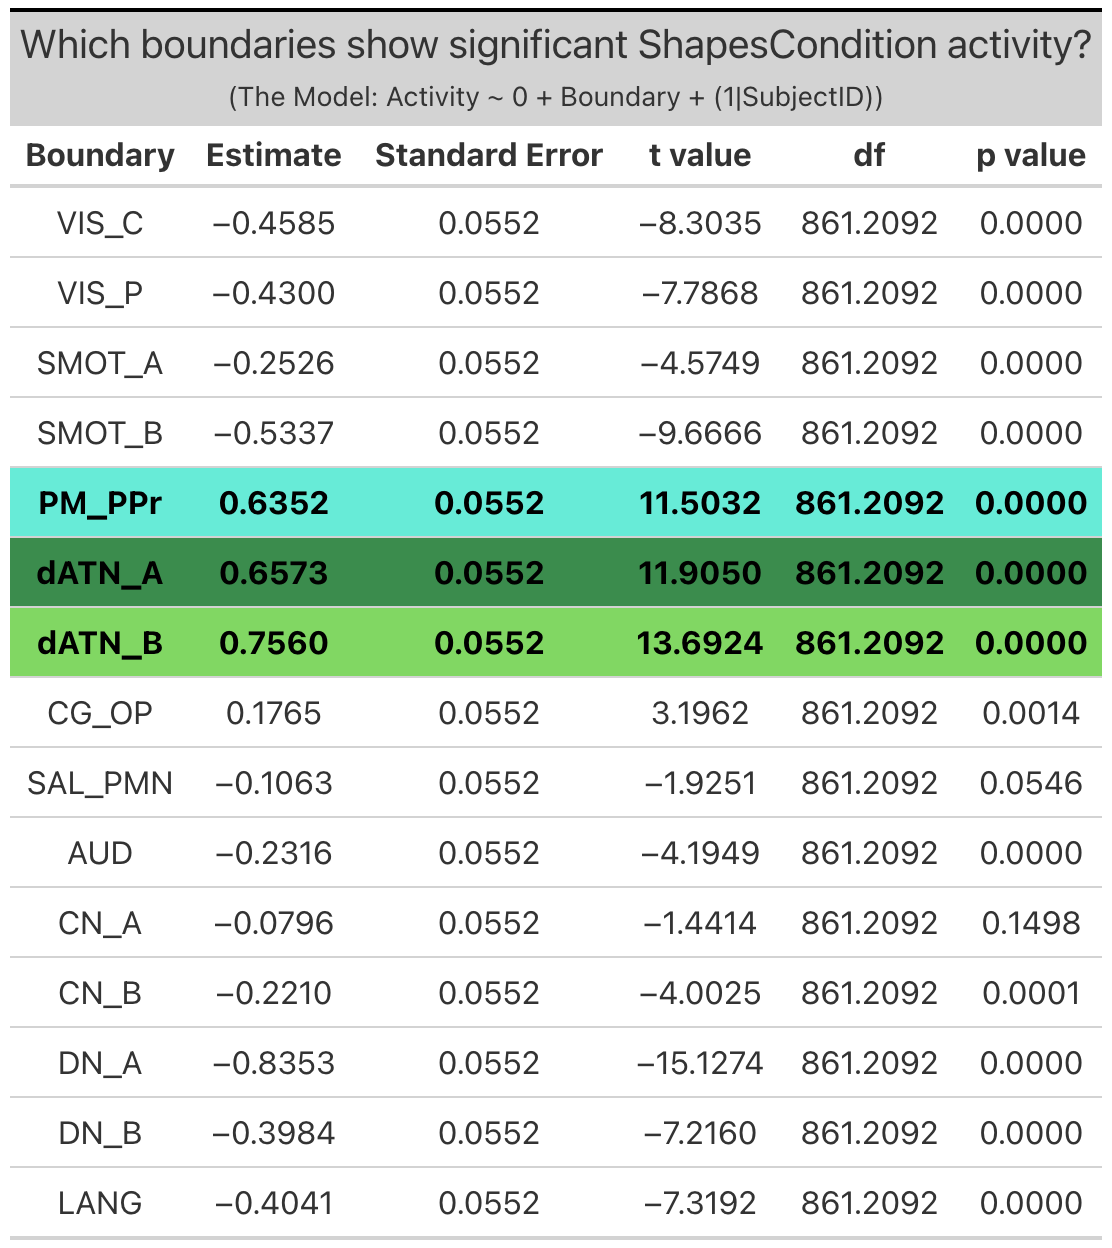
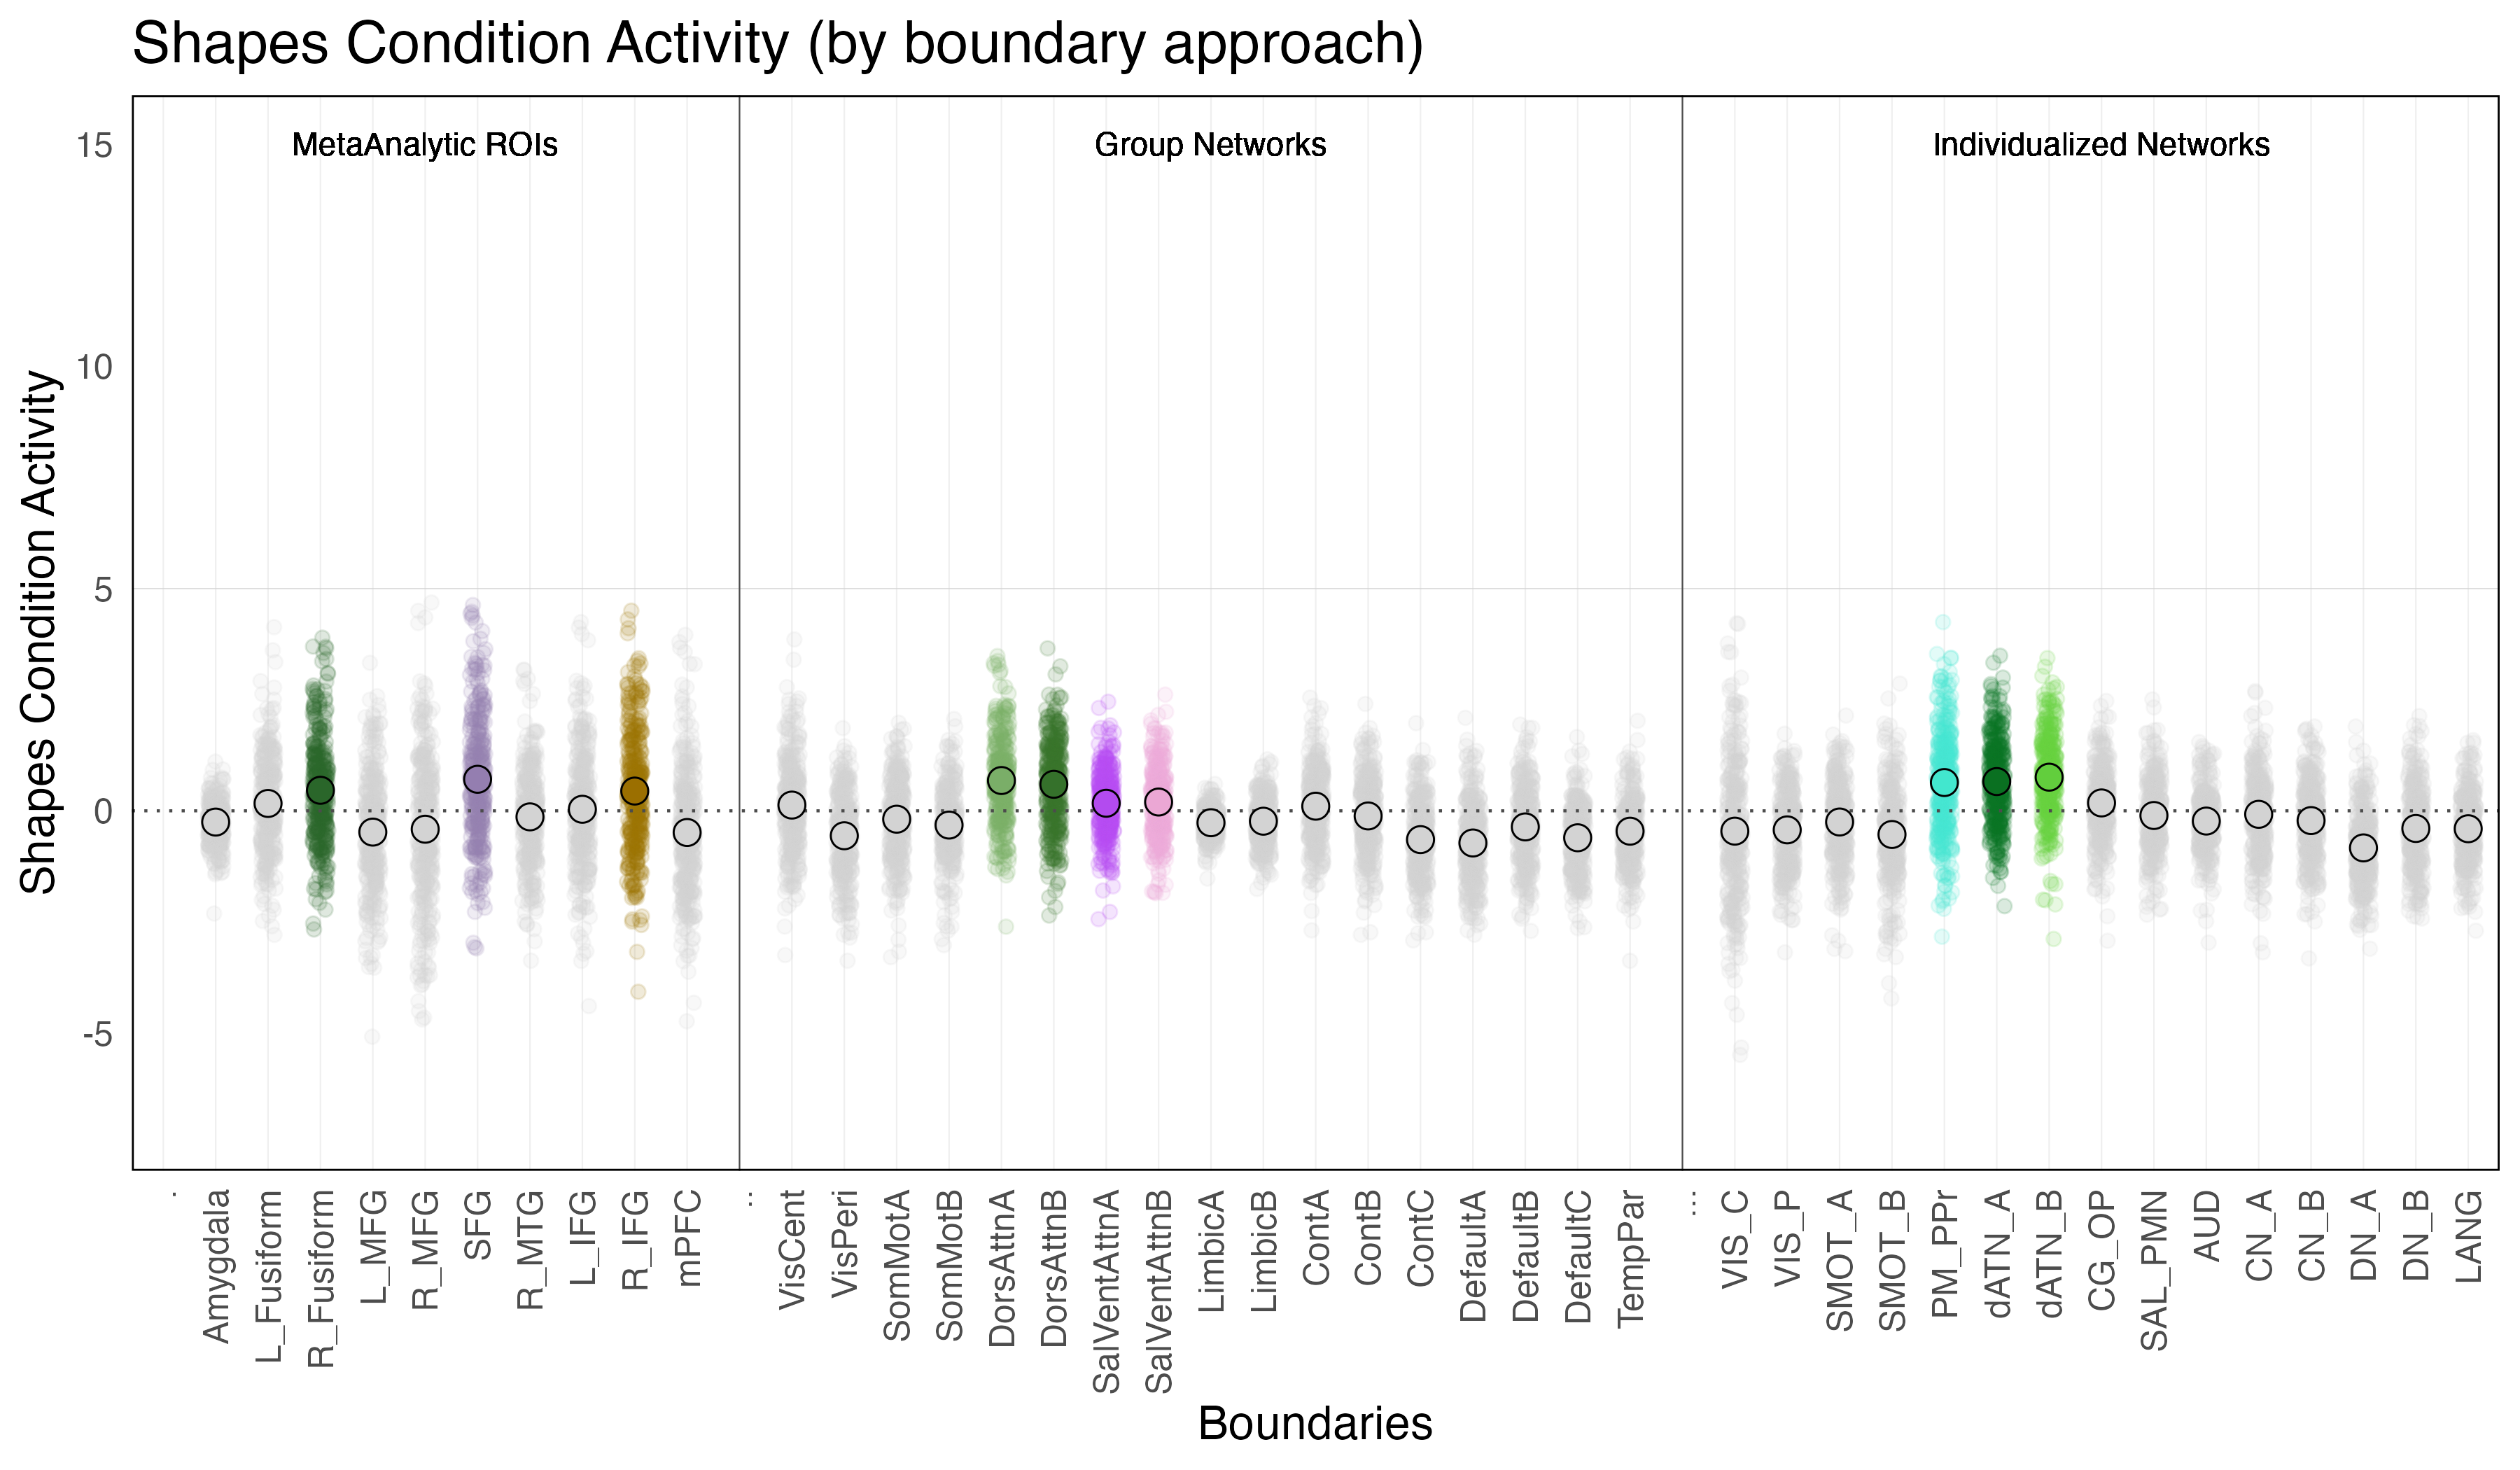
Shapes Condition Activity is defined as the difference in activation during the shapes condition relative to baseline (ie. when the subjects are observing a fixation cross in between trials).
Results Tables
Boundary Activity — Summary
In sum, significant activity during emotion processing was observed at both a regional level (amygdala, left and right fusiform), as well as at a network-level (visual-central network and dorsal attention network B (of the individualized networks)). The fusifrom and the individualized visual-central network showed comparable levels of activity during emotion processing. Significant activity was also observed within the visual-central network of the group average parcellation, however this activity was notably less than that observed in the individualized networks.
The fusiform falls within the ventral portion of the cortex that comprises portions of both the visual-central network (VIS-C) and portions of the dorsal attention network B (dATN-B). It is therefore possible that the network activity observed simply reflects fusiform activity driving up the average network activity. To examine this possibility, the topological overlap between the left and right fusiform and the networks will be examined to confirm ROI placement within the networks. Following the topological comparison, activity of each vertex within each network will be examined to determine if the observed increase in network activity is the result of global increased in activity across all vertices in a network or the result of increases within only a subset of vertices (ie. a region that falls within a network, such as the fusiform falling with the visual-central network).
UP NEXT: Topological Comparison – Fusiform vs. Networks
Primary Question: Where does the fusiform fall within the network parcellations?