Test-Retest Reliability
Primary Question: Do the individualized networks exhibit reliable ‘emotion processing’ activity?
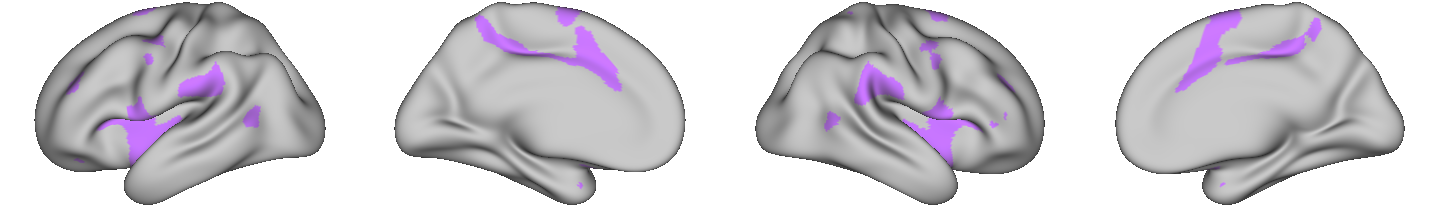
The following plot displays the test-retest reliability of emotion processing activity within the the amygdala, a set of meta-analytically defined regions of interest, group average networks, as well as individualized networks. Here test-retest reliability is estimated using intra class correlations (ICCs) and reflects the temporal stability of activity across participants in the sample (Chen et al., 2021, Koo and Li, 2016; Shrout and Fleiss, 1979). ICCs are the ratio of between-subject variability relative to the total amount of variance in ‘emotion processing’ activity observed within a given boundary (Total Variance: Between-subject variance + Error). ICCs range from 0 to 1, with 1 indicating perfect reliability, such that at timepoint 1, the subject who exhibited the most ‘emotion processing’ activity also exhibited the most ‘emotion processing’ activity at timepoint 2, and so forth (ICC range: Poor (<0.4); Fair (0.4-0.6); Good (0.6-0.75); Excellent (>0.75)(Koo and Li, 2016)). For the purposes of this analysis we will pay particular attention to the boundaries that exhibited significant activity for the contrast of Faces > Shapes as demonstrated in Project 2: the amygdala, the right fusiform, the left fusiform, visual-central network and dorsal attention network B. While we have included the group networks here for reference, they will not be included beyond this reliability analysis.
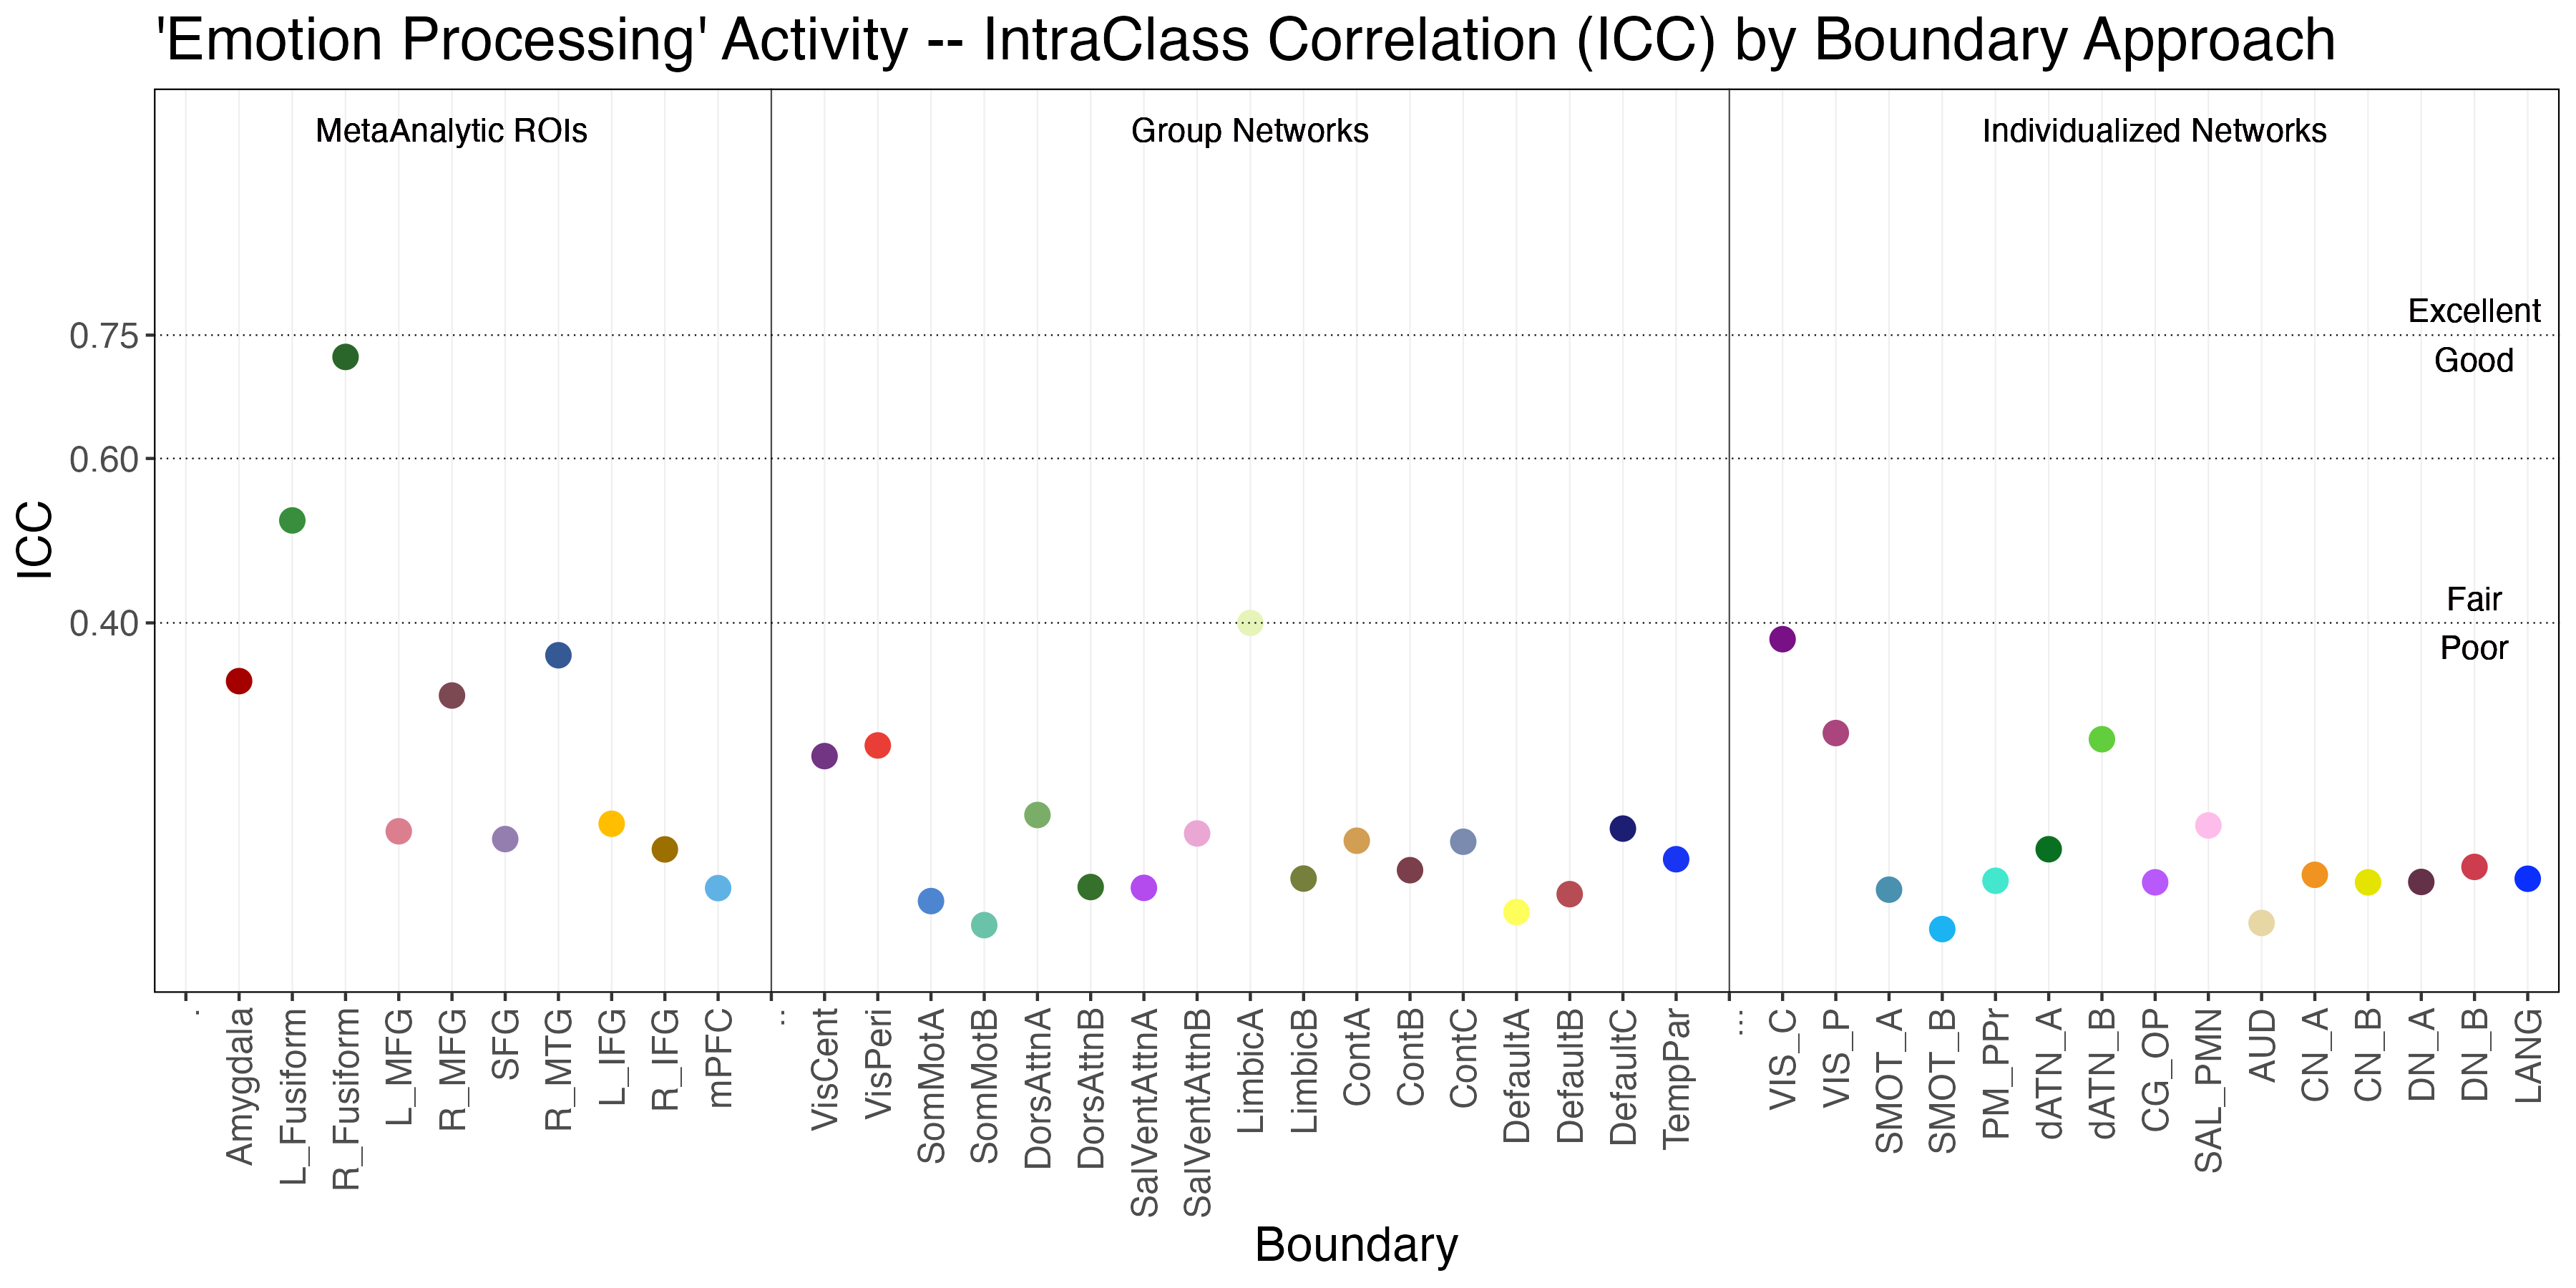
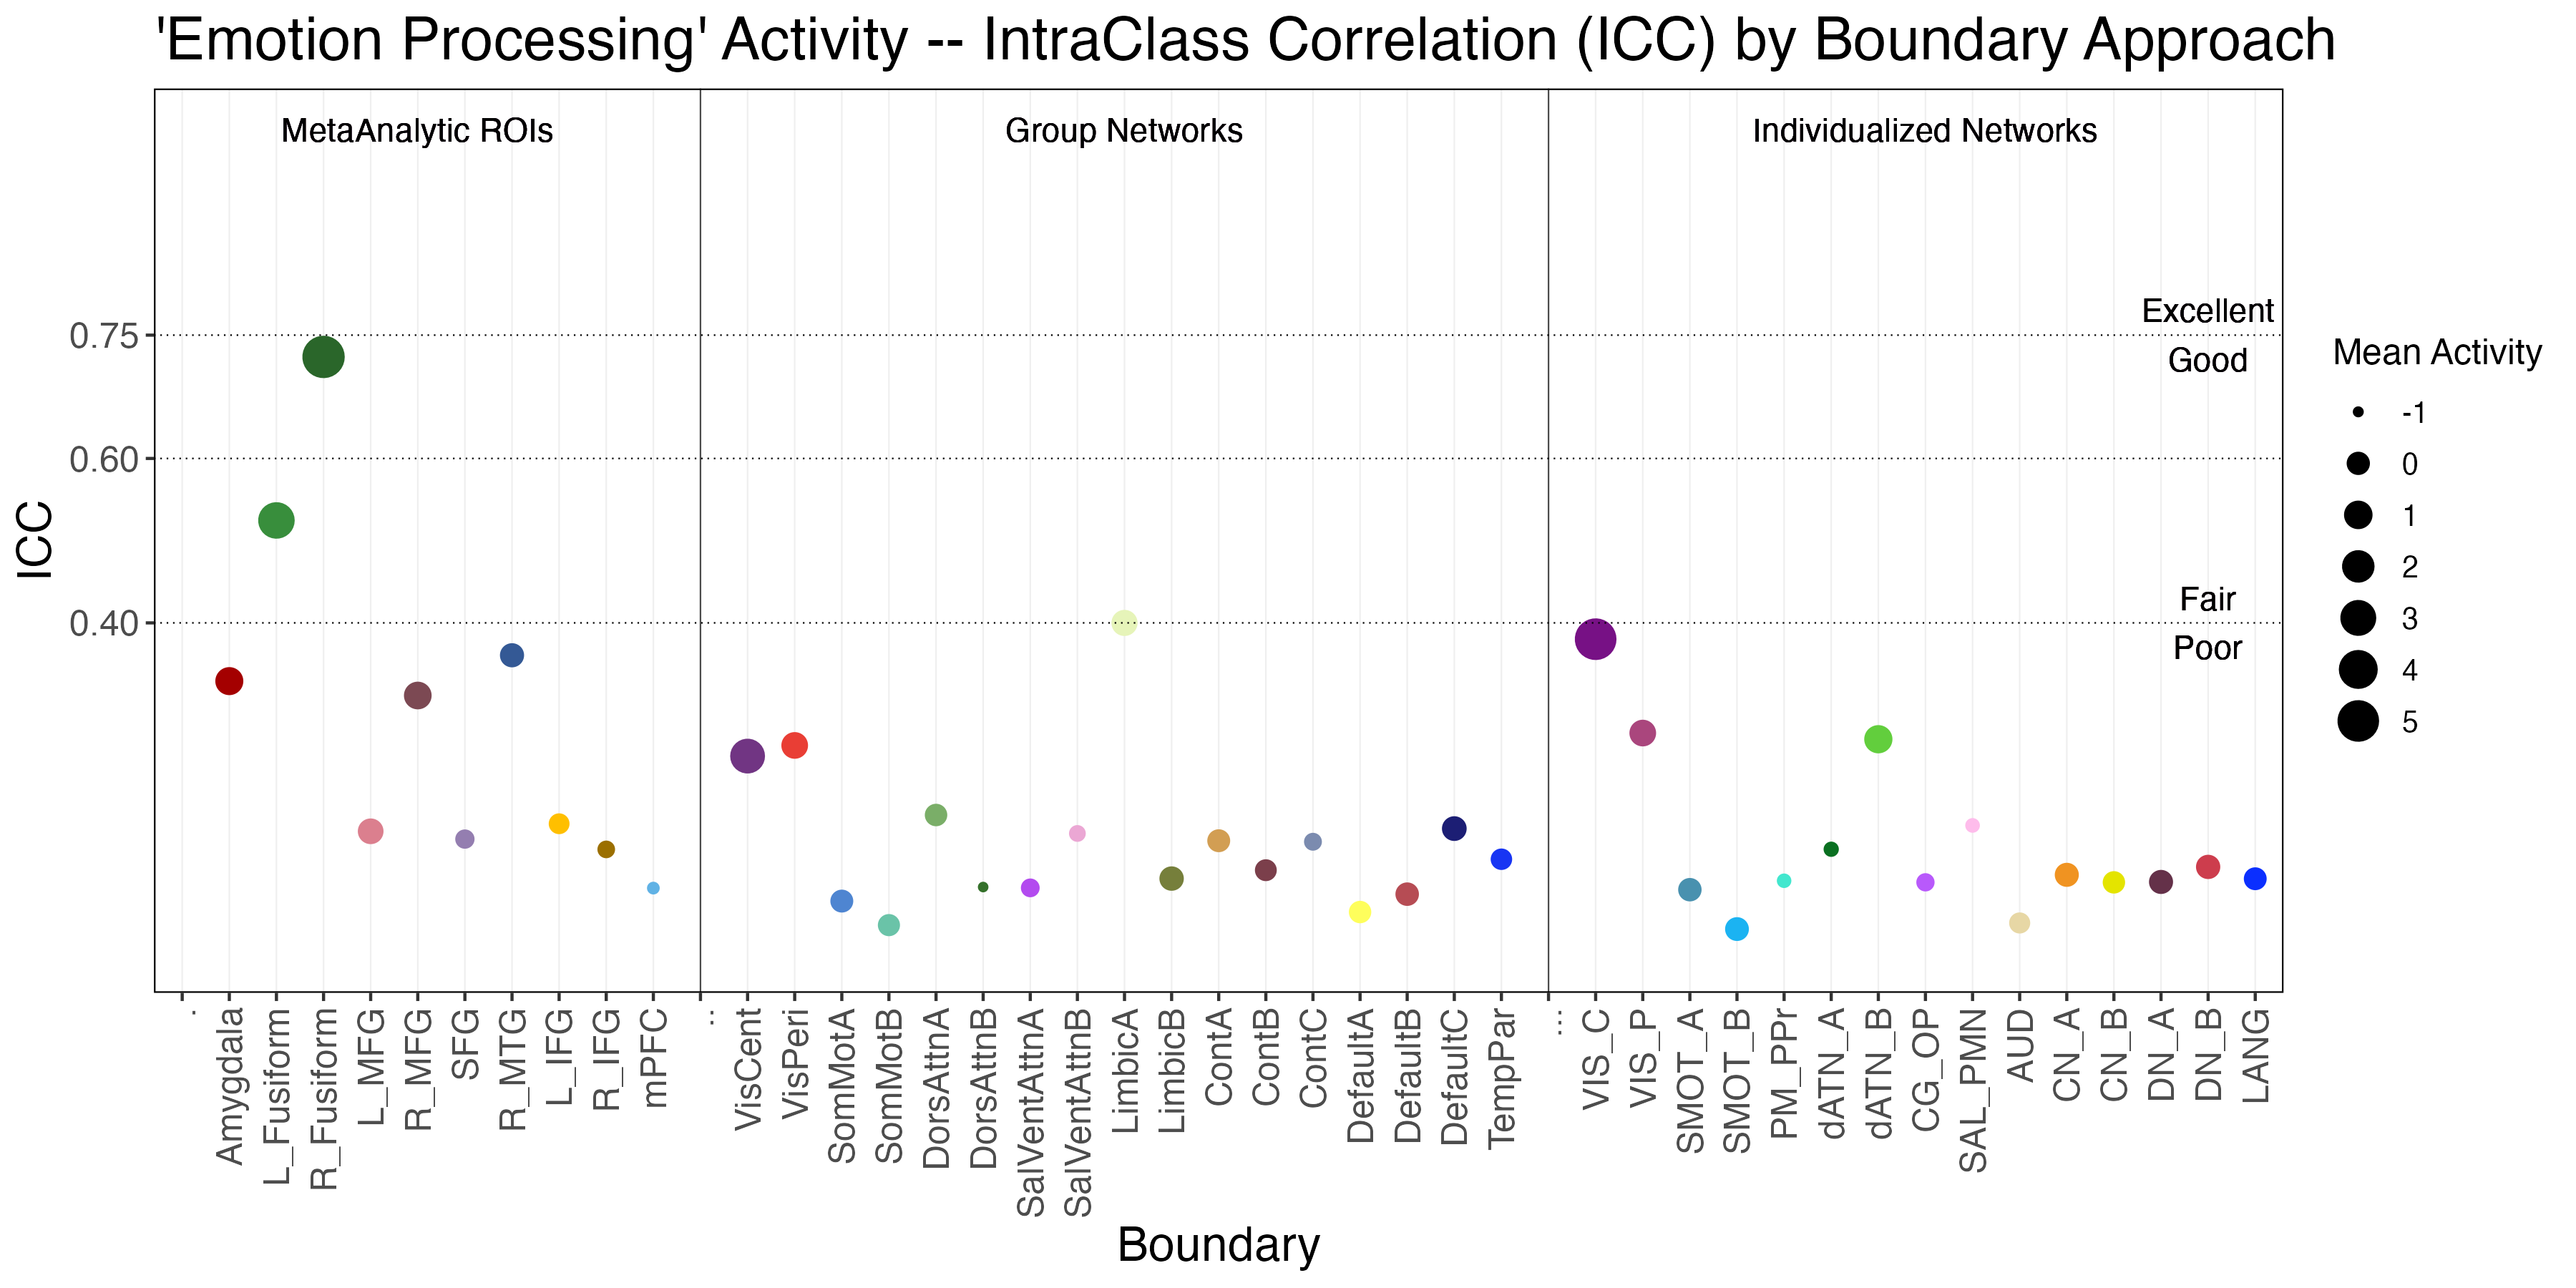
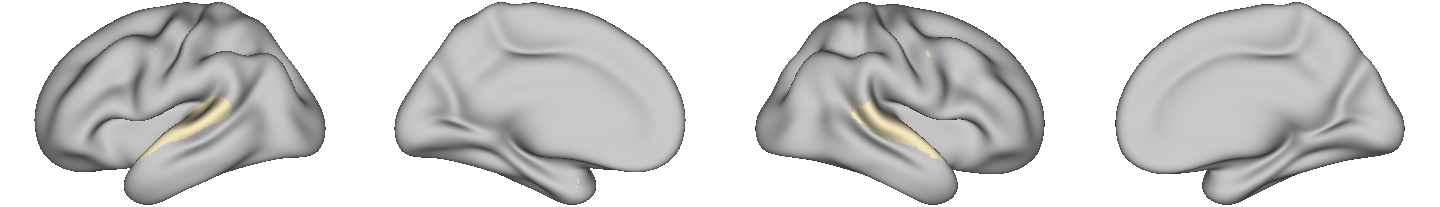
Meta Analytic Regions of Interest (ROIs) — The right fusiform shows the highest test-retest reliability of task-evoked activity for Faces > Shapes of all the boundaries examined, with an ICC value of 0.72 (ie. very good). The activity within the left fusiform also exhibited fair test-retest reliability, with an ICC value of 0.52. Activity within the amygdala, however, shows poor test-retest reliability, with an ICC value of 0.33. Importantly, the results observed here closely replicate the findings observed in a recent study of reliability of task-evoked BOLD signal where the amygdala (the task “target”) exhibited a low ICC (Elliot et al., 2020). Activity within other meta-analytic ROIs exhibited poor test-retest reliability with ICCs below 0.4.
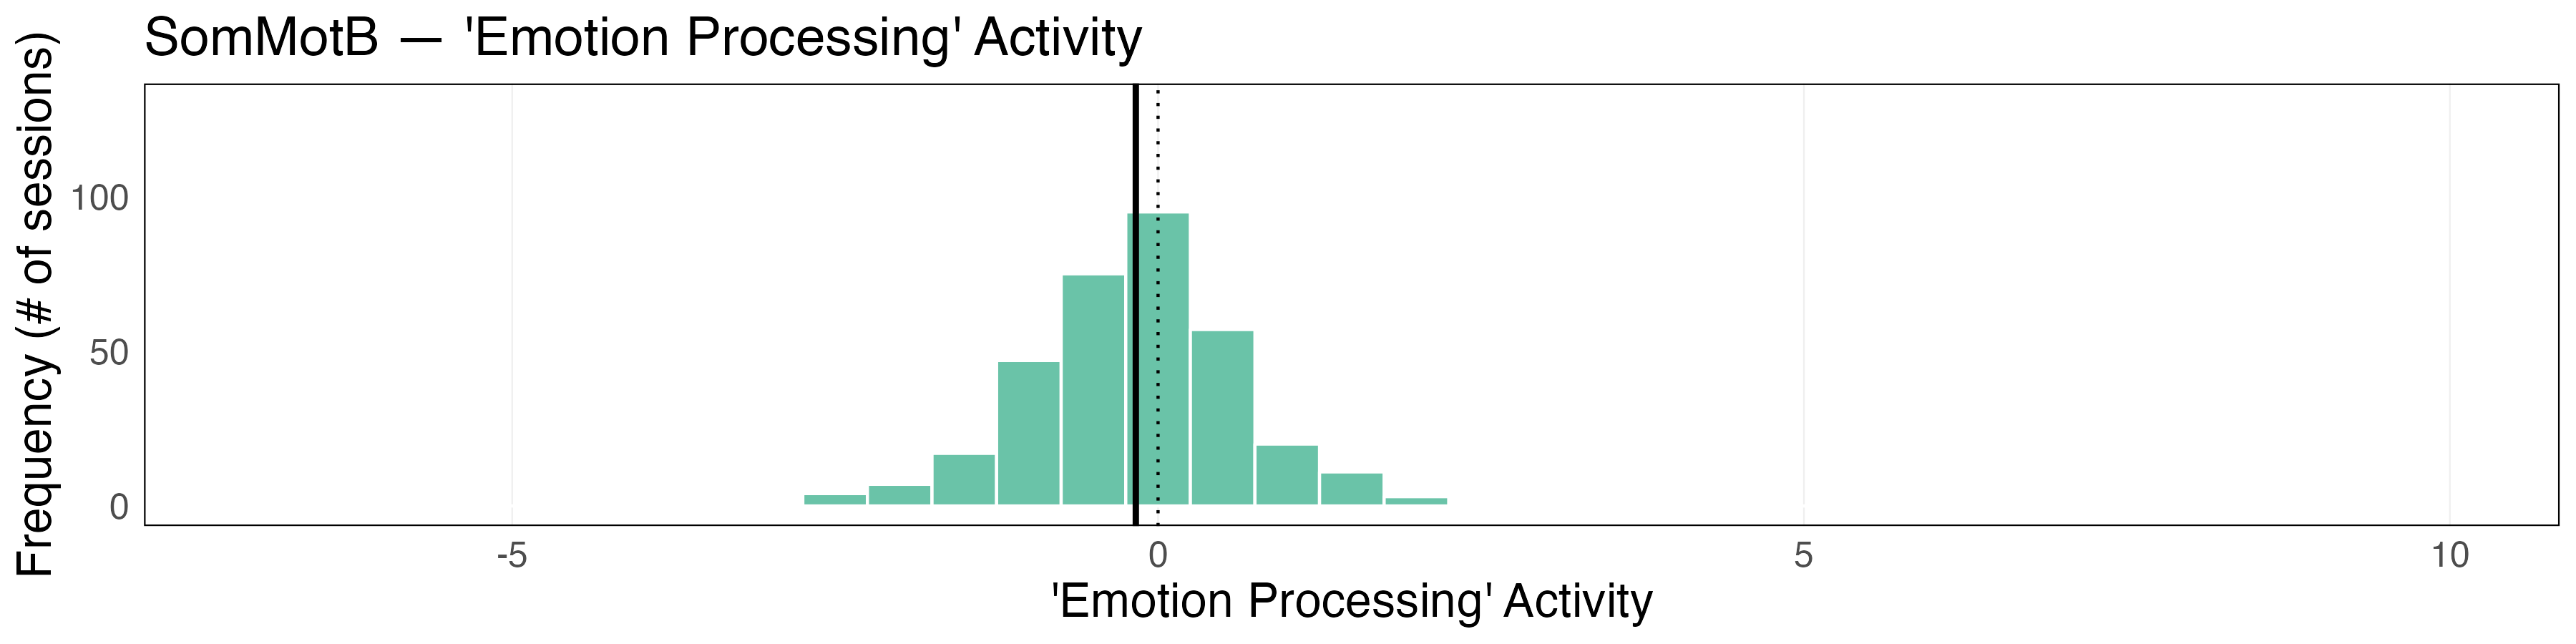
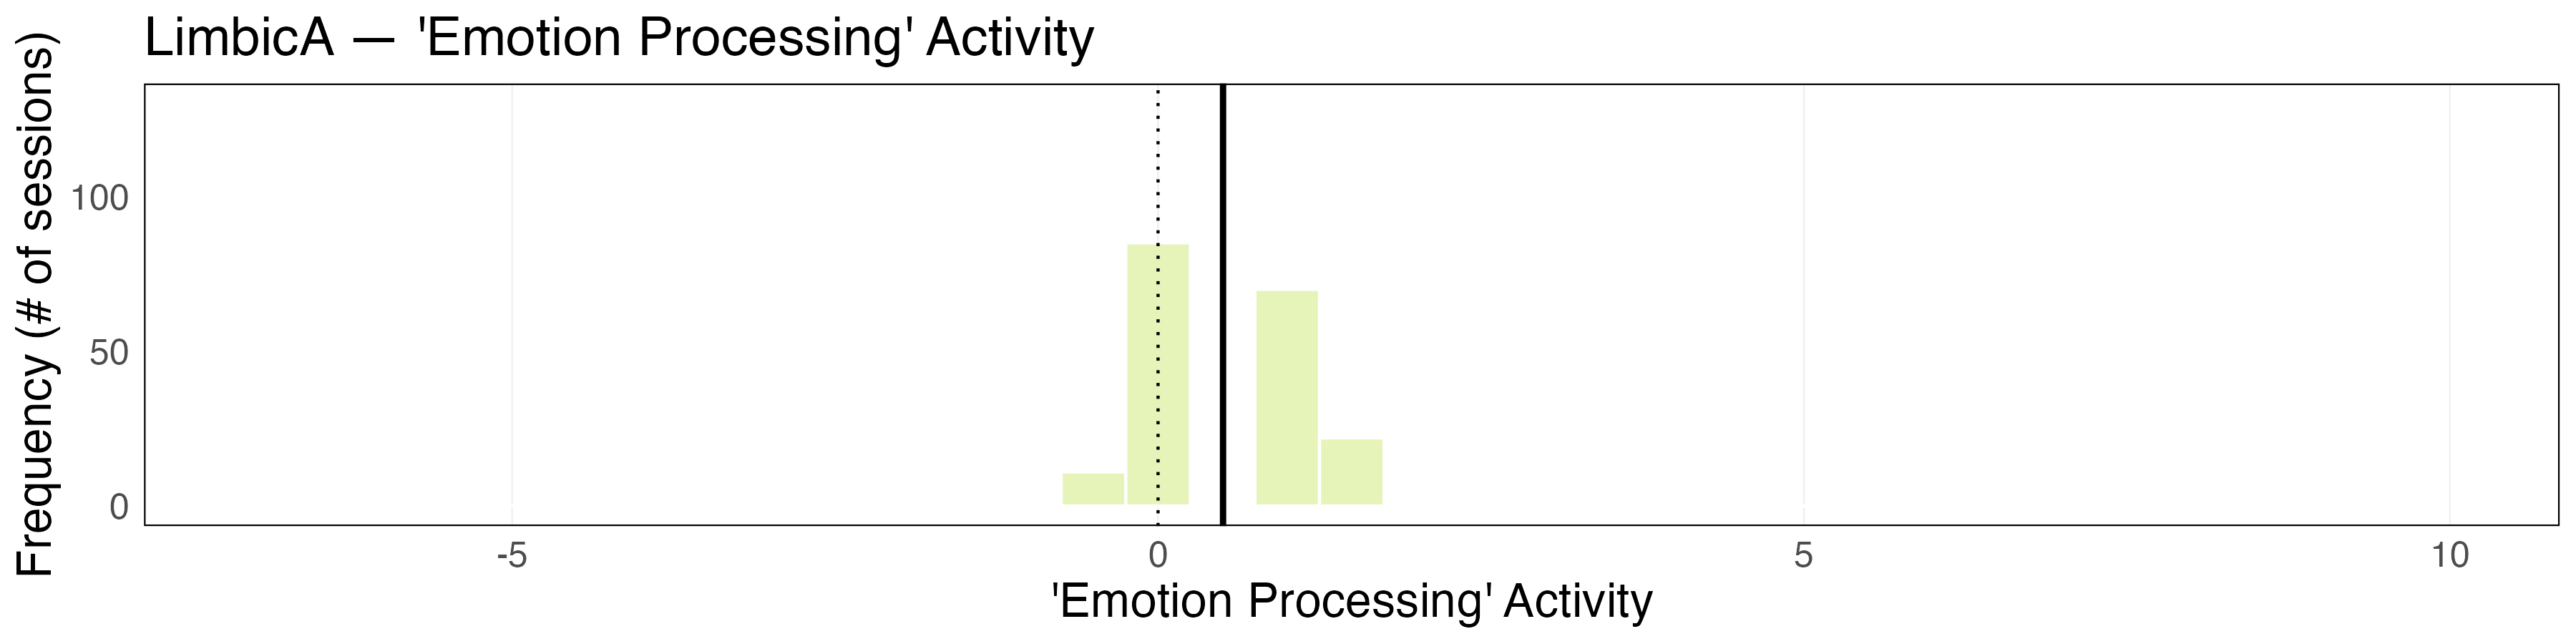
Group Networks — Task-evoked activity for Faces > Shapes exhibited poor test retest reliability in all of the networks identified in group averaged data with ICCs ranging from 0.03 (somatomotor B) to 0.39 (Limbic A).
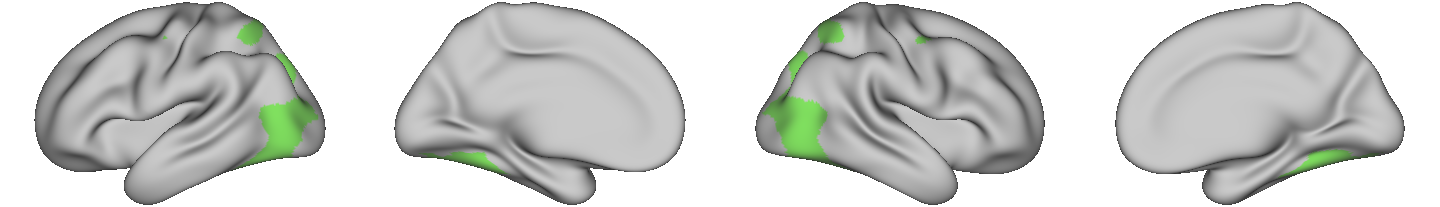
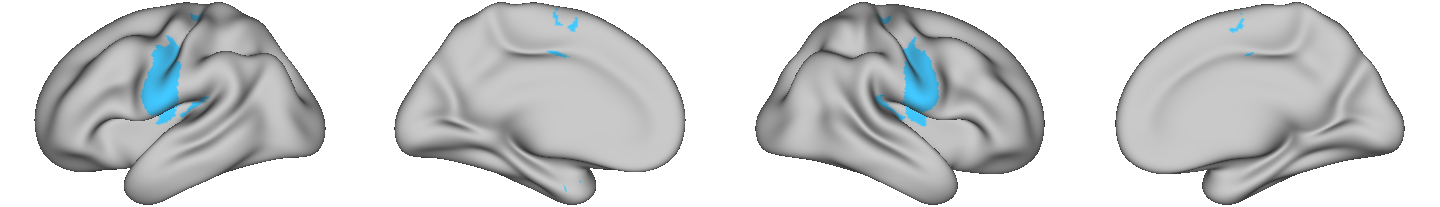
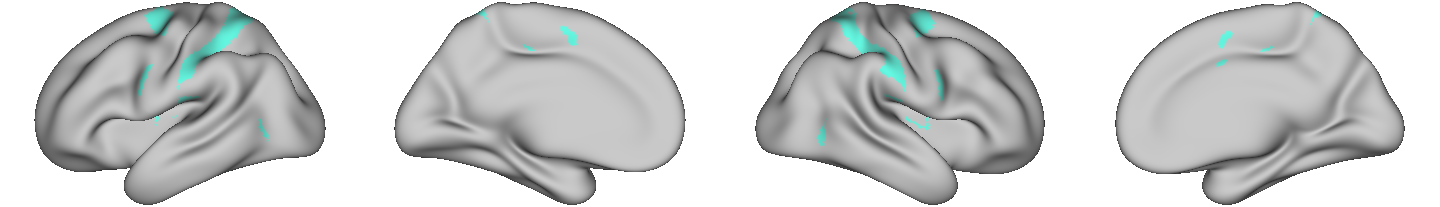
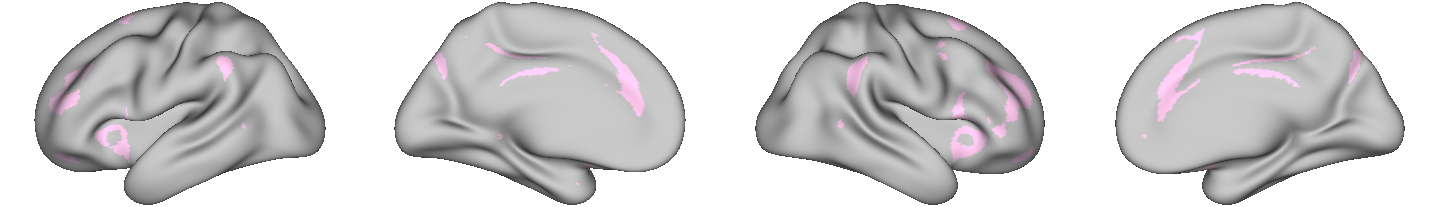
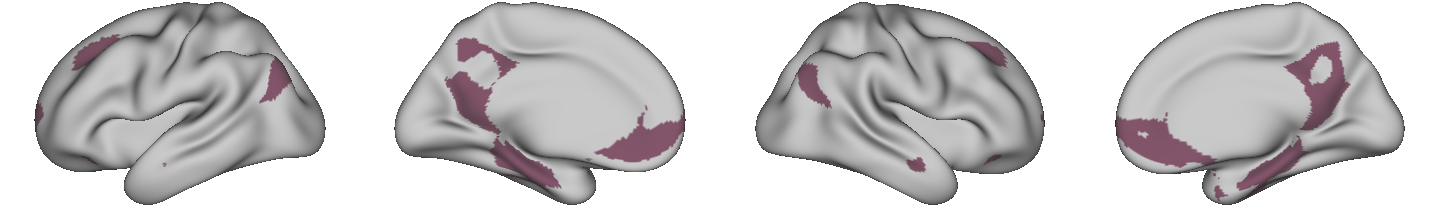
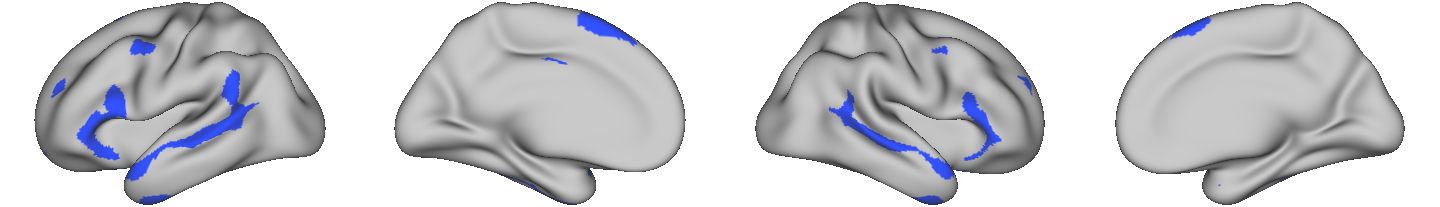
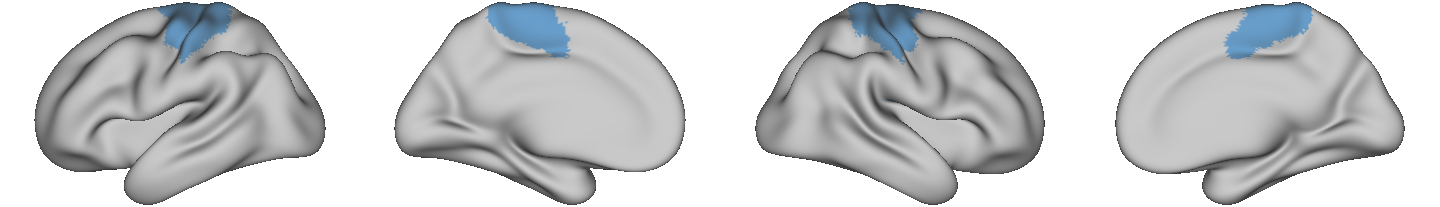
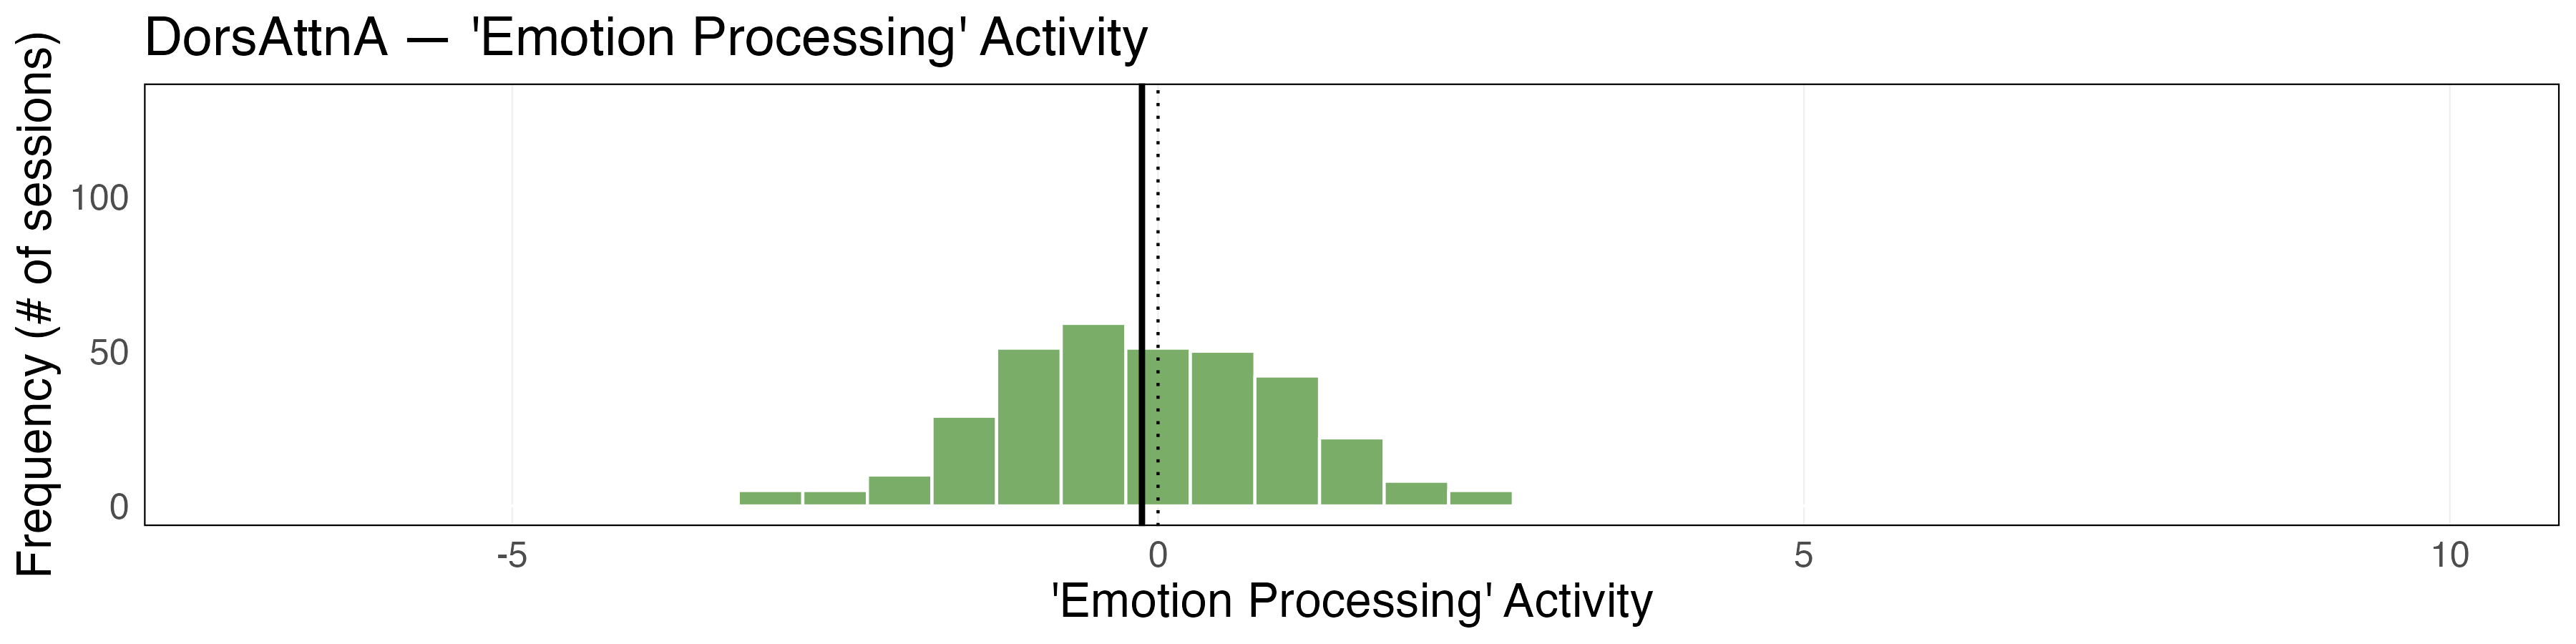
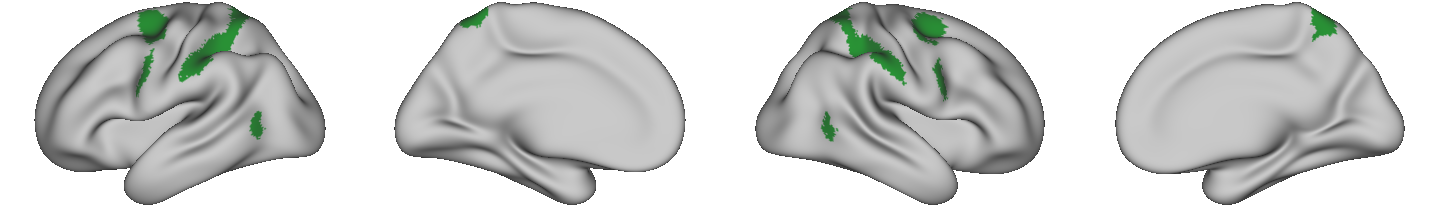
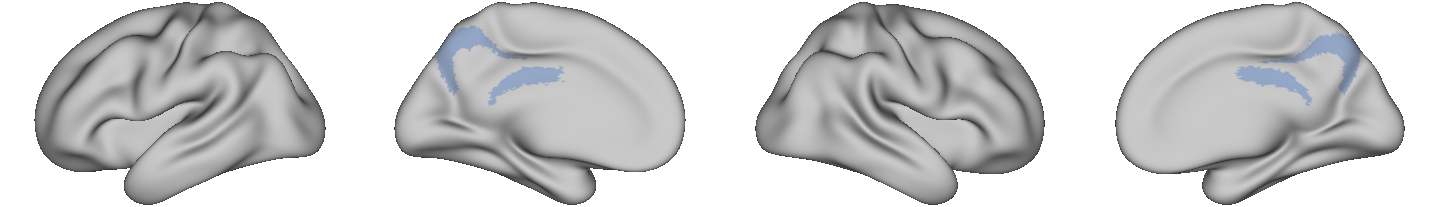
Individualized Networks — Task-evoked activity for Faces > Shapes within the individualized networks exhibited poor test-retest reliability with ICCs ranging from 0.02 (somatomotor B) to 0.39 (visual-central network). Though the visual-central network exhibited significant emotion processing activity, the ICC for activation in this network was poor (0.38). Activity within the dorsal attention network B (dATN-B) showed even poorer between-person test-retest reliability with an ICC of 0.26.
In sum, the only boundaries that exhibited good test-retest reliability for activity during the Faces > Shapes contrast were the right and left fusiform. The amygdala, the group averaged networks and the individualized networks all exhibited activity with poor test-retest reliability.
Variability Plots (ICCs Visualized)
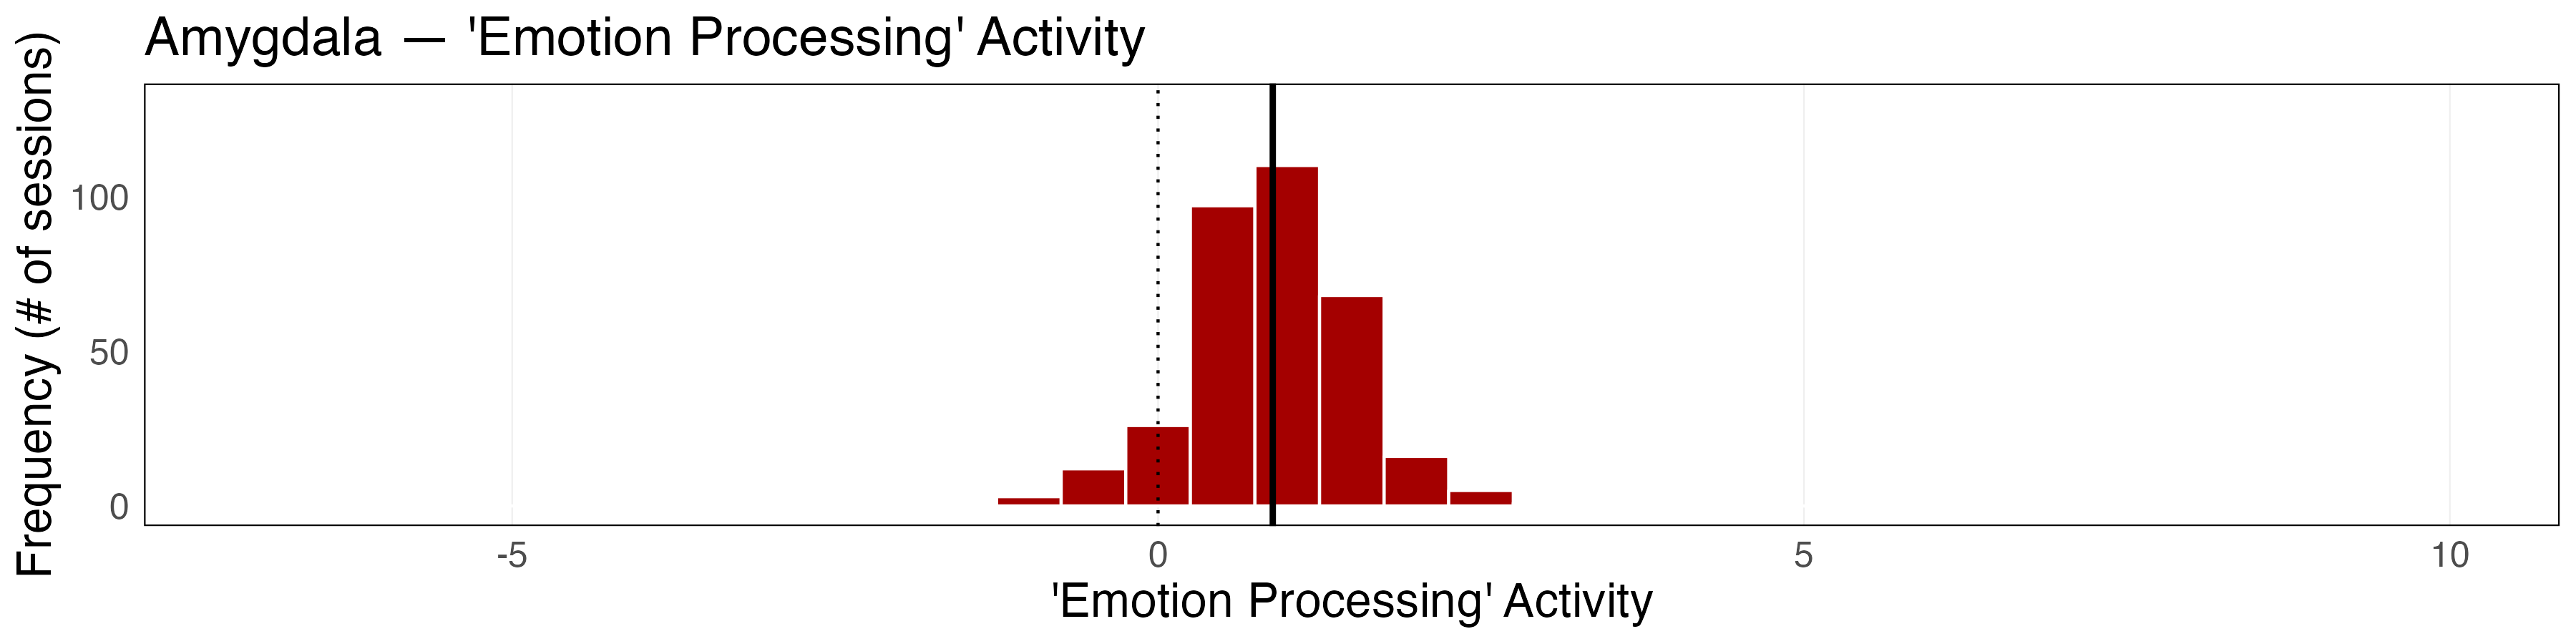
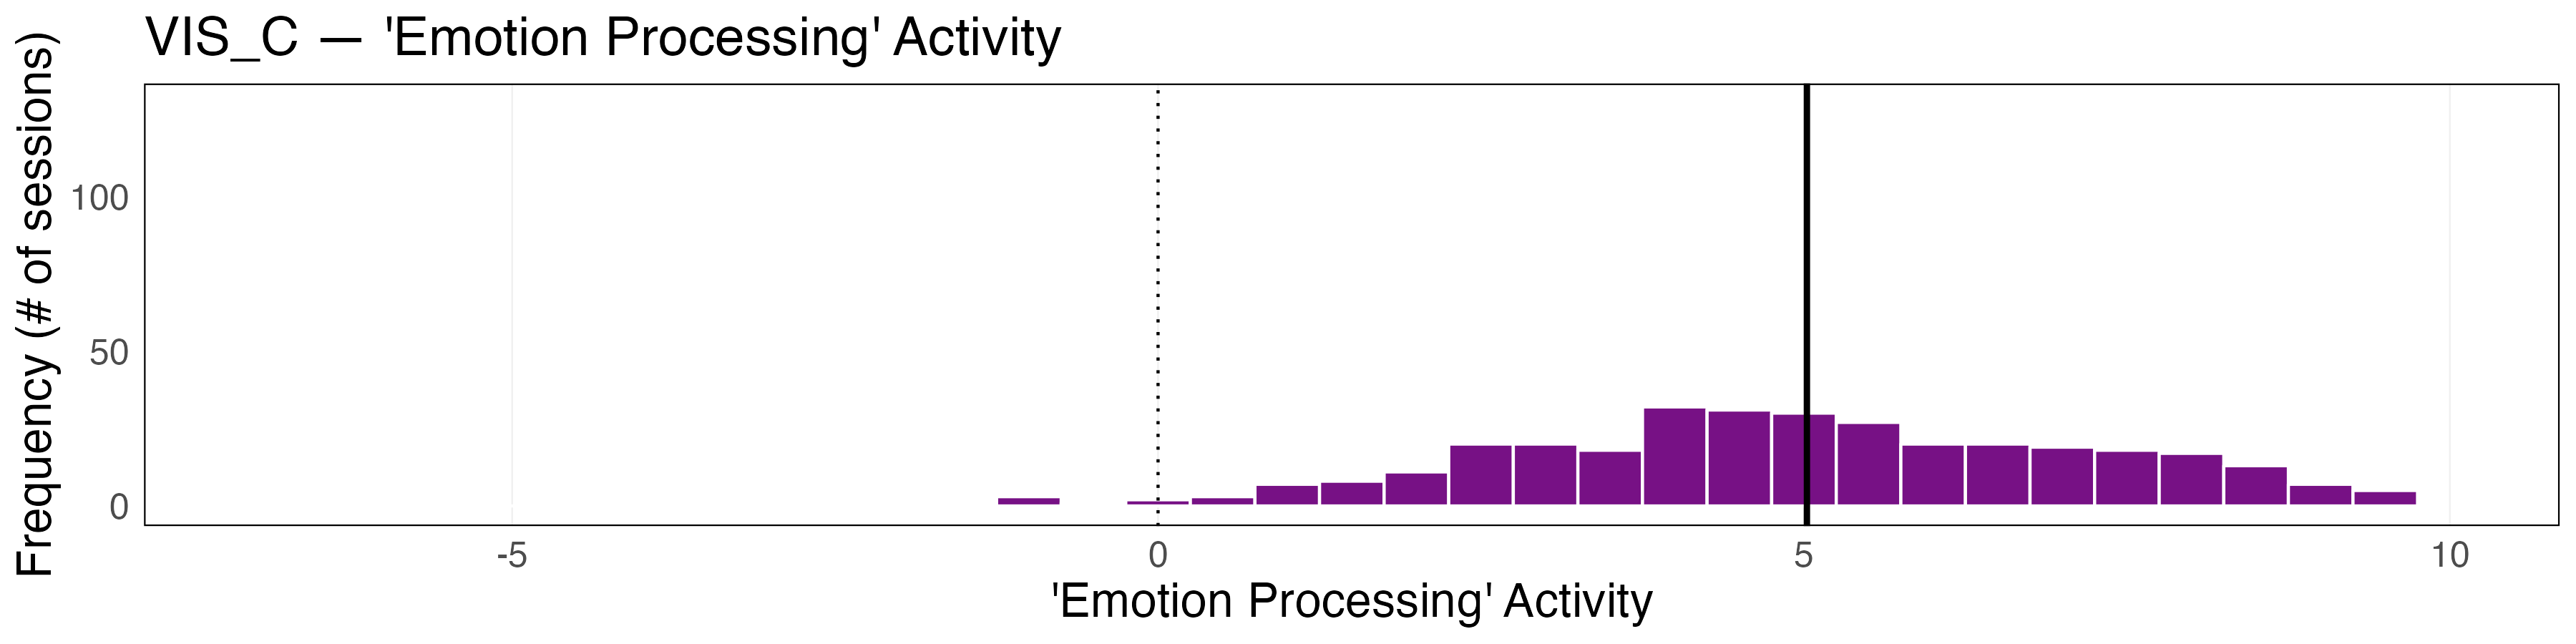
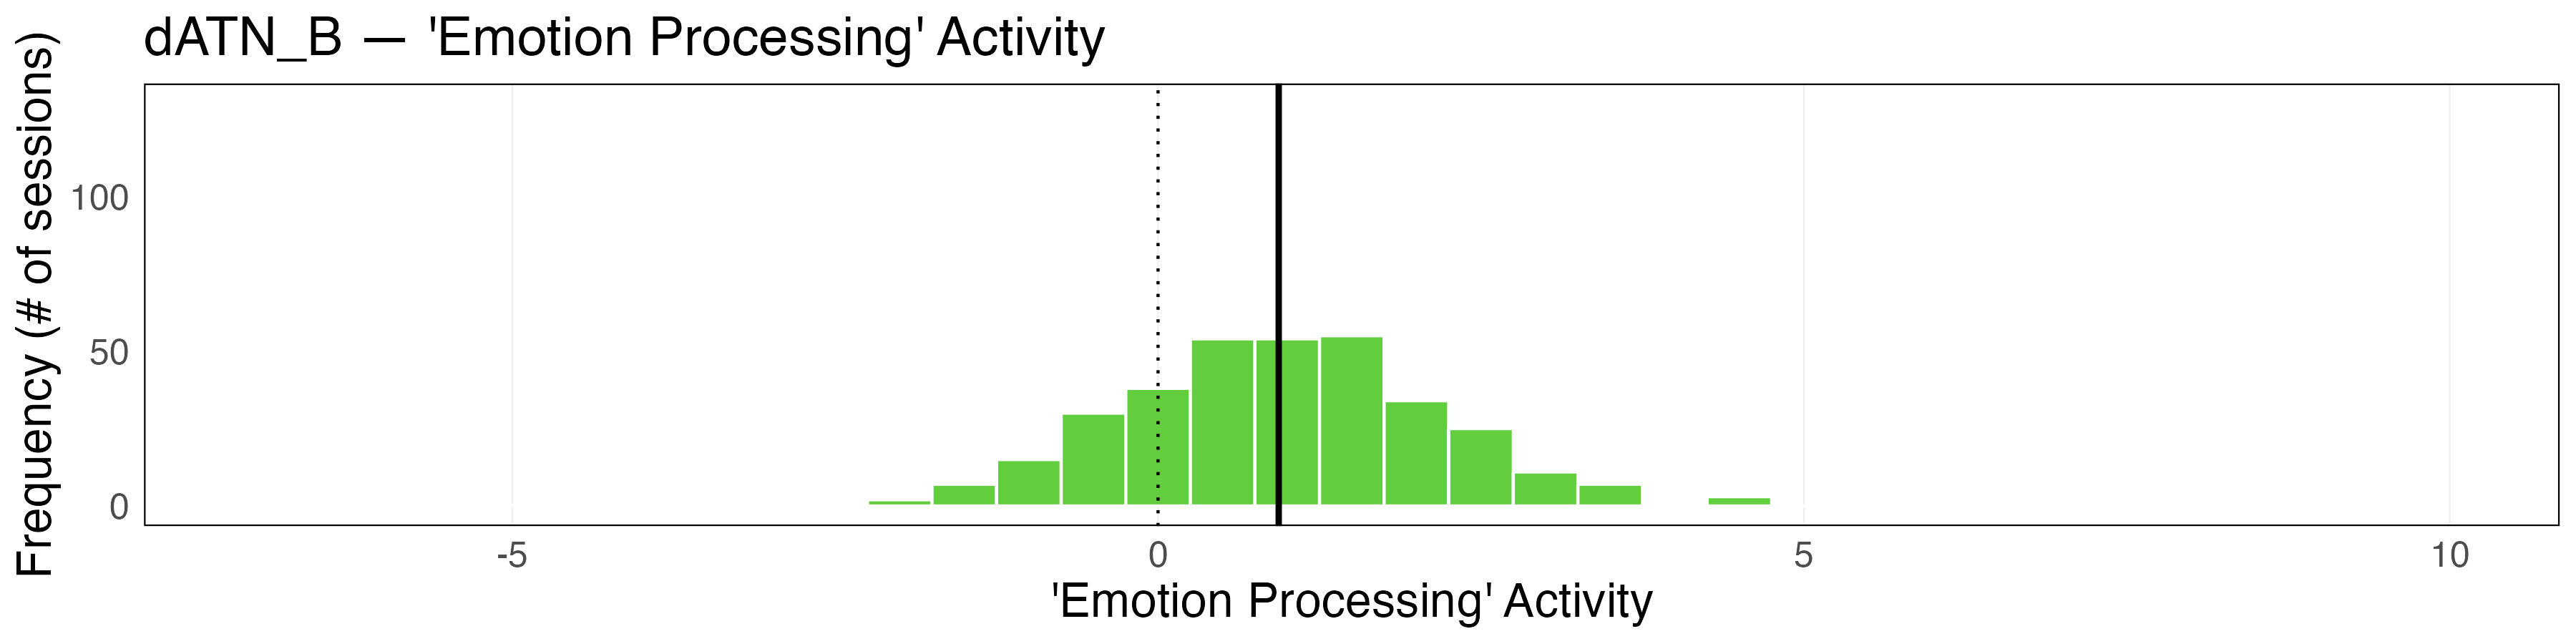
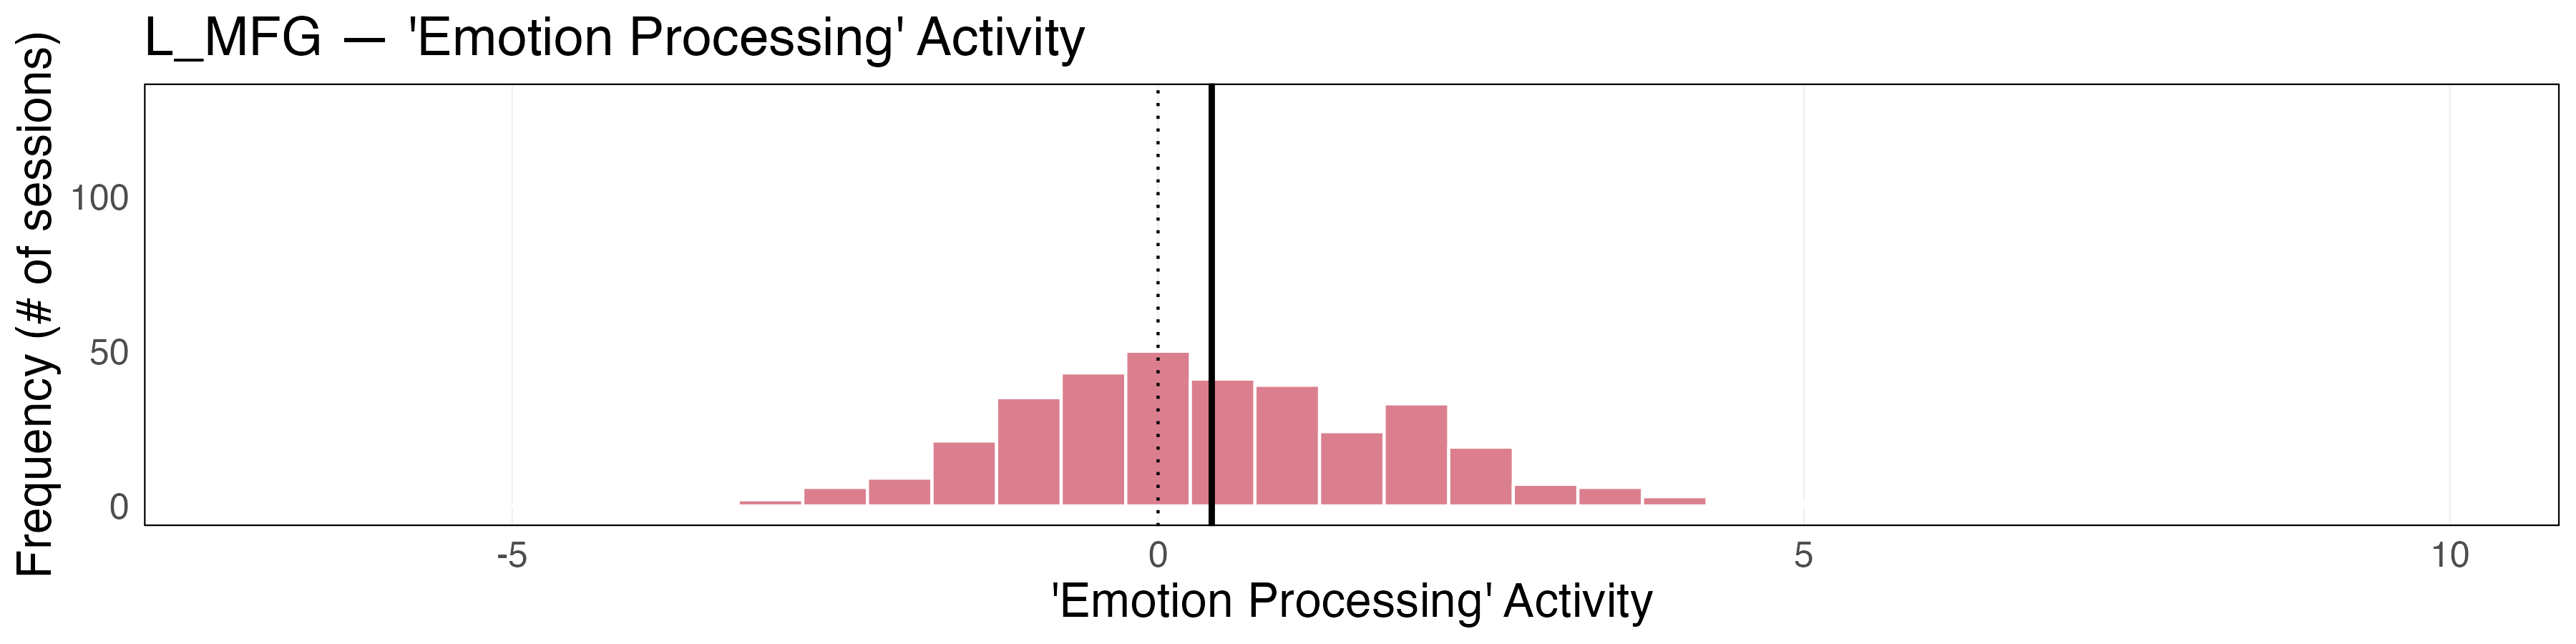
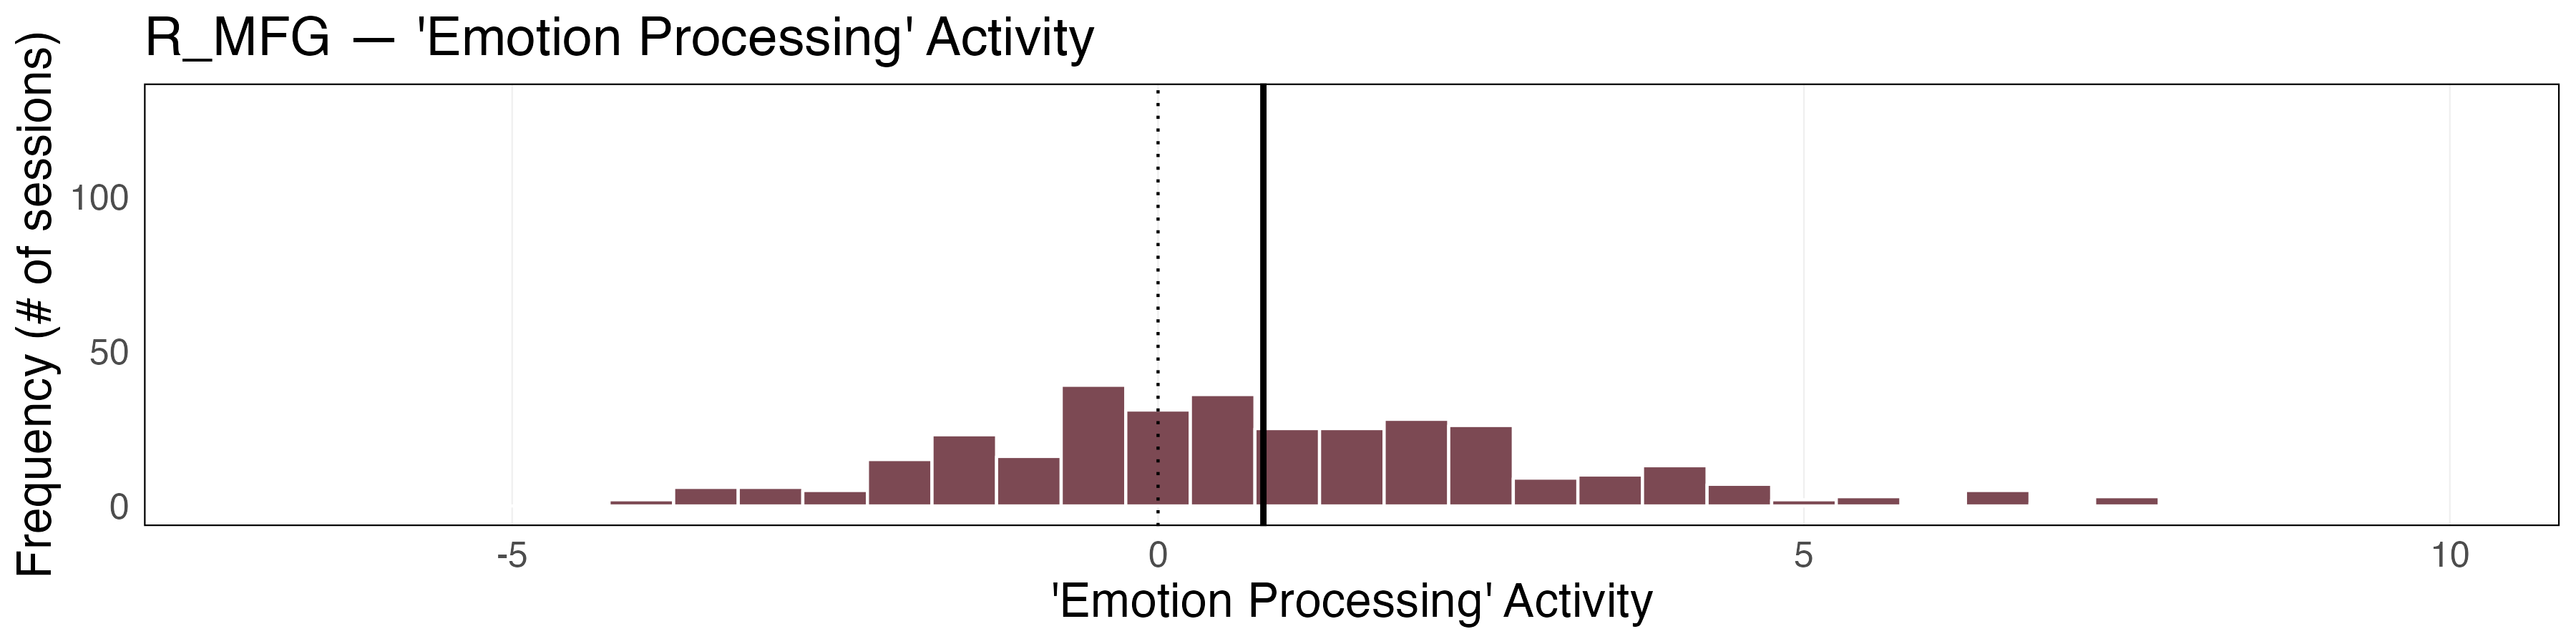
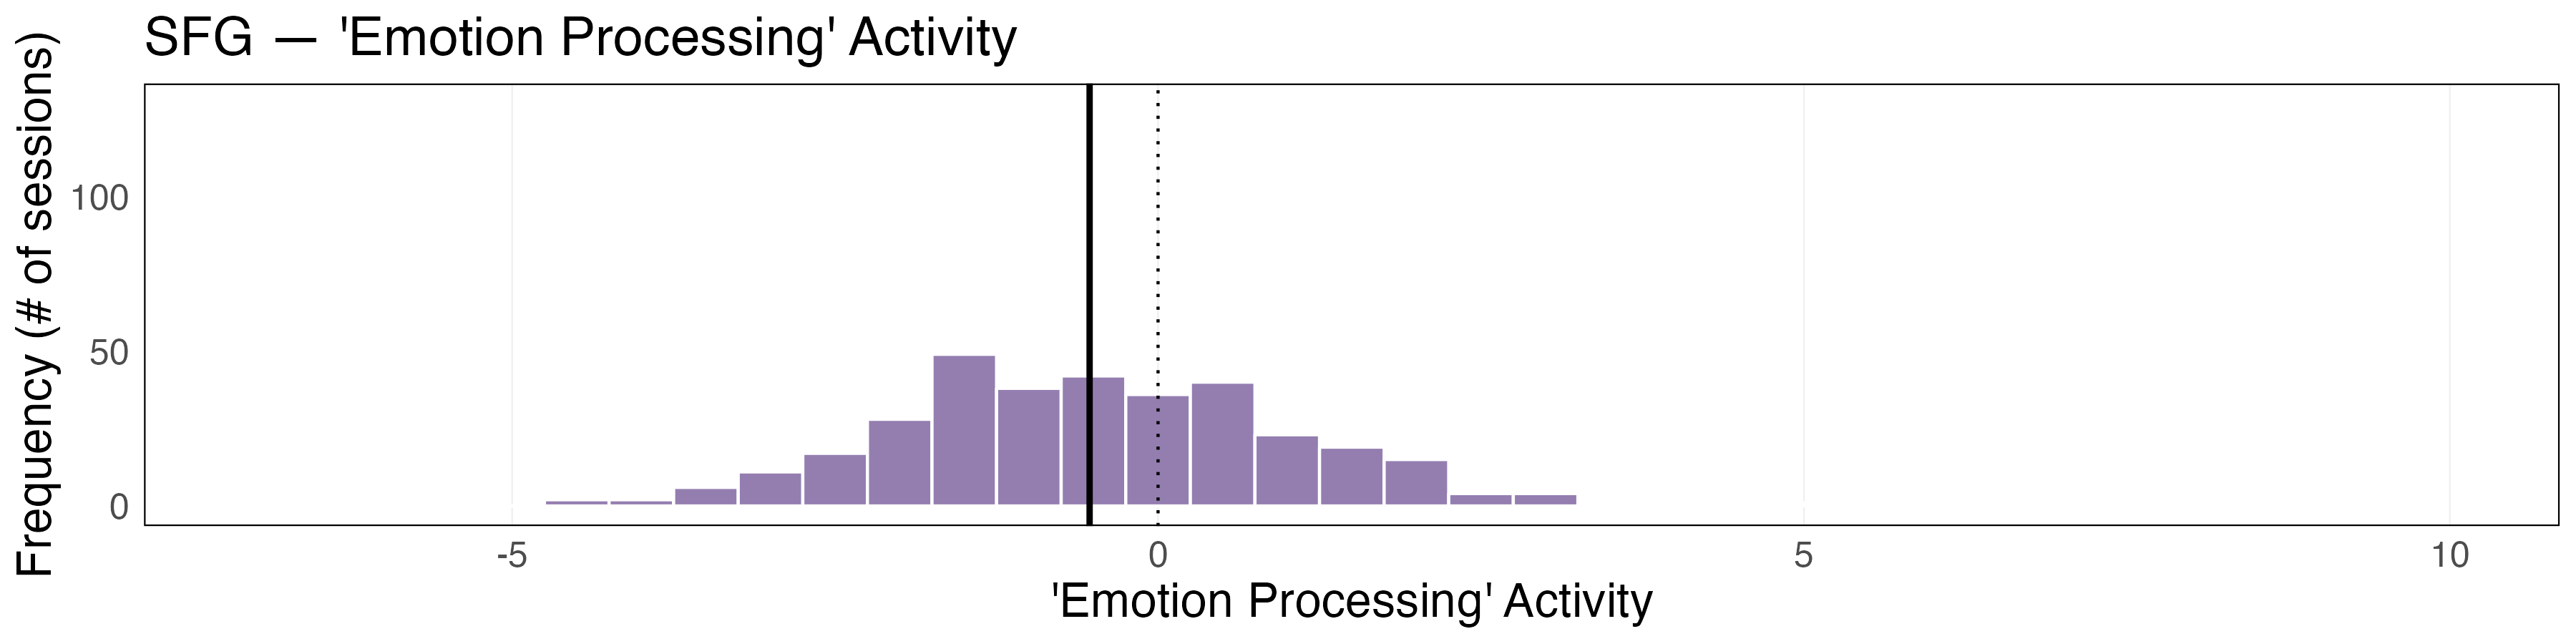
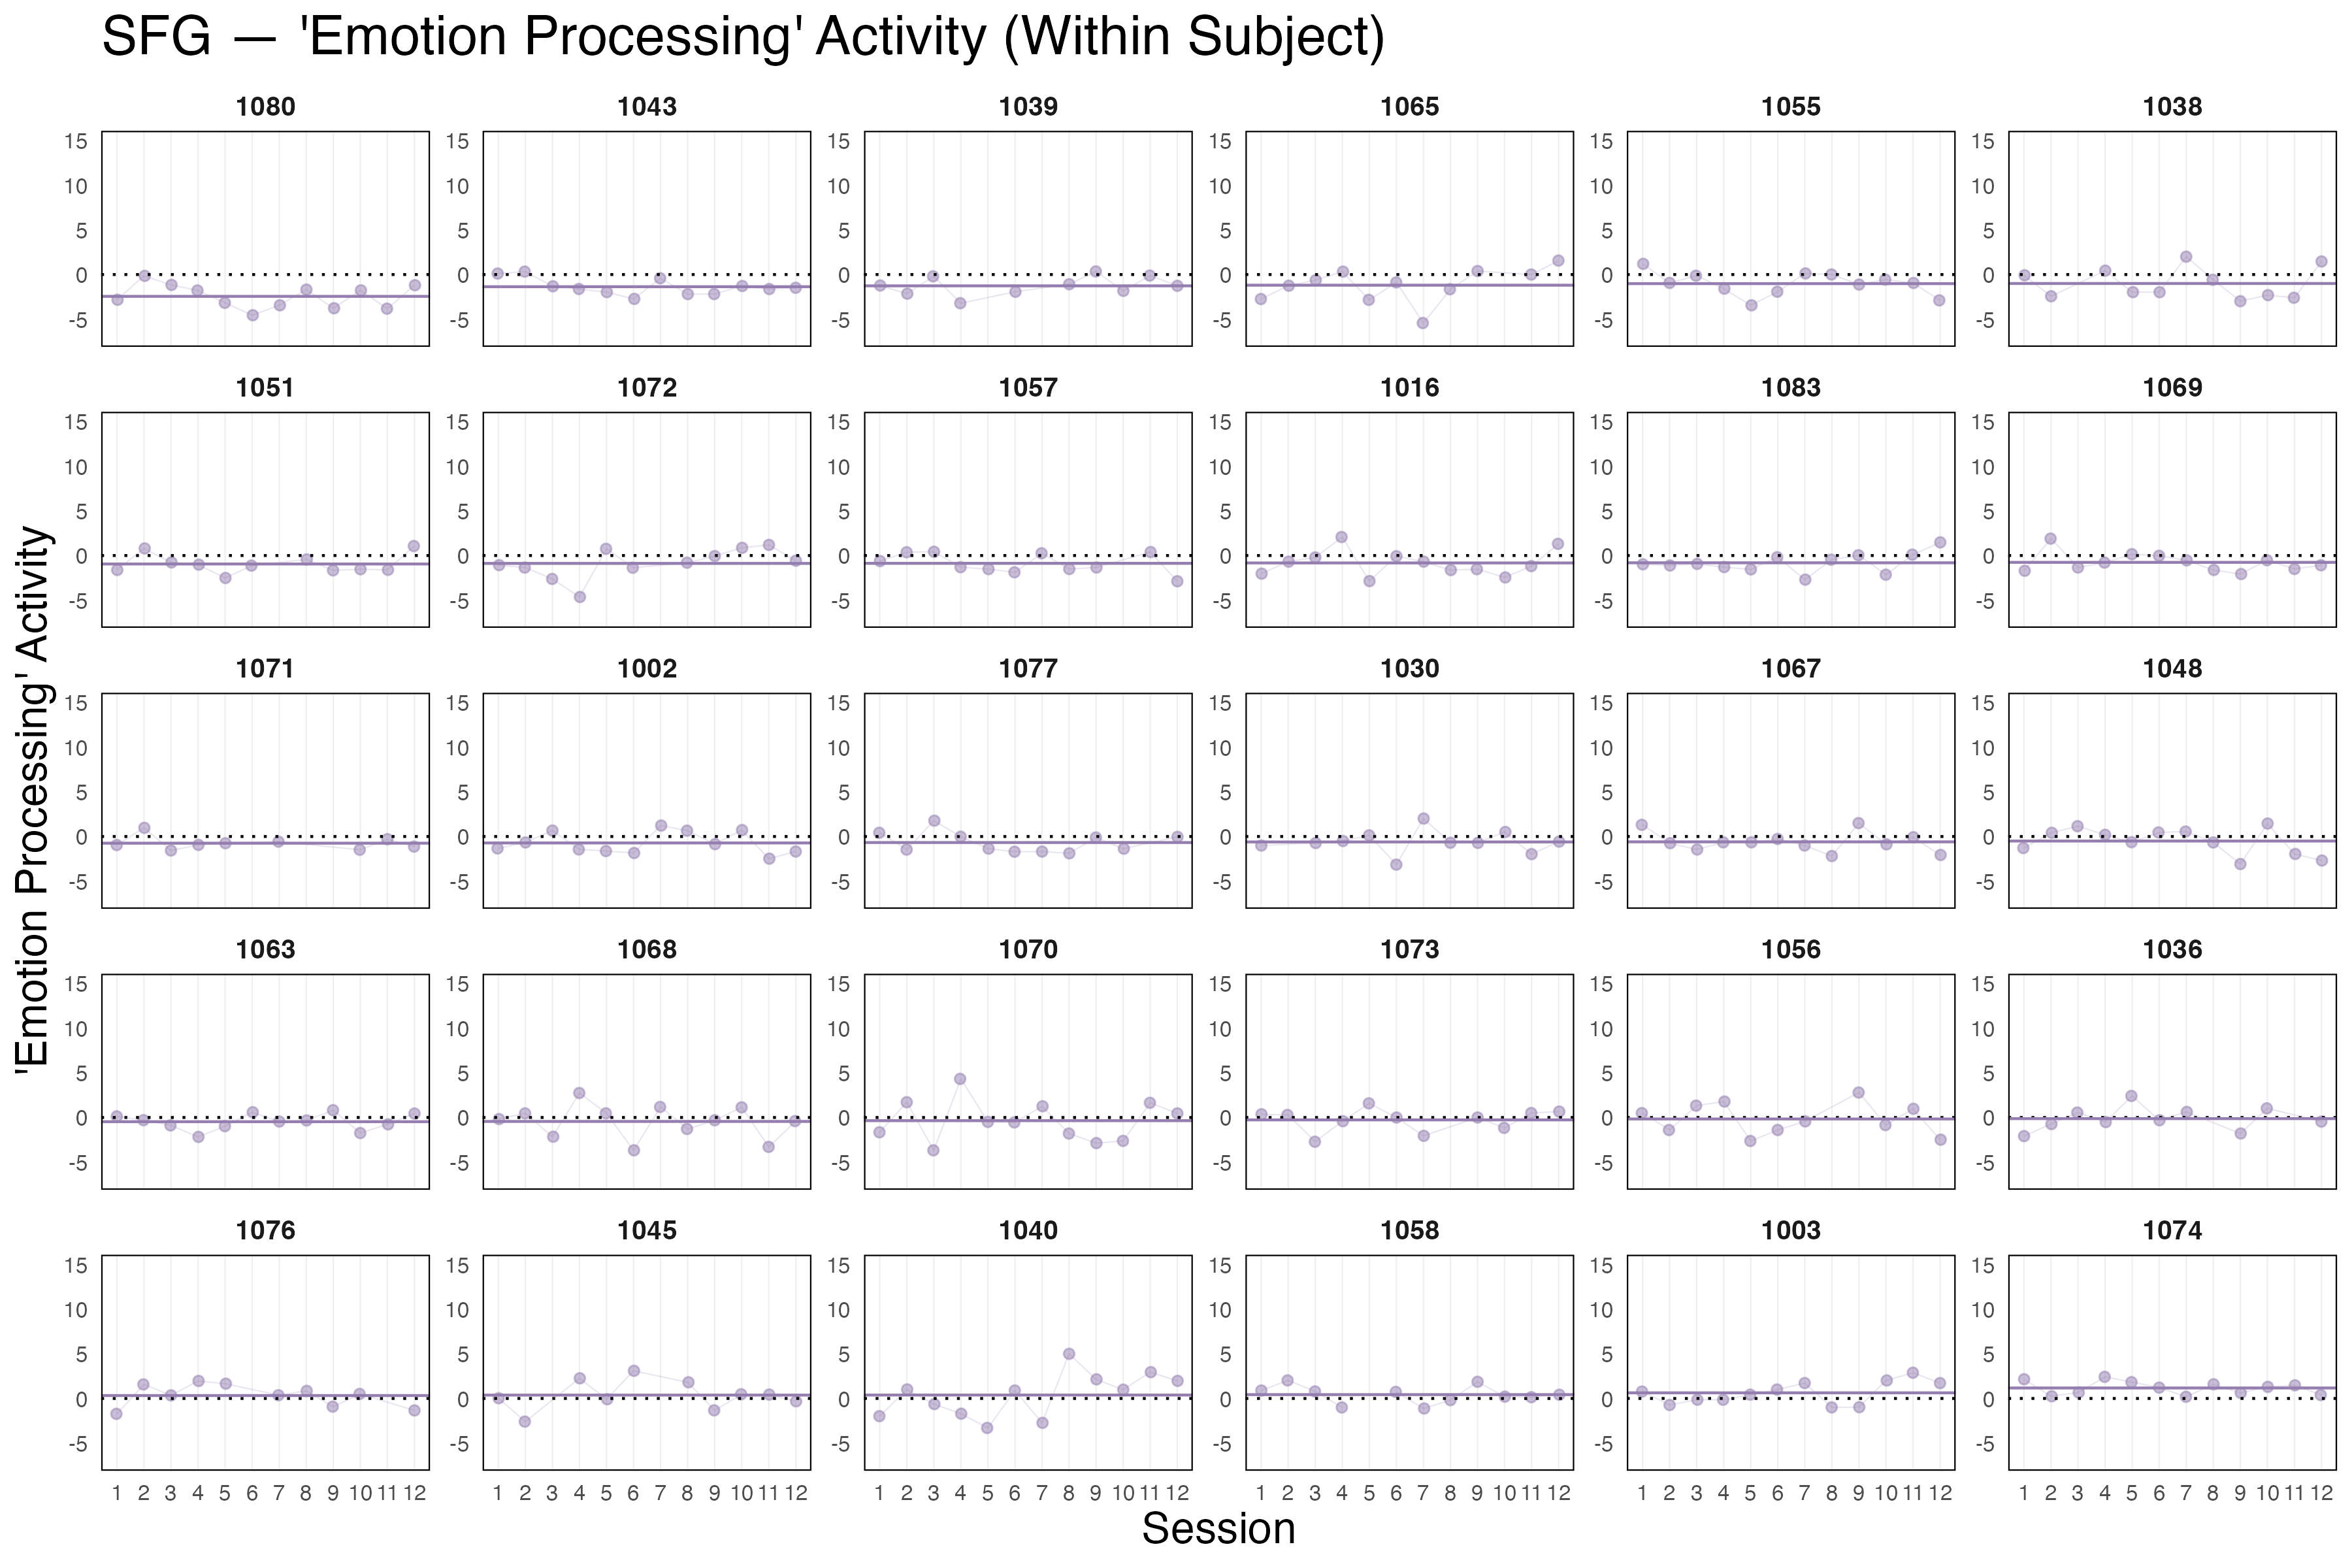
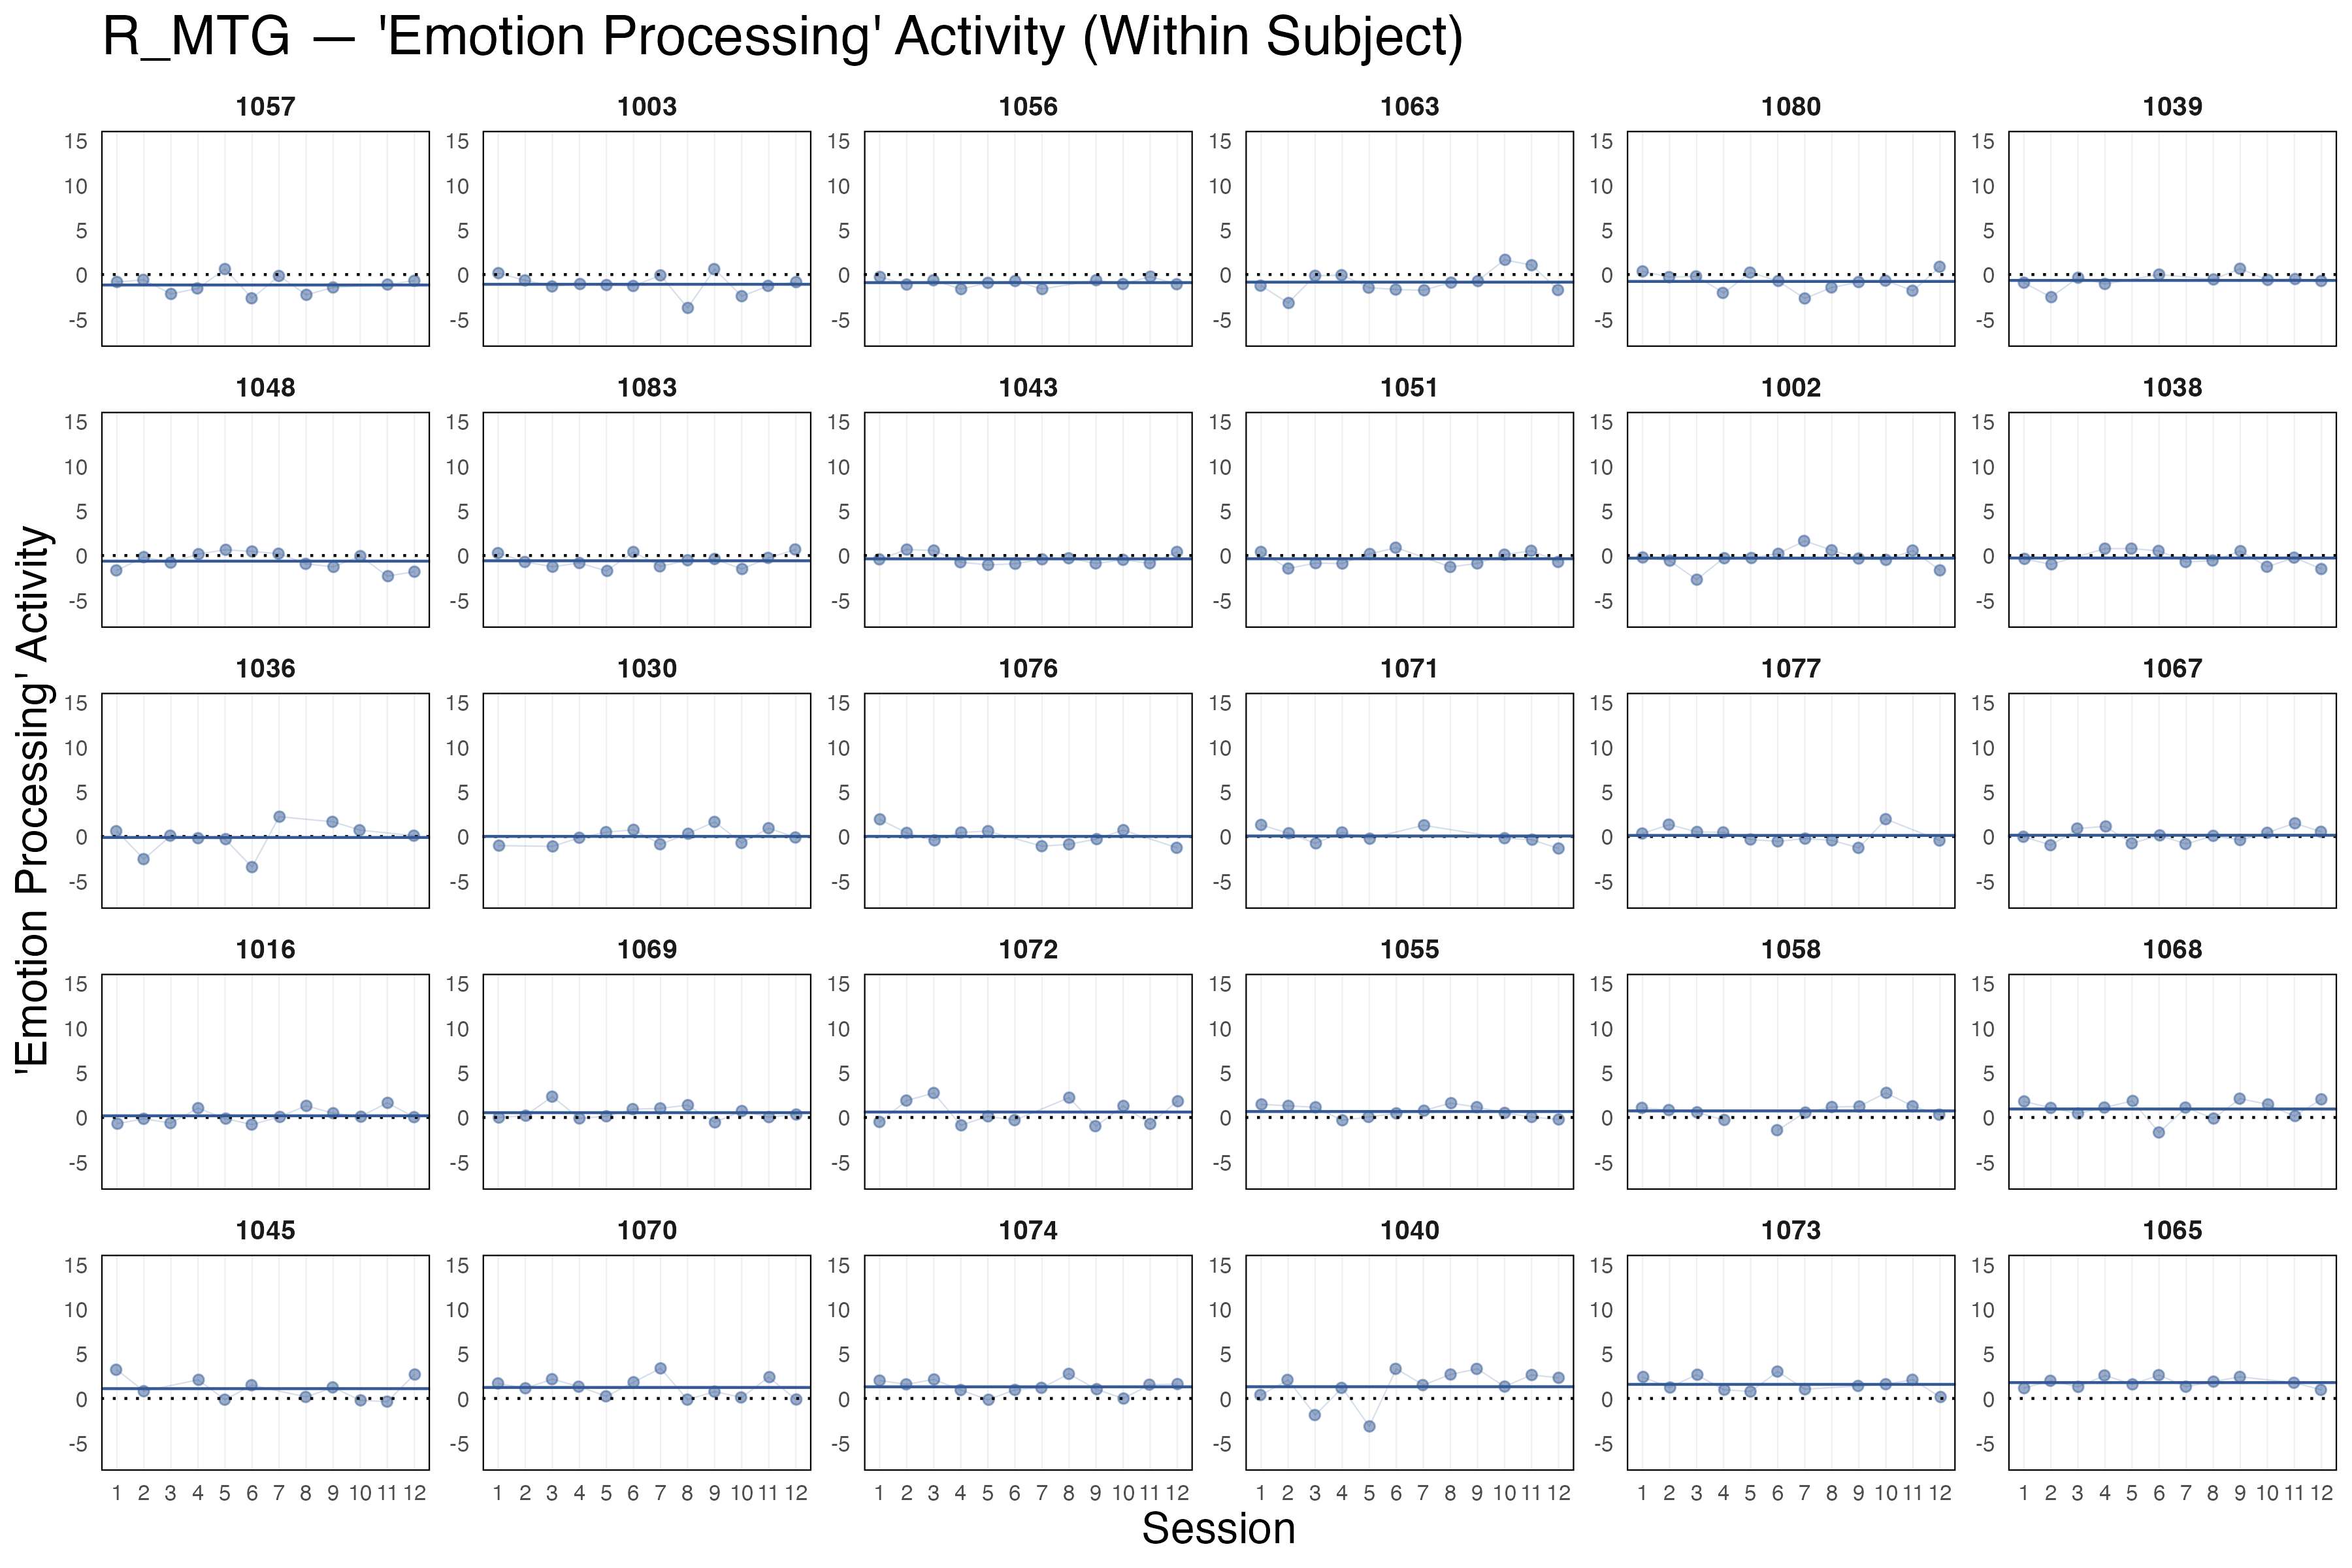
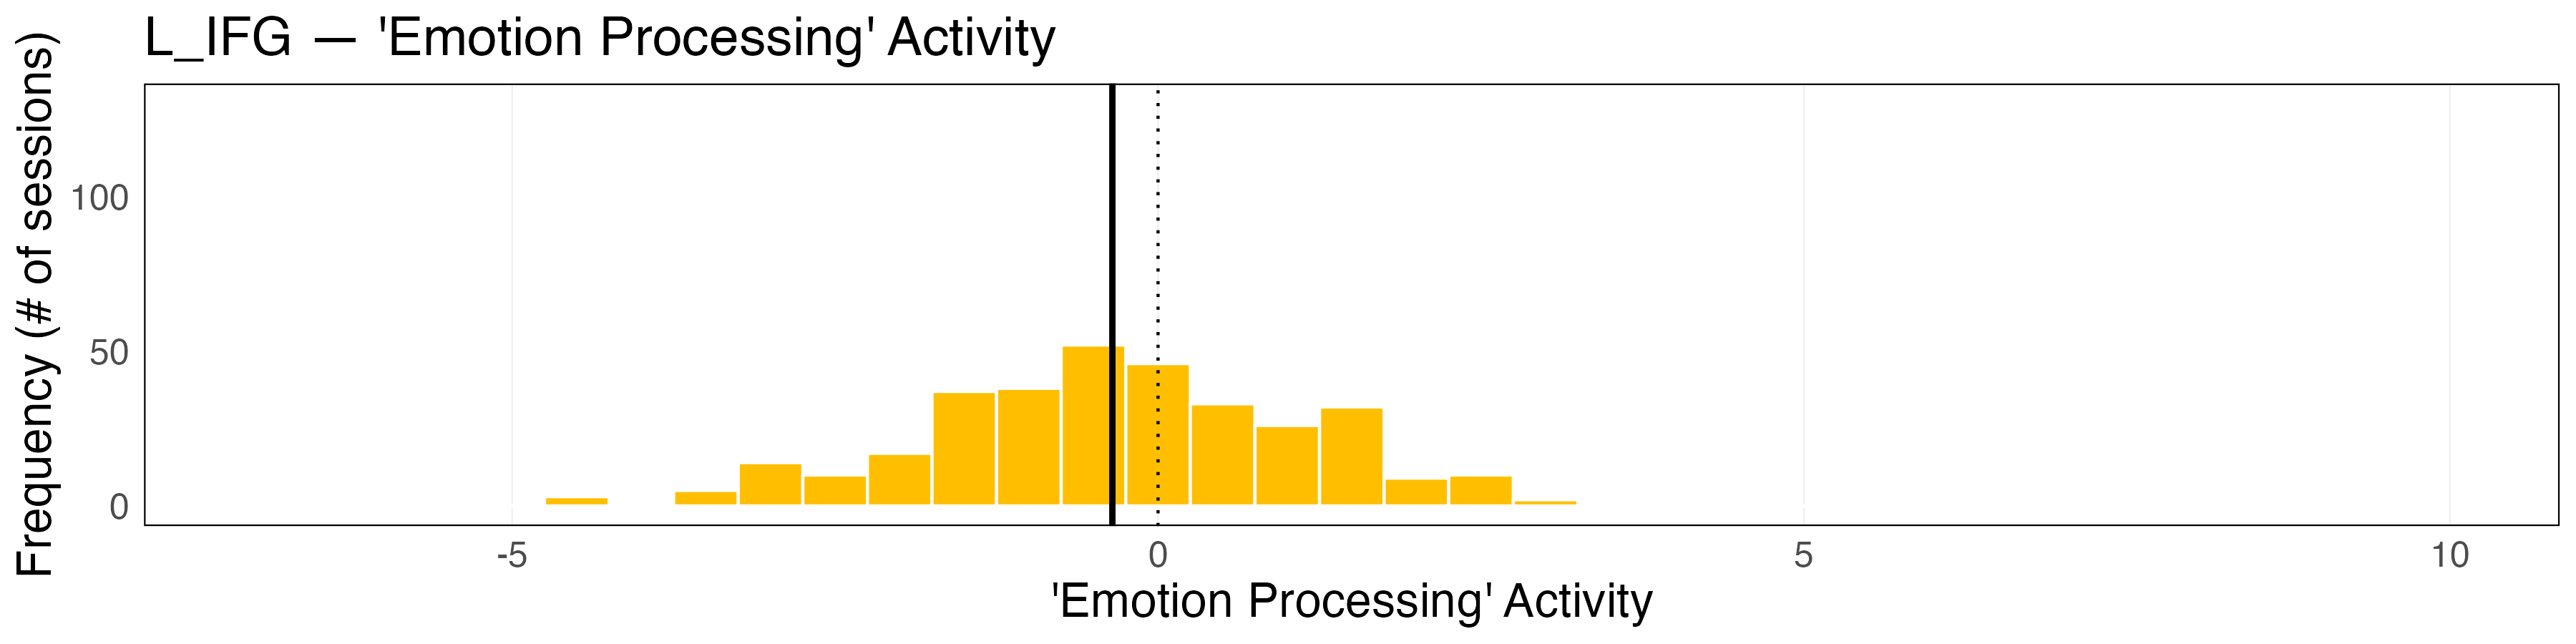
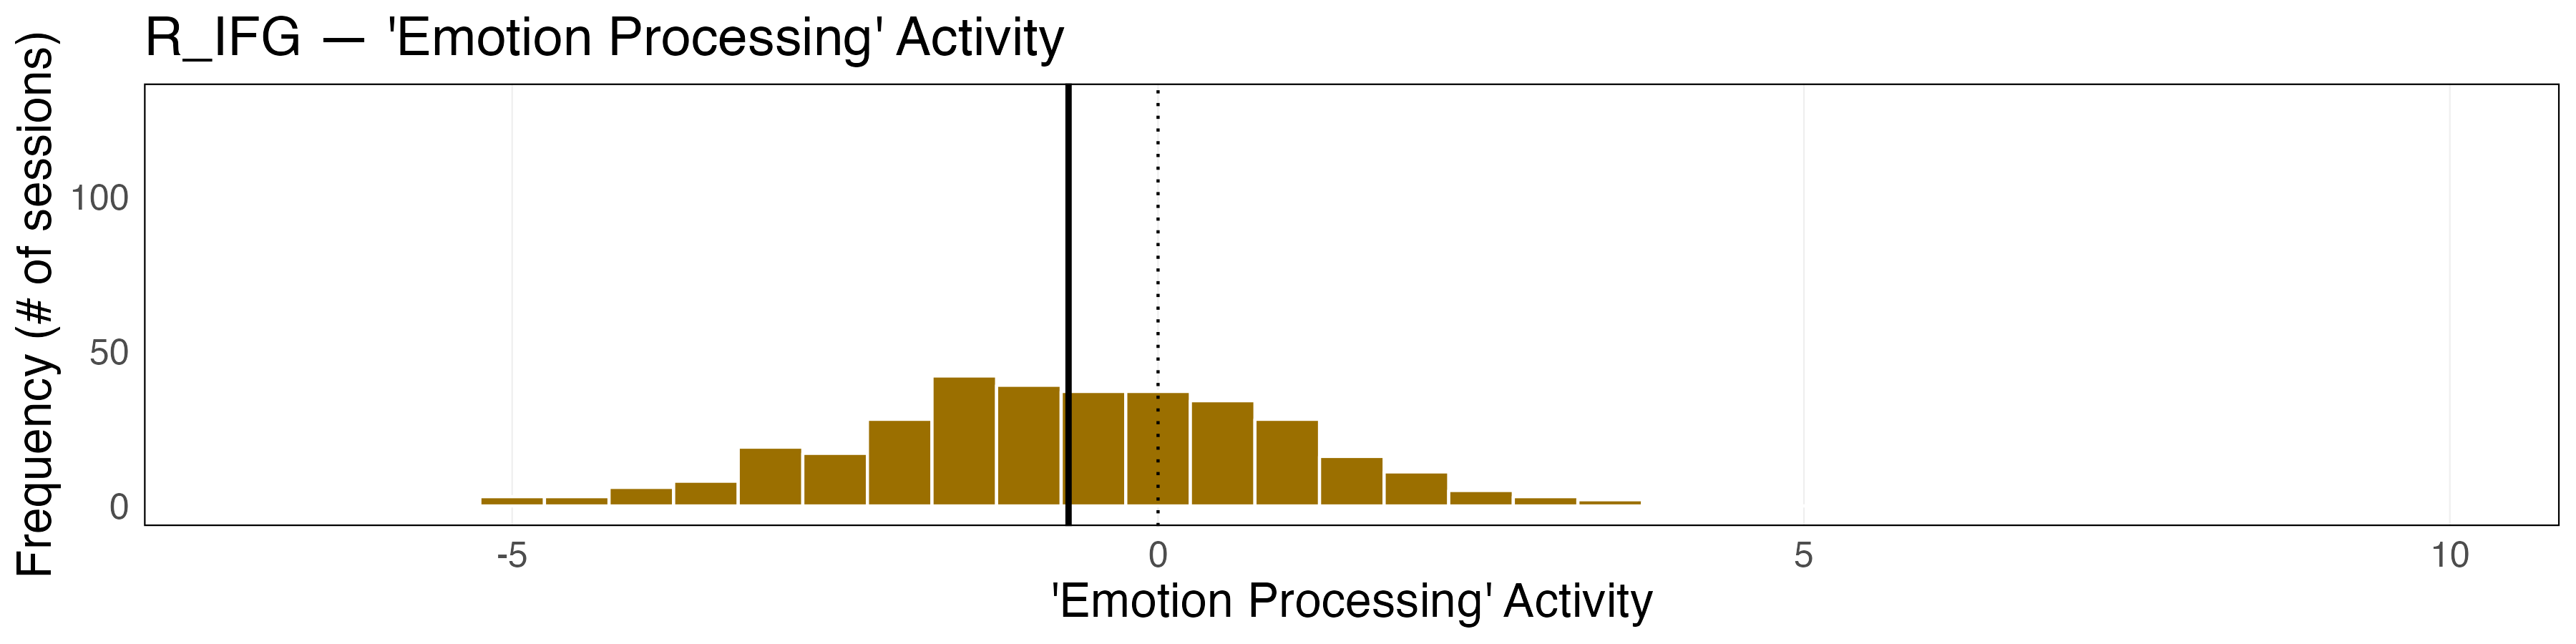
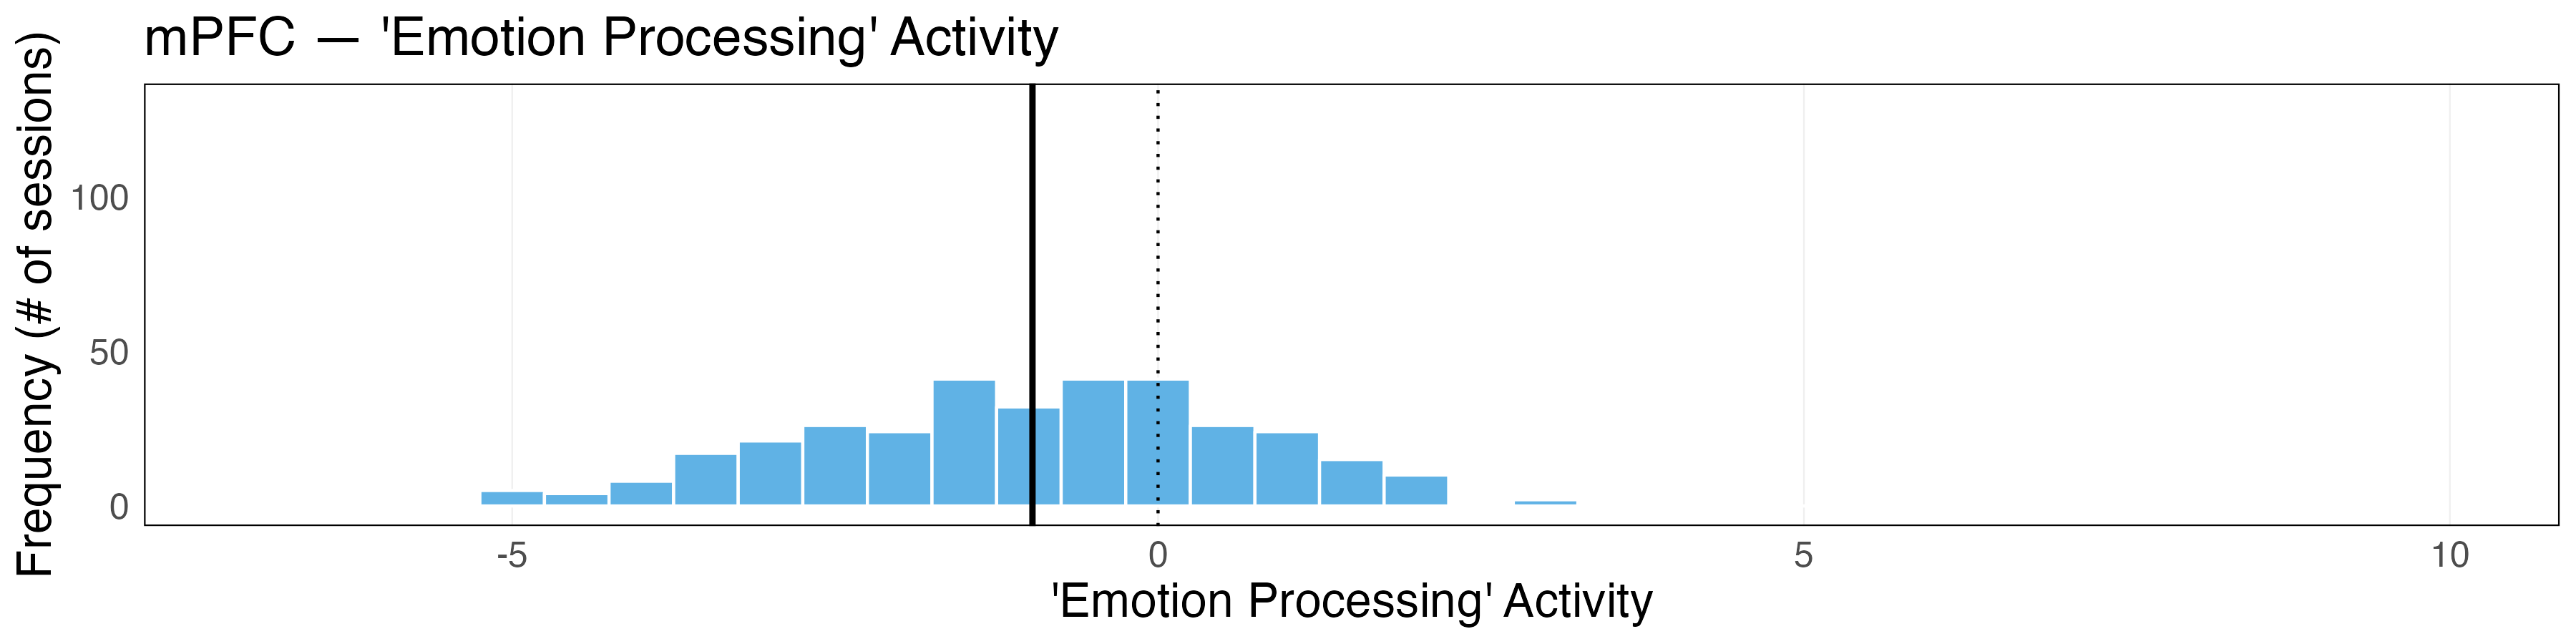
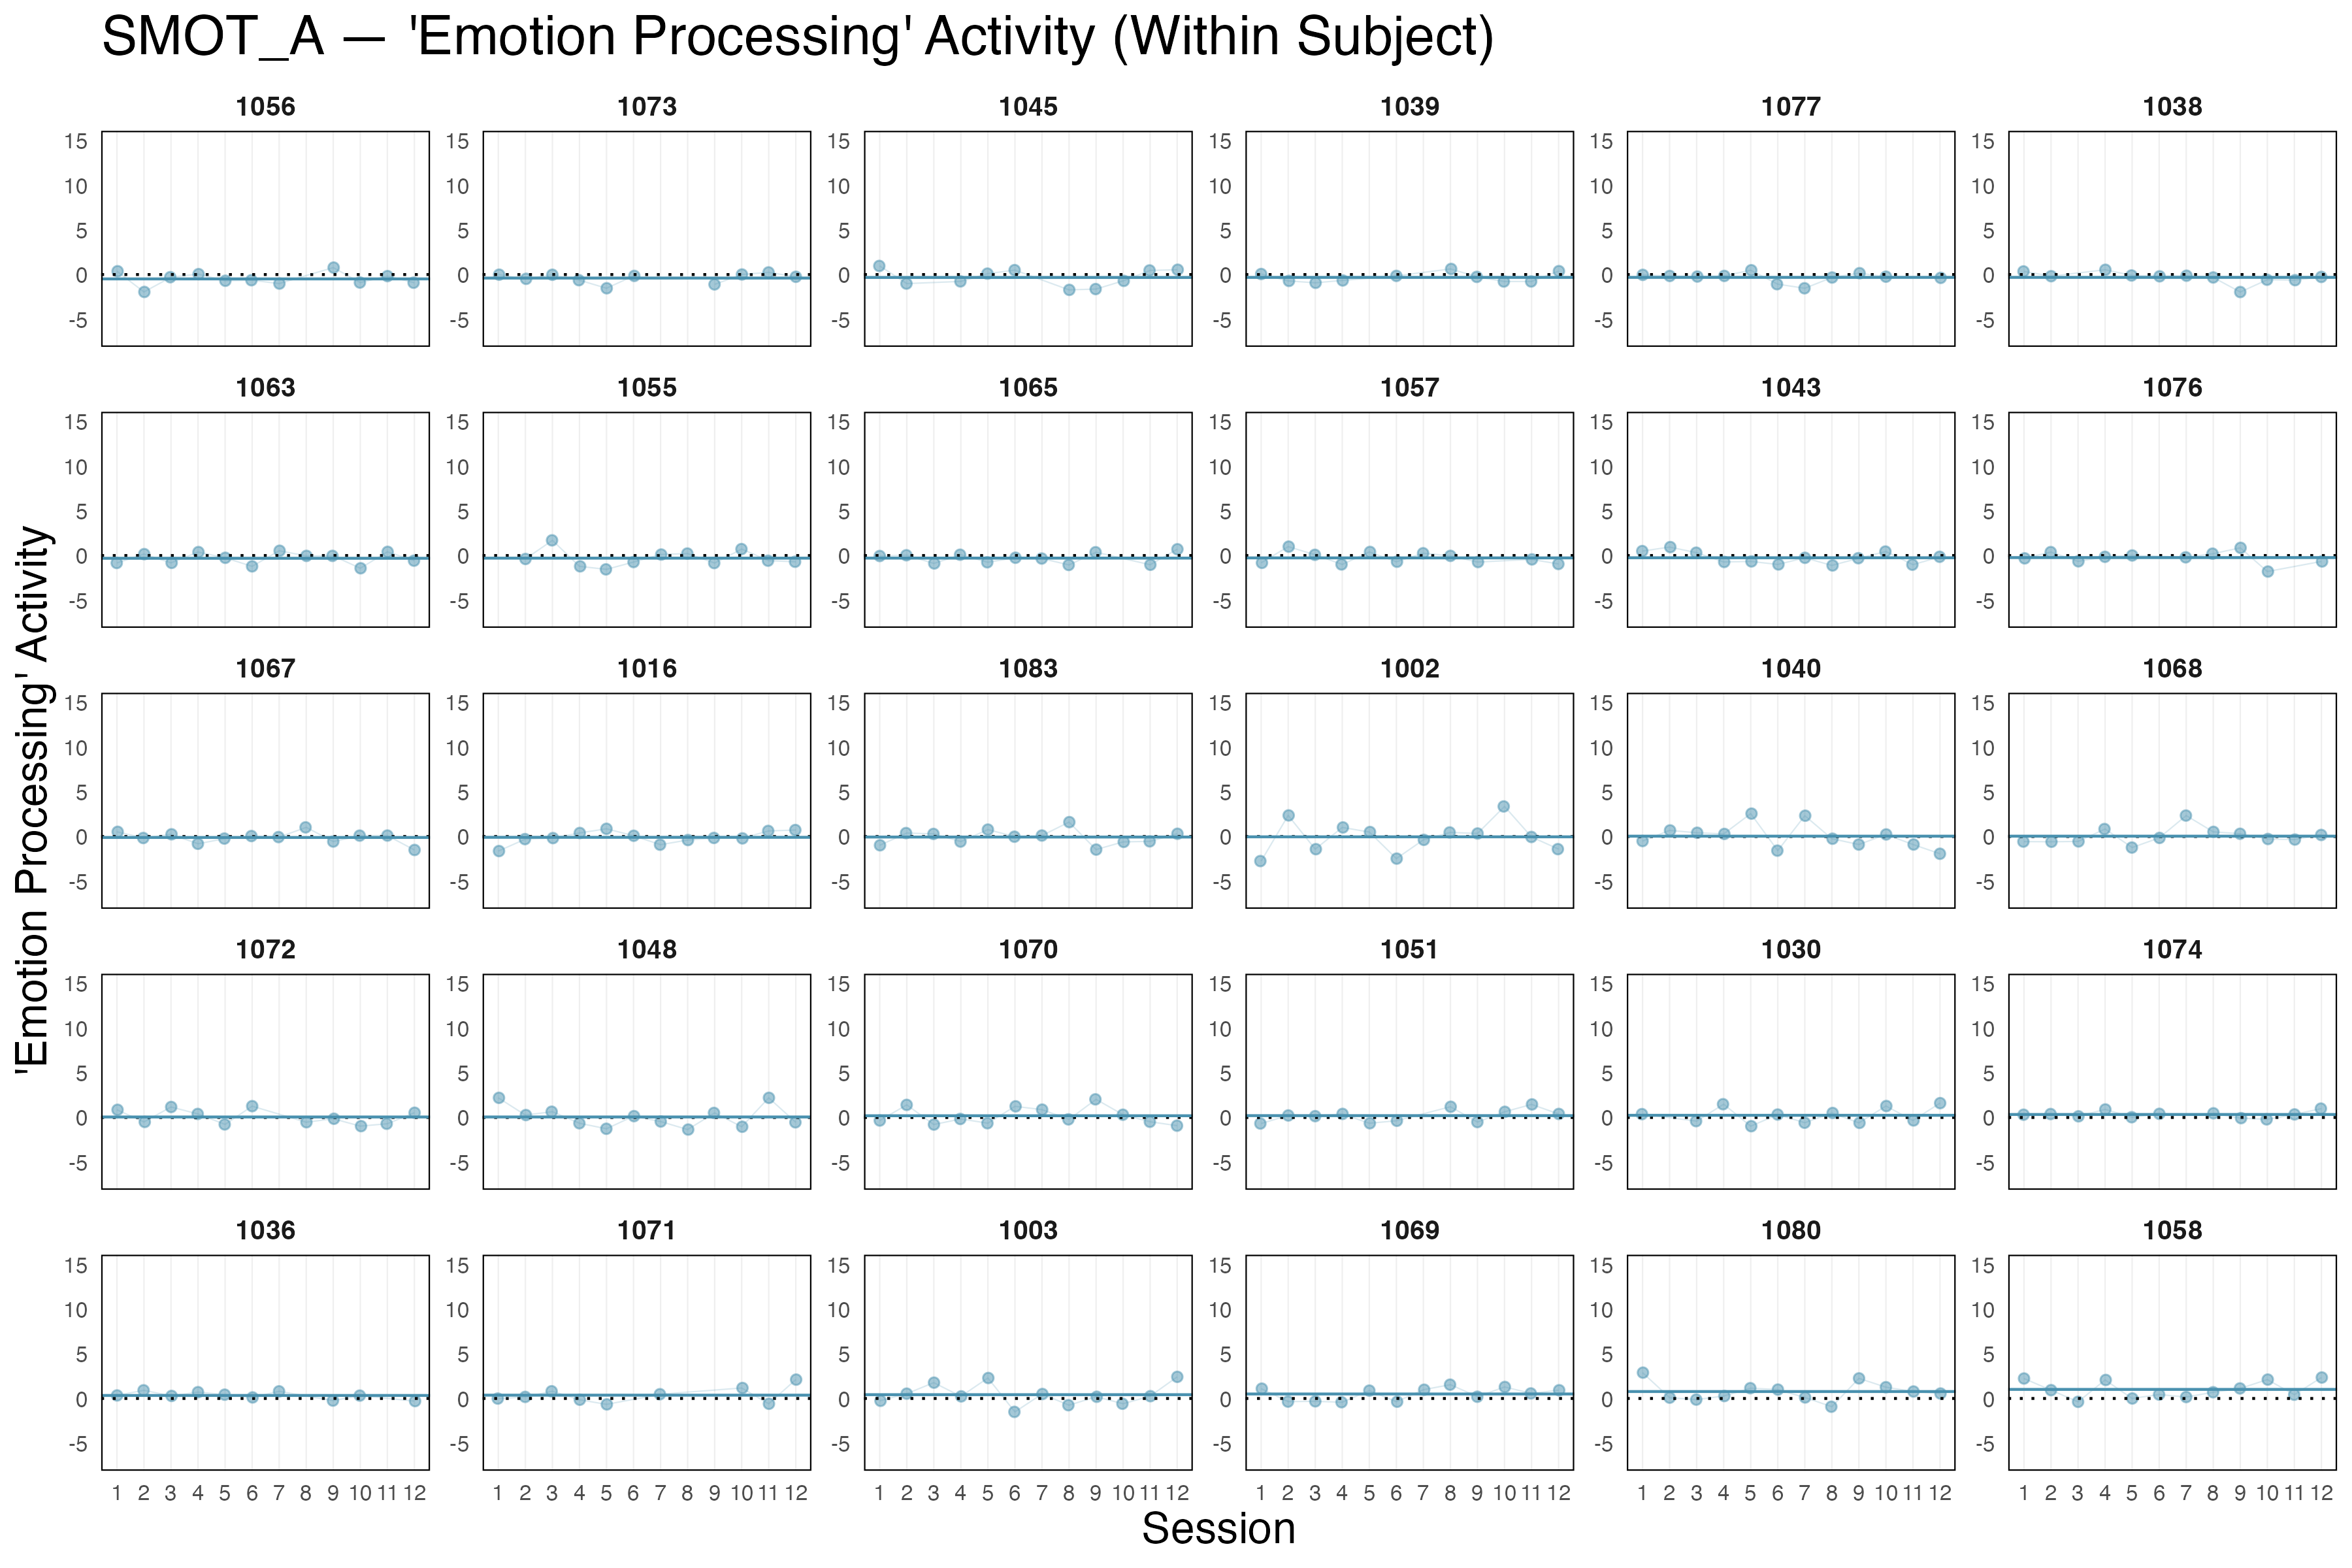
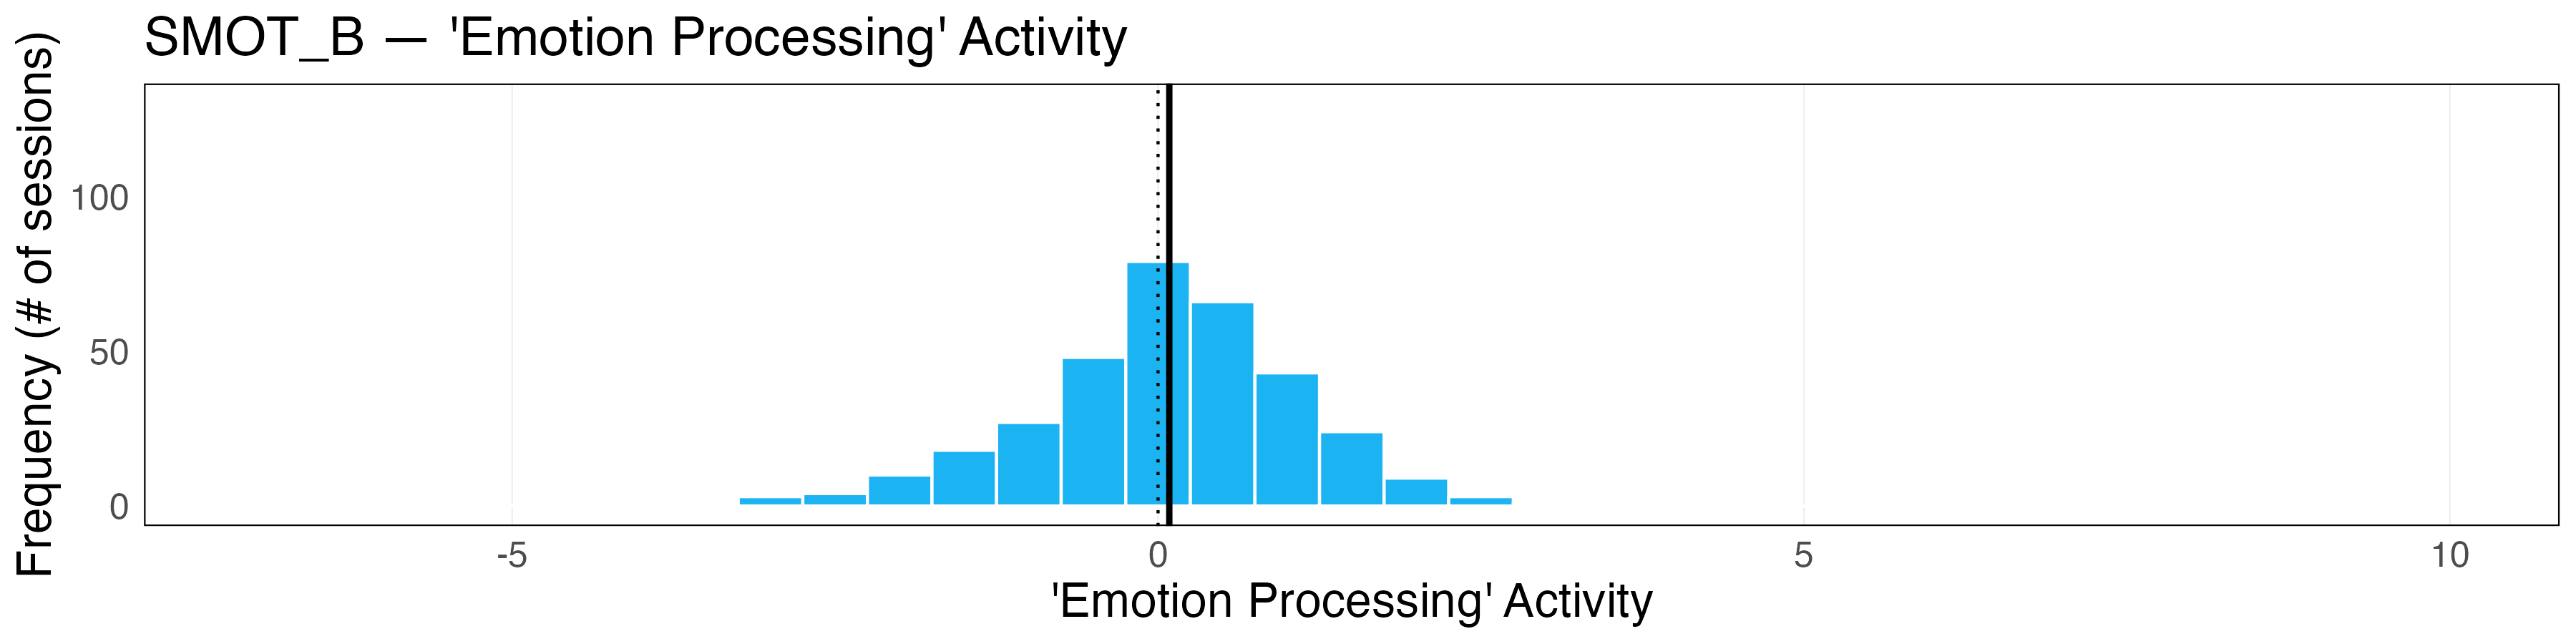
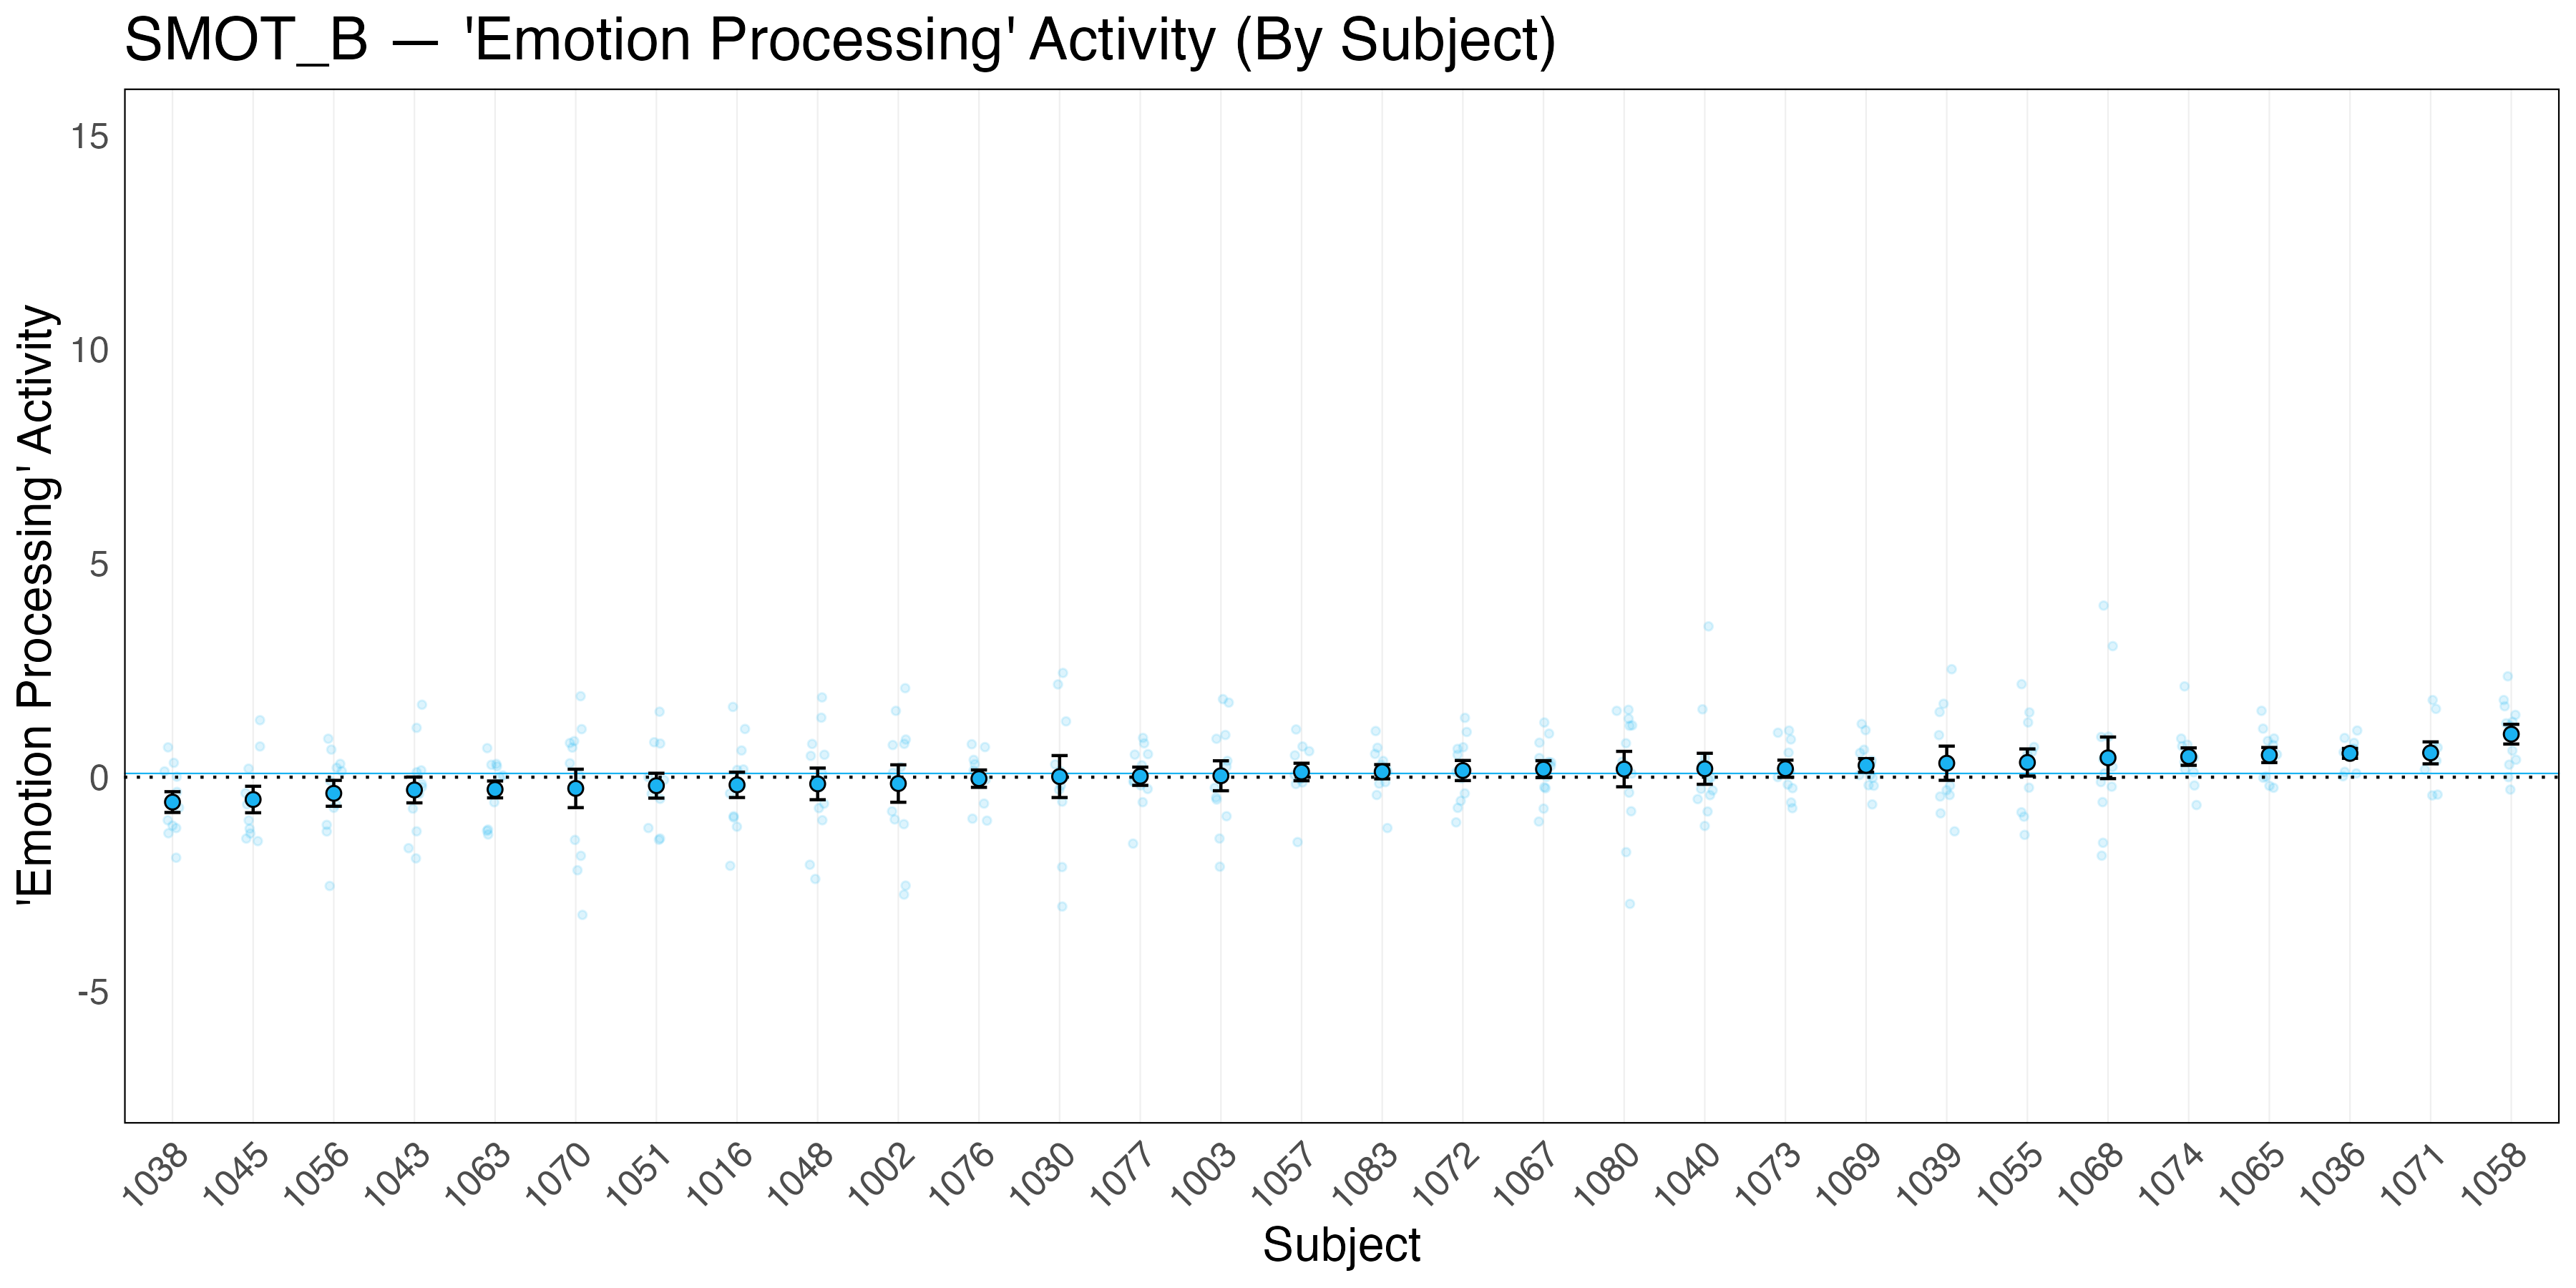
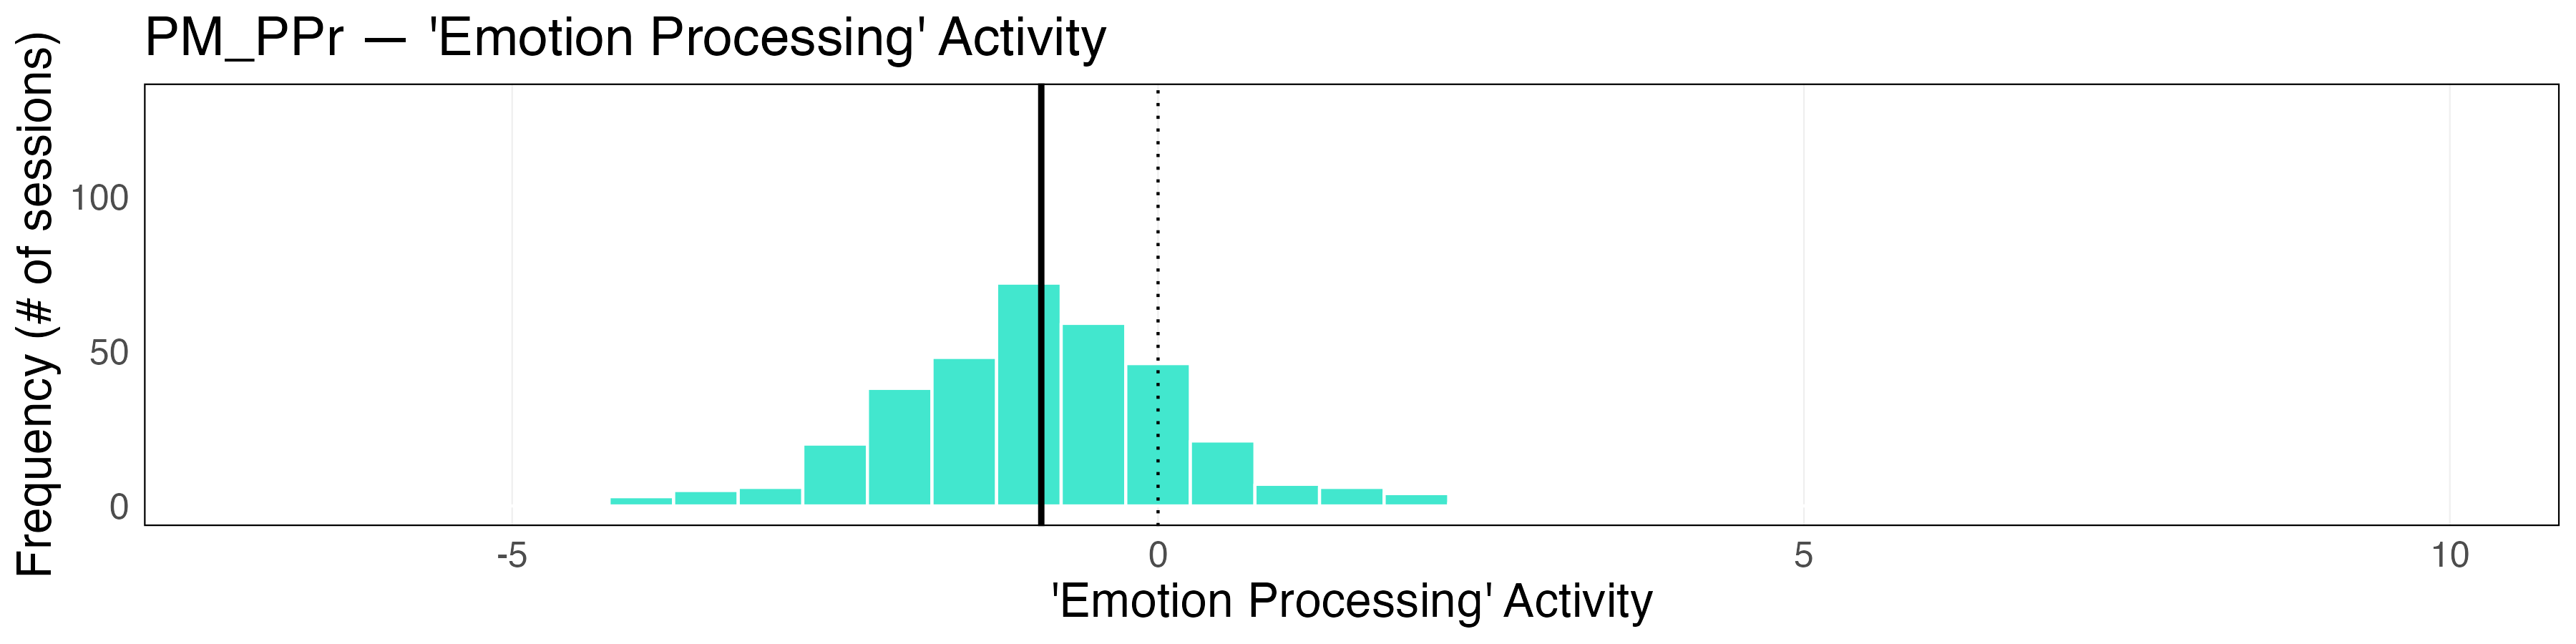
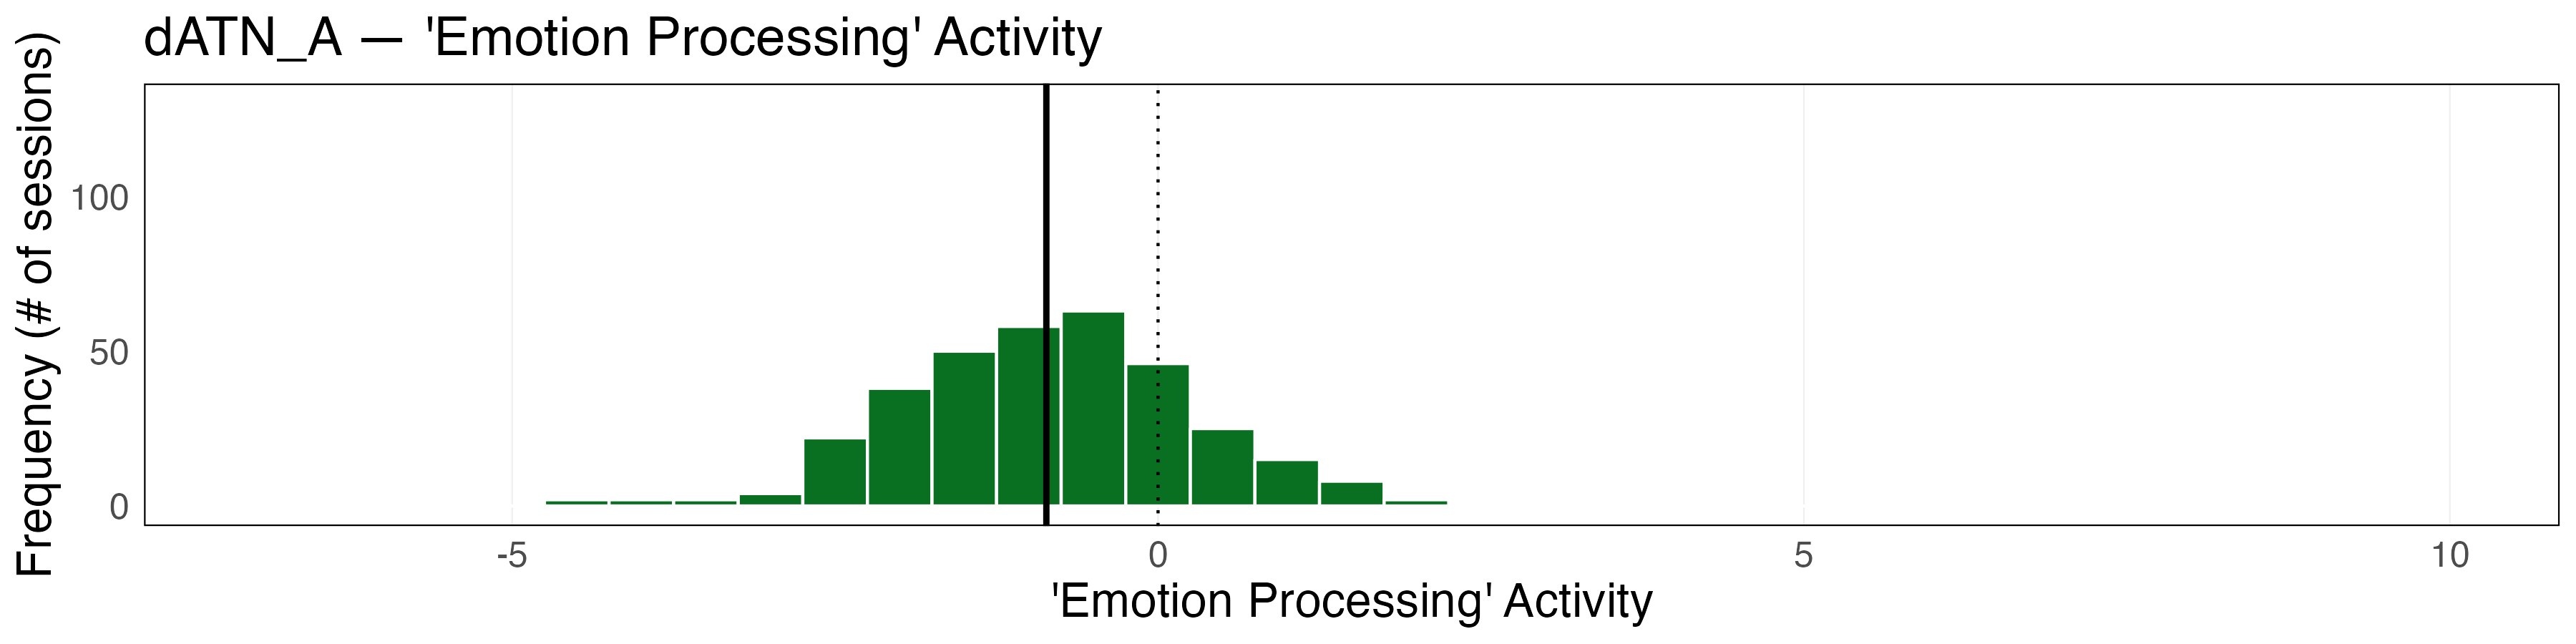
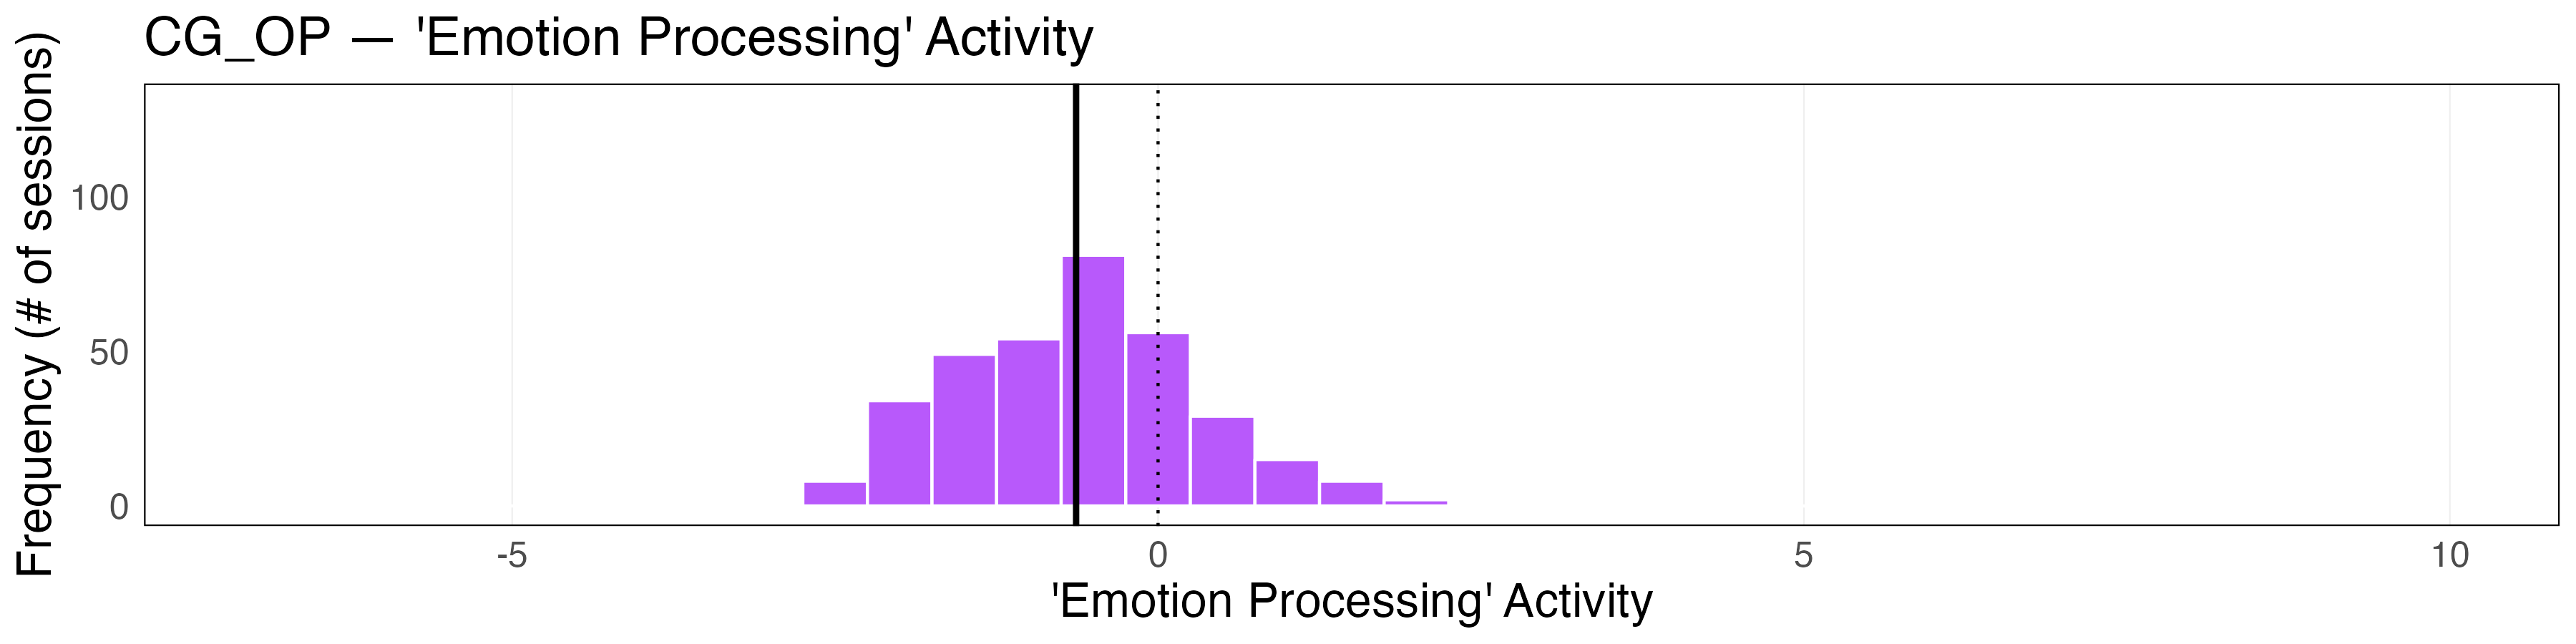
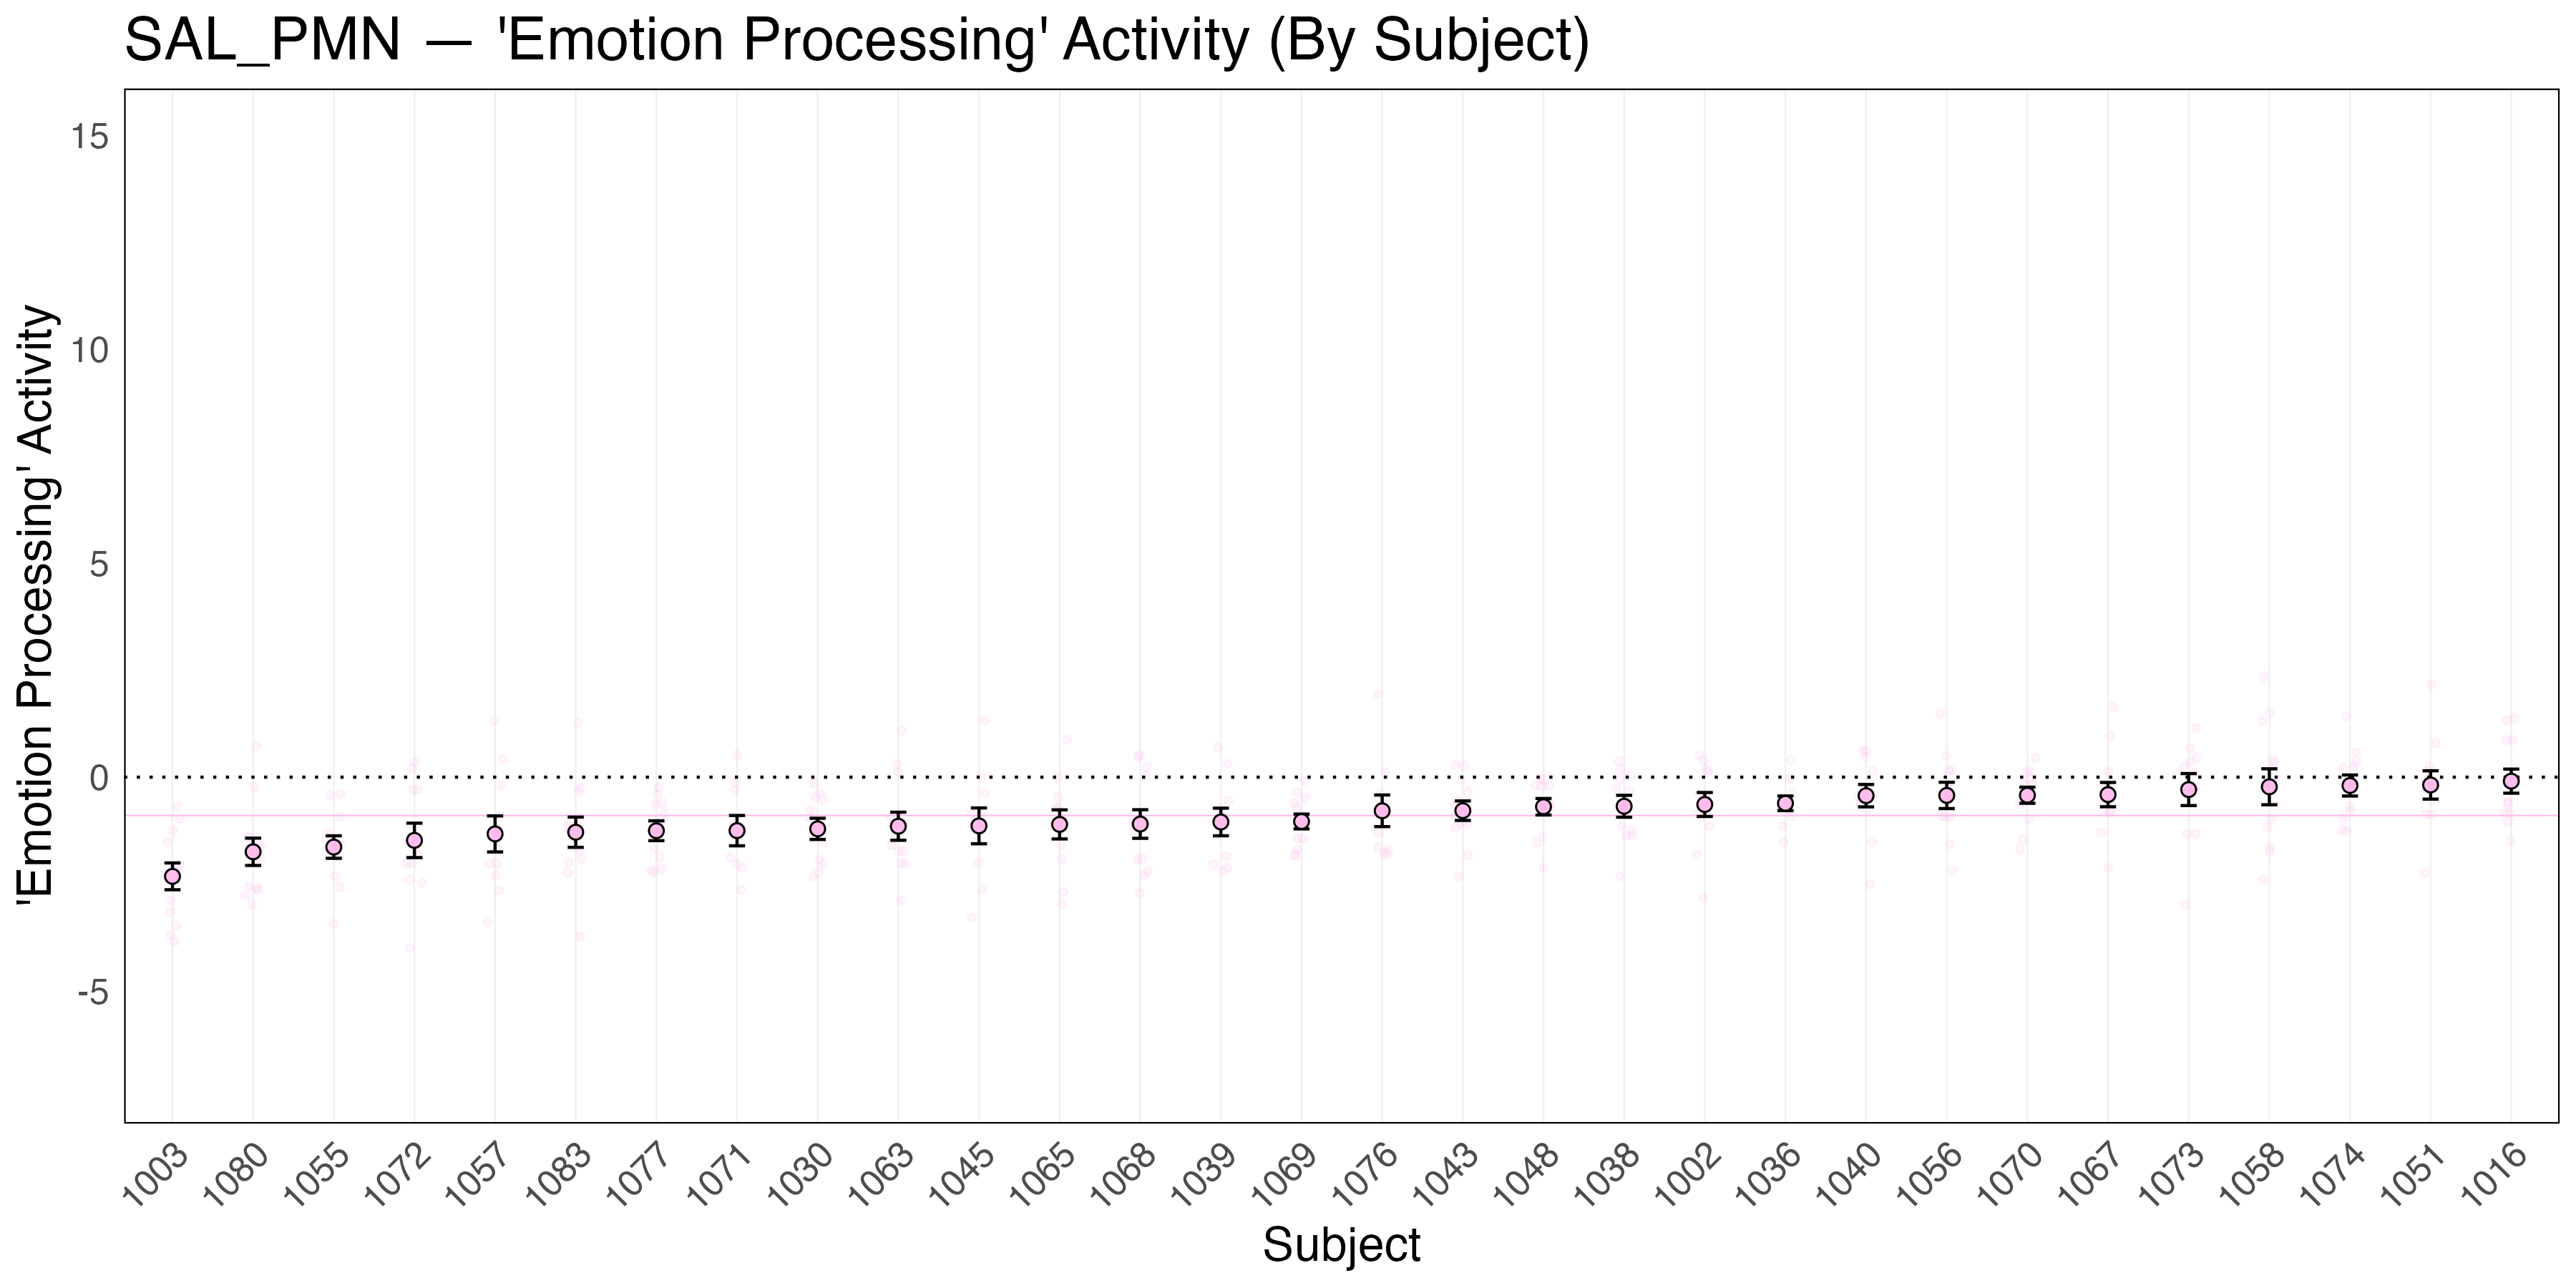
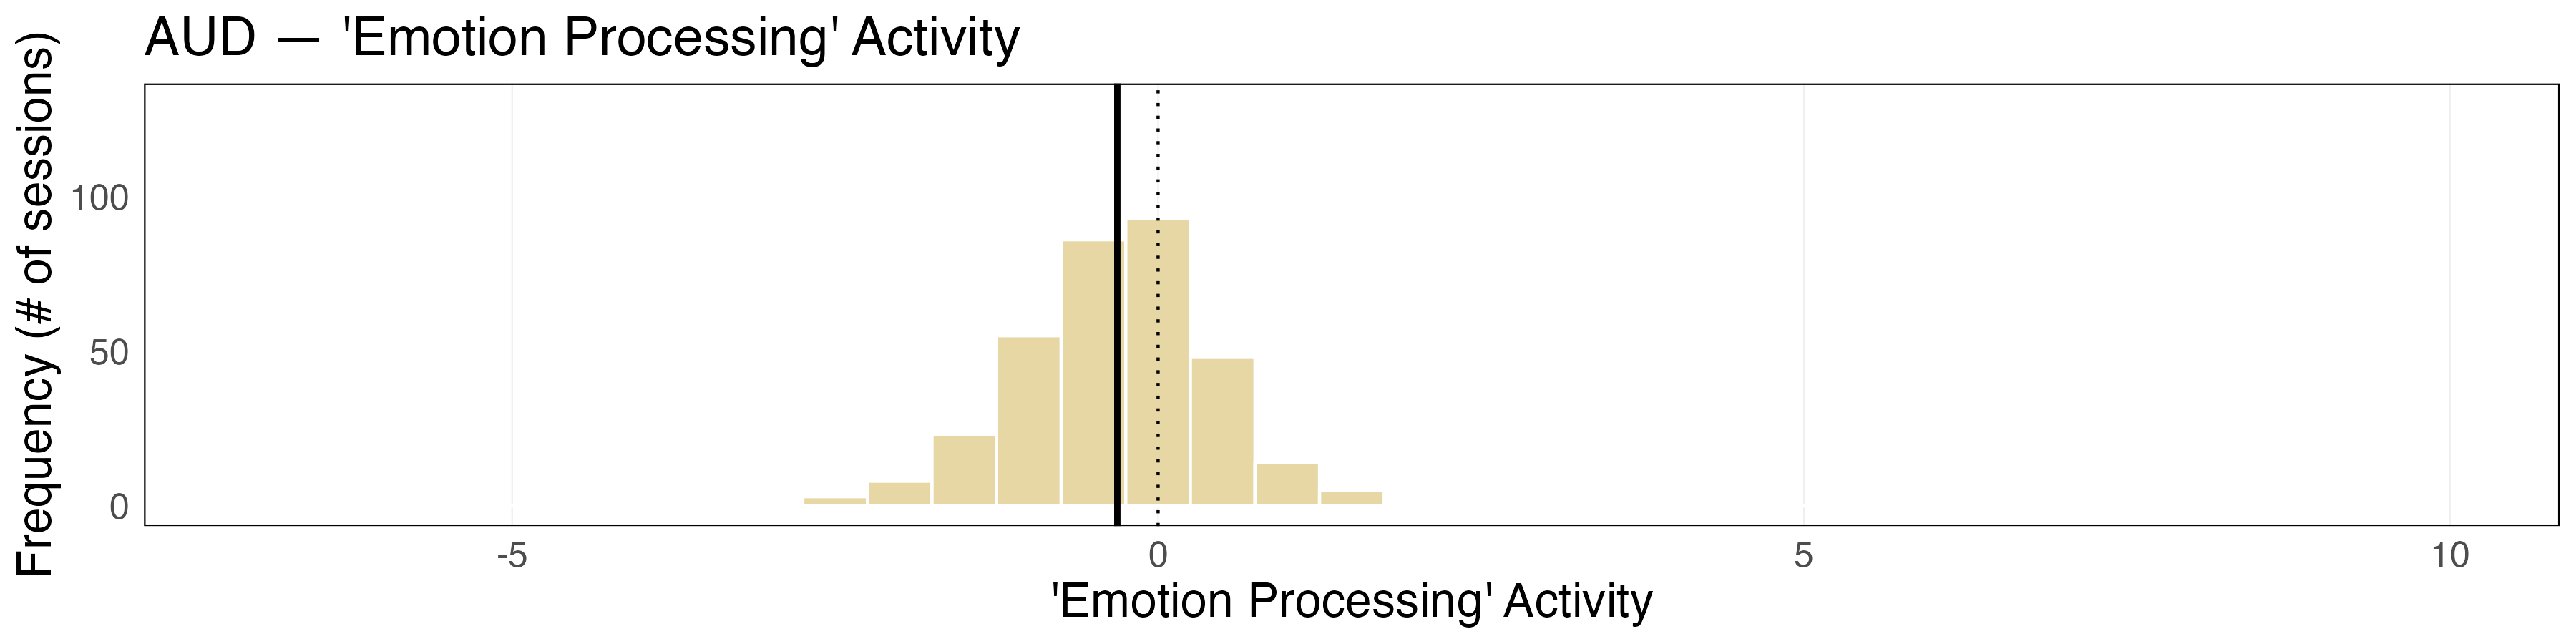
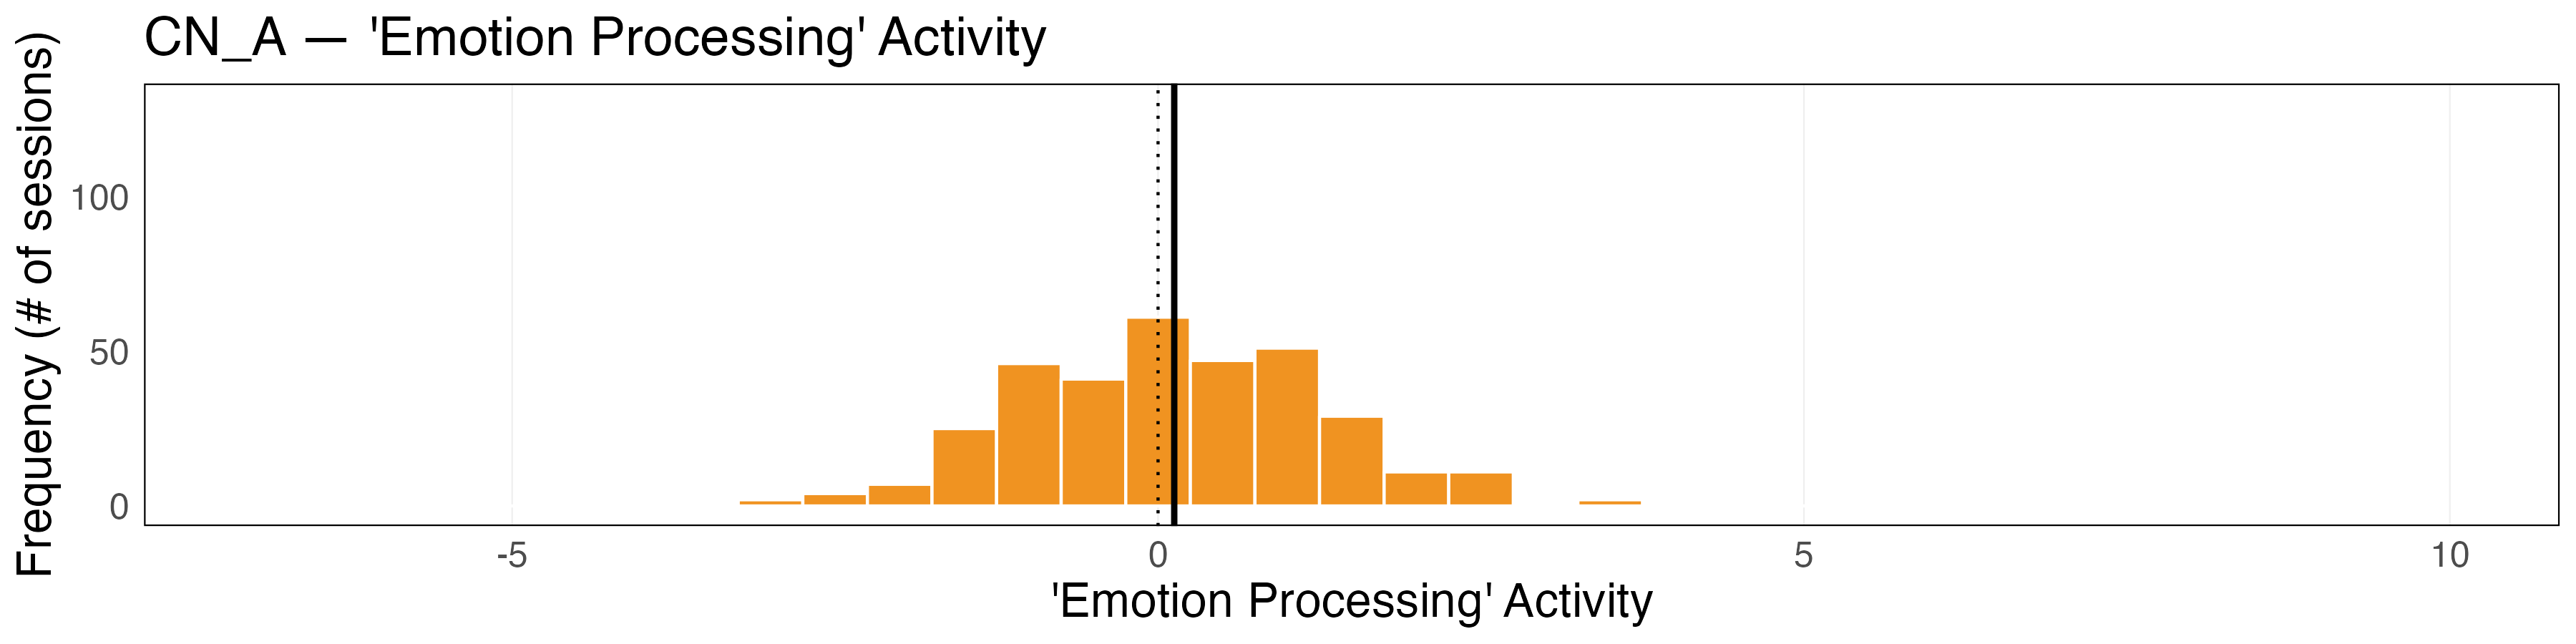
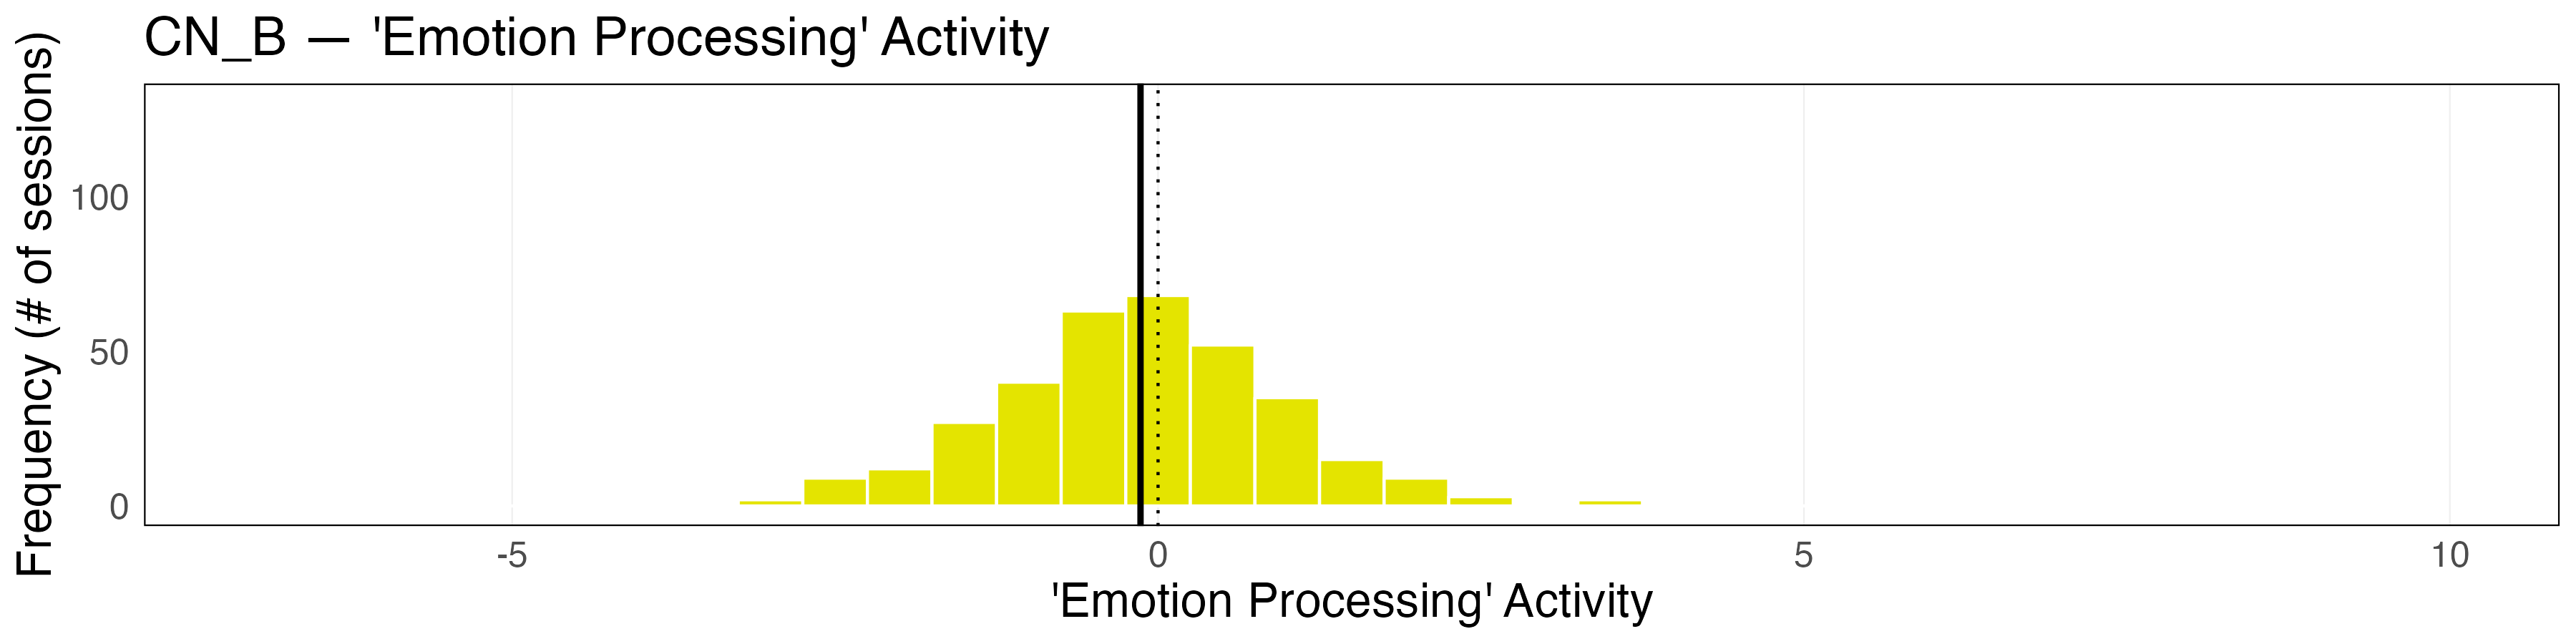
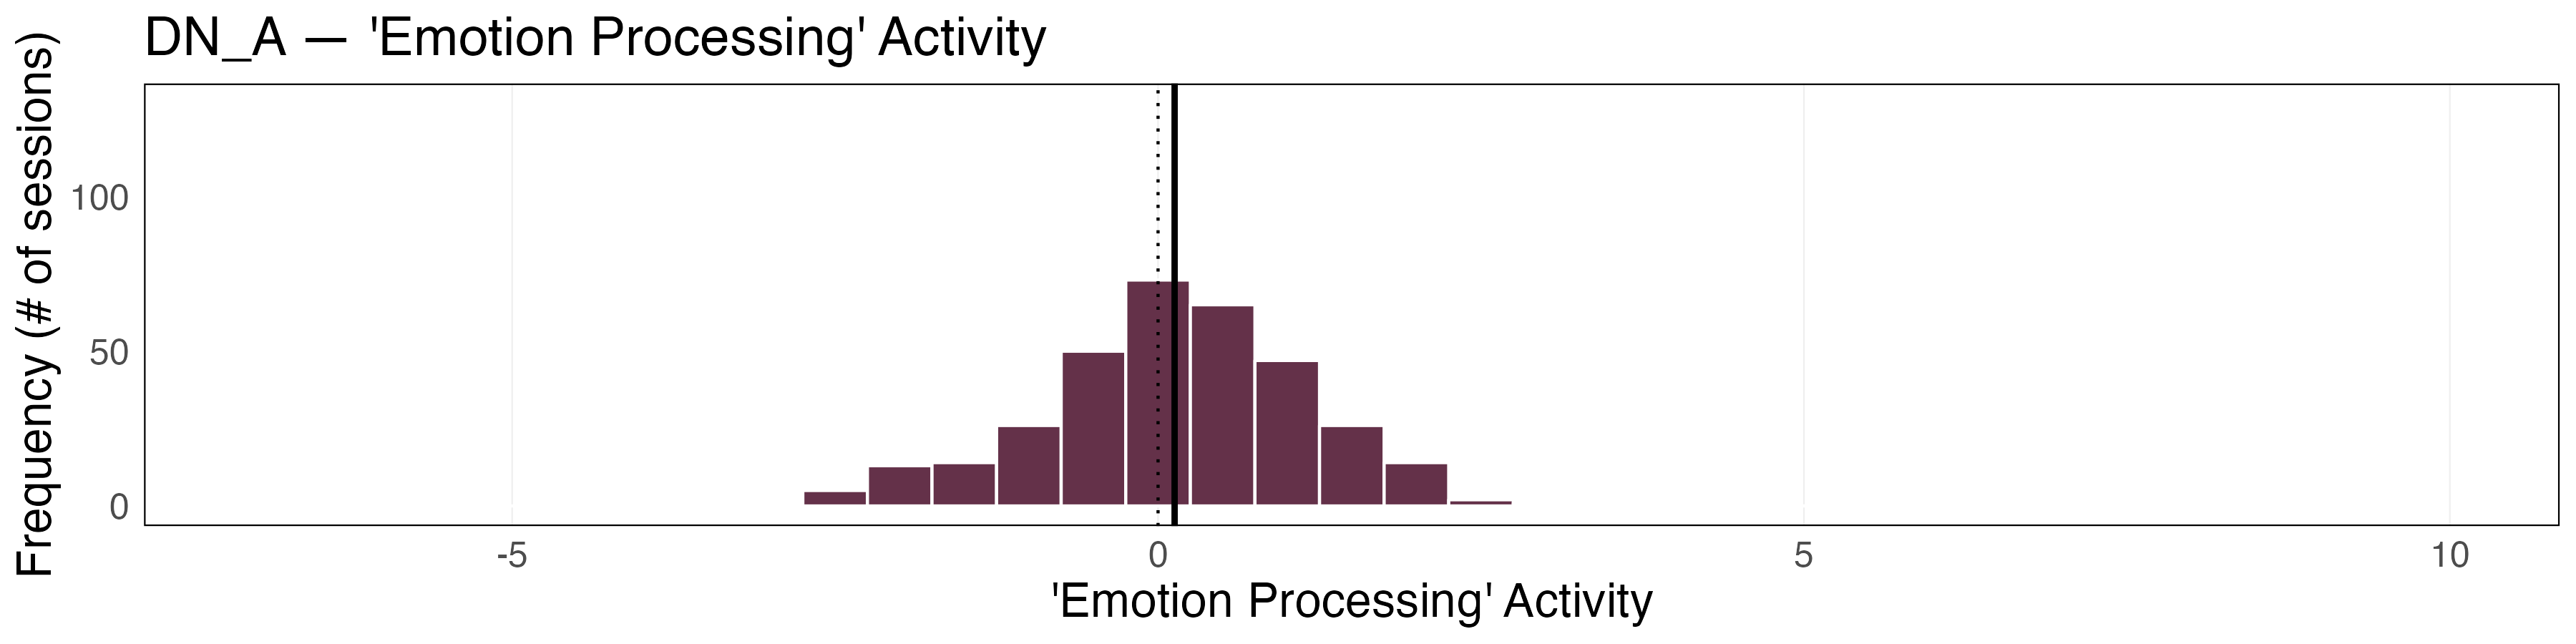
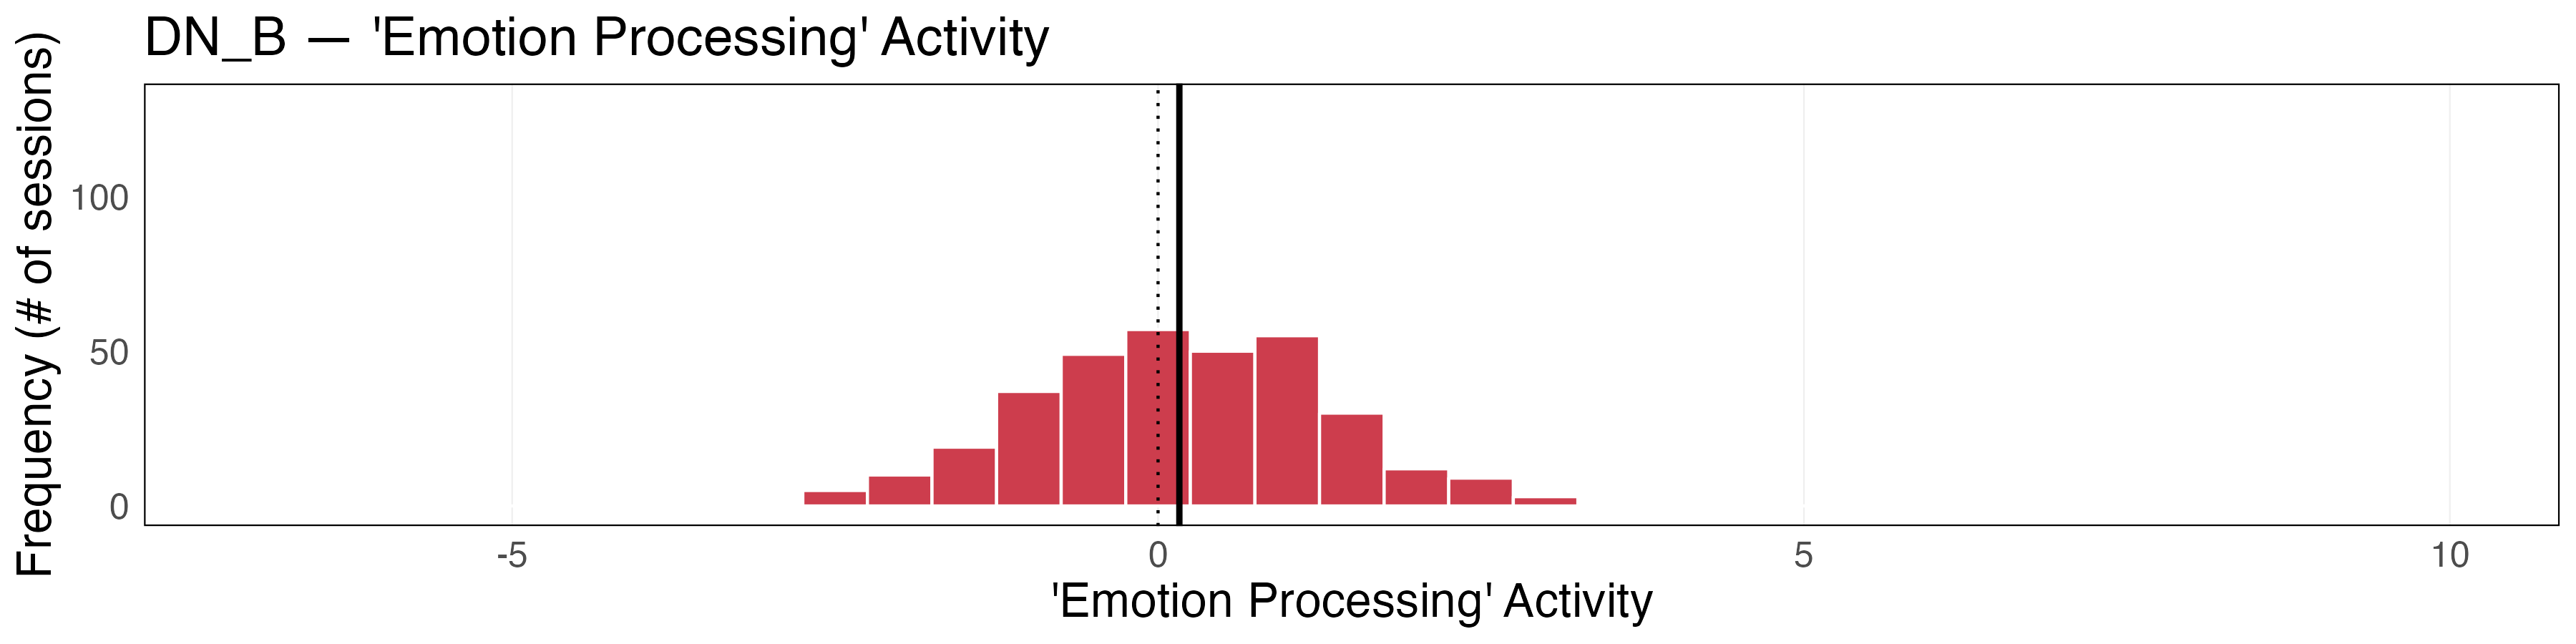
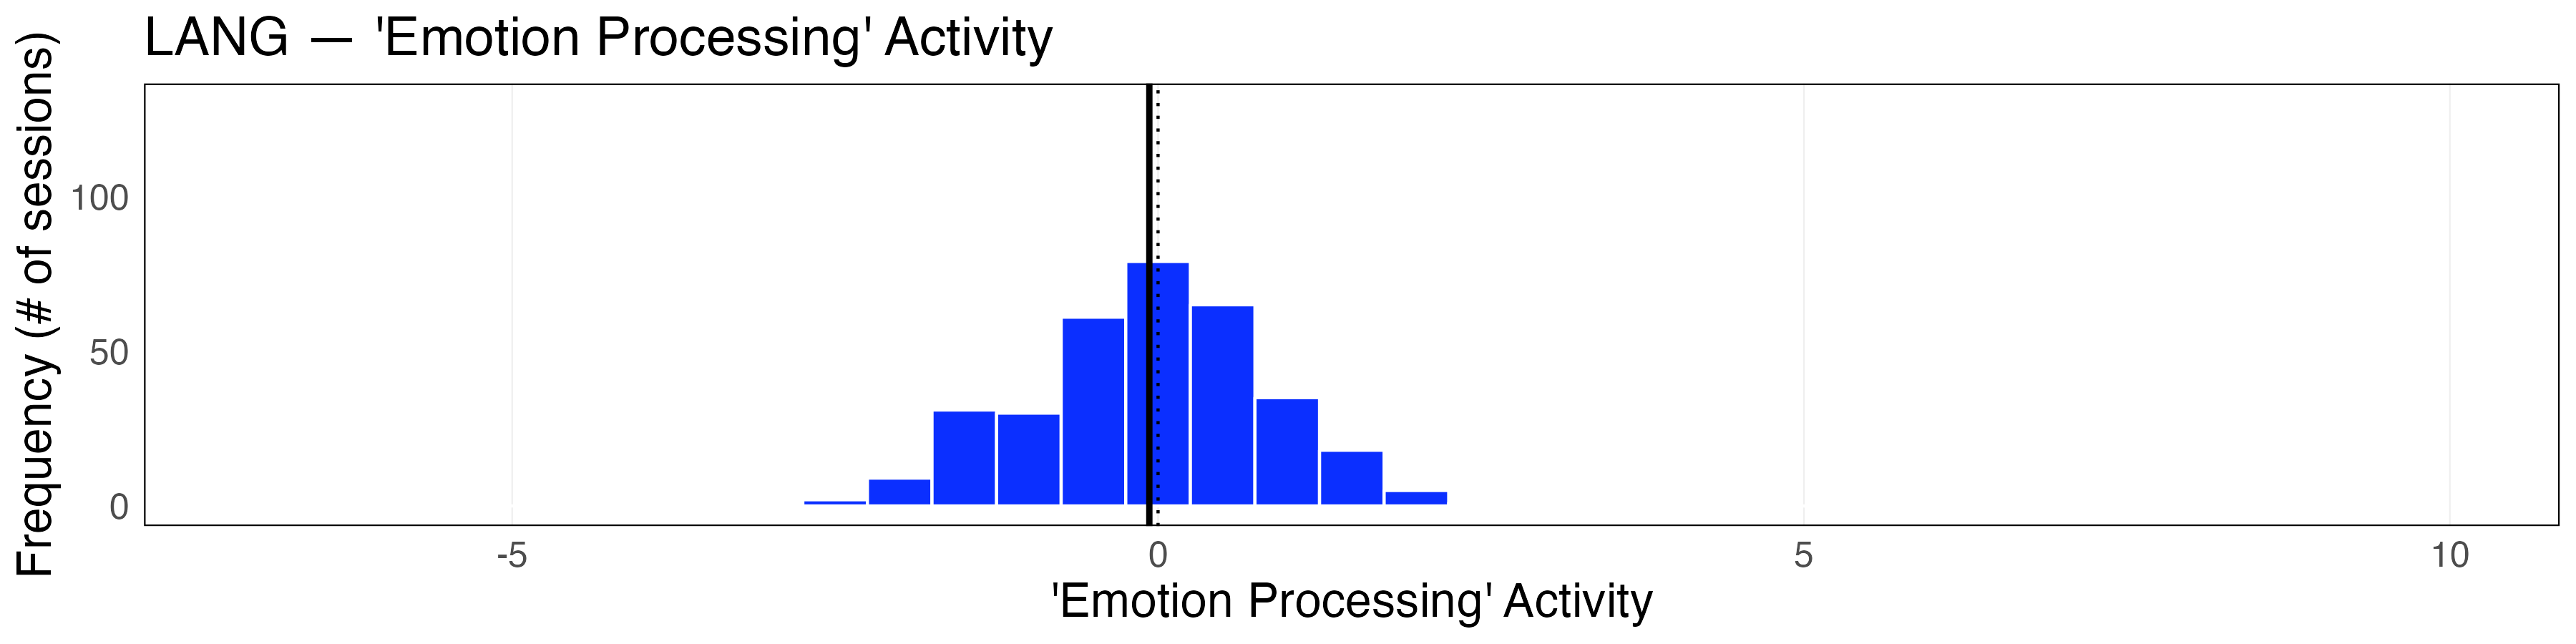
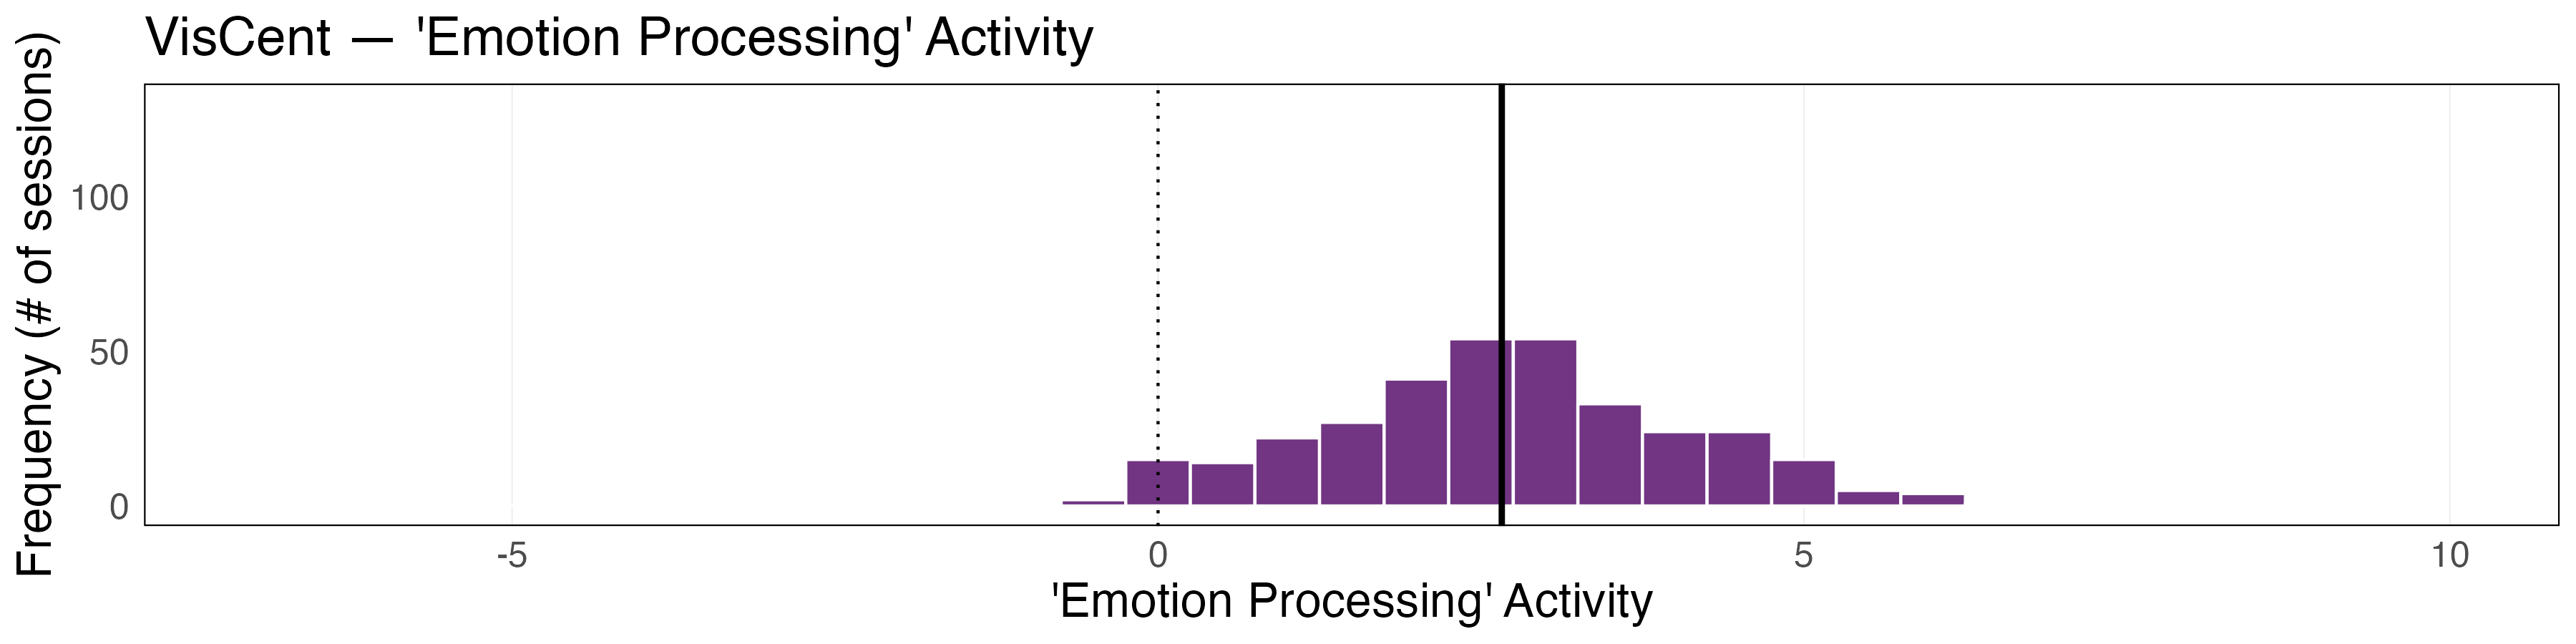
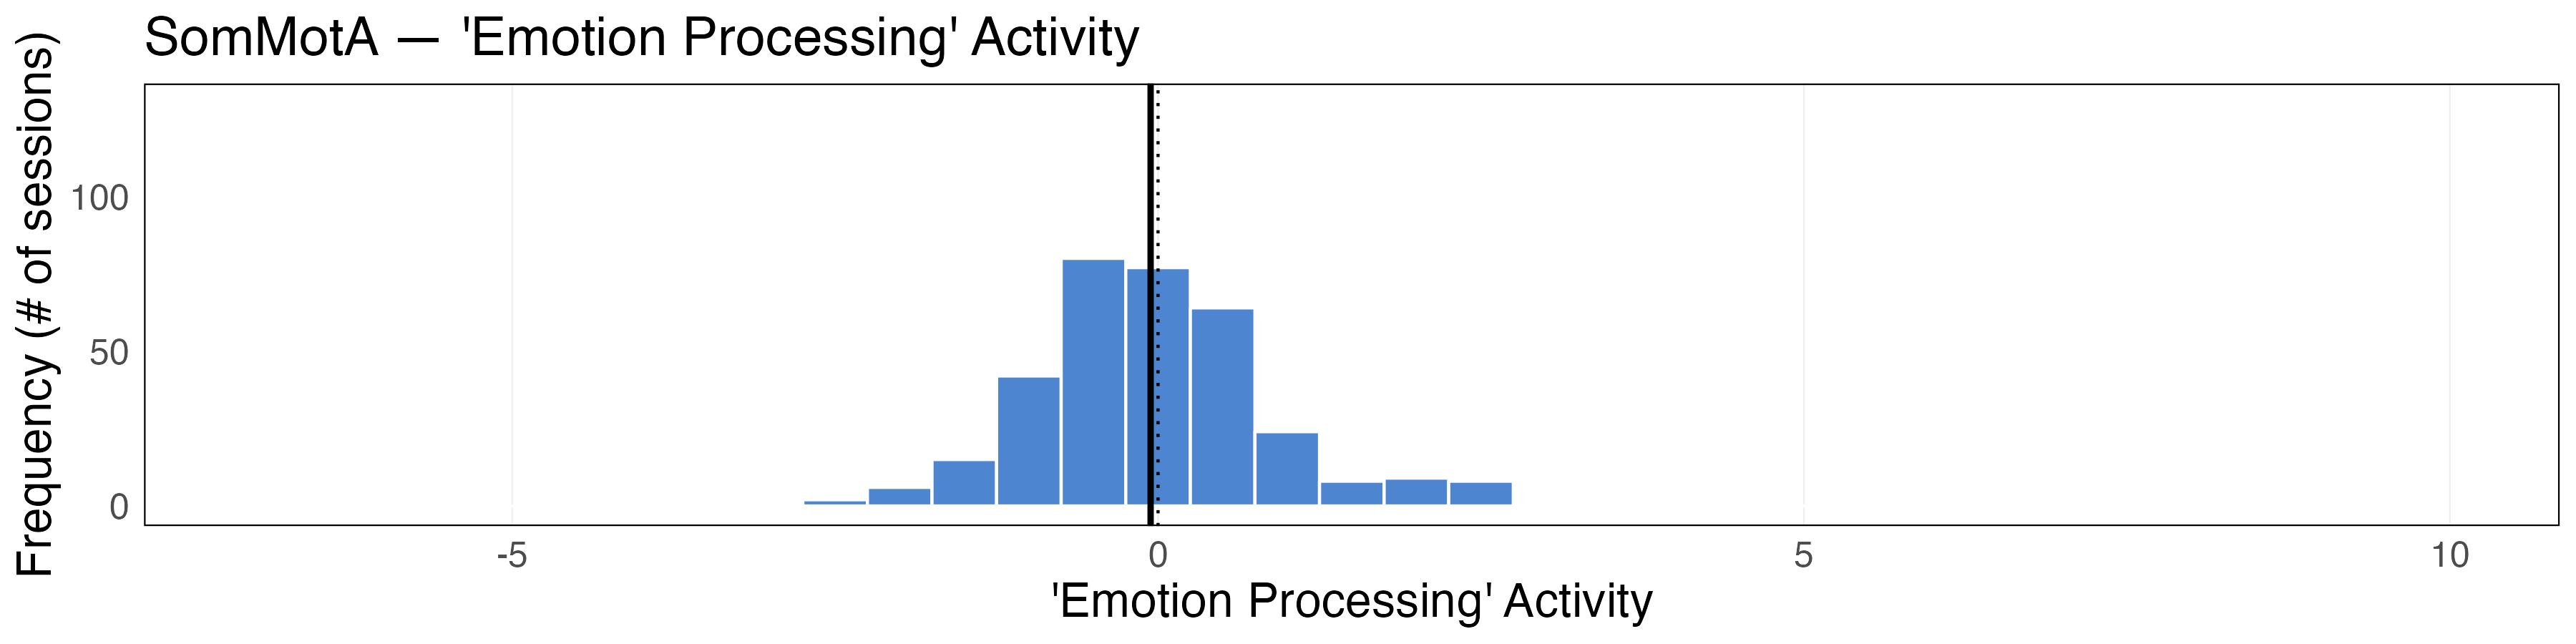
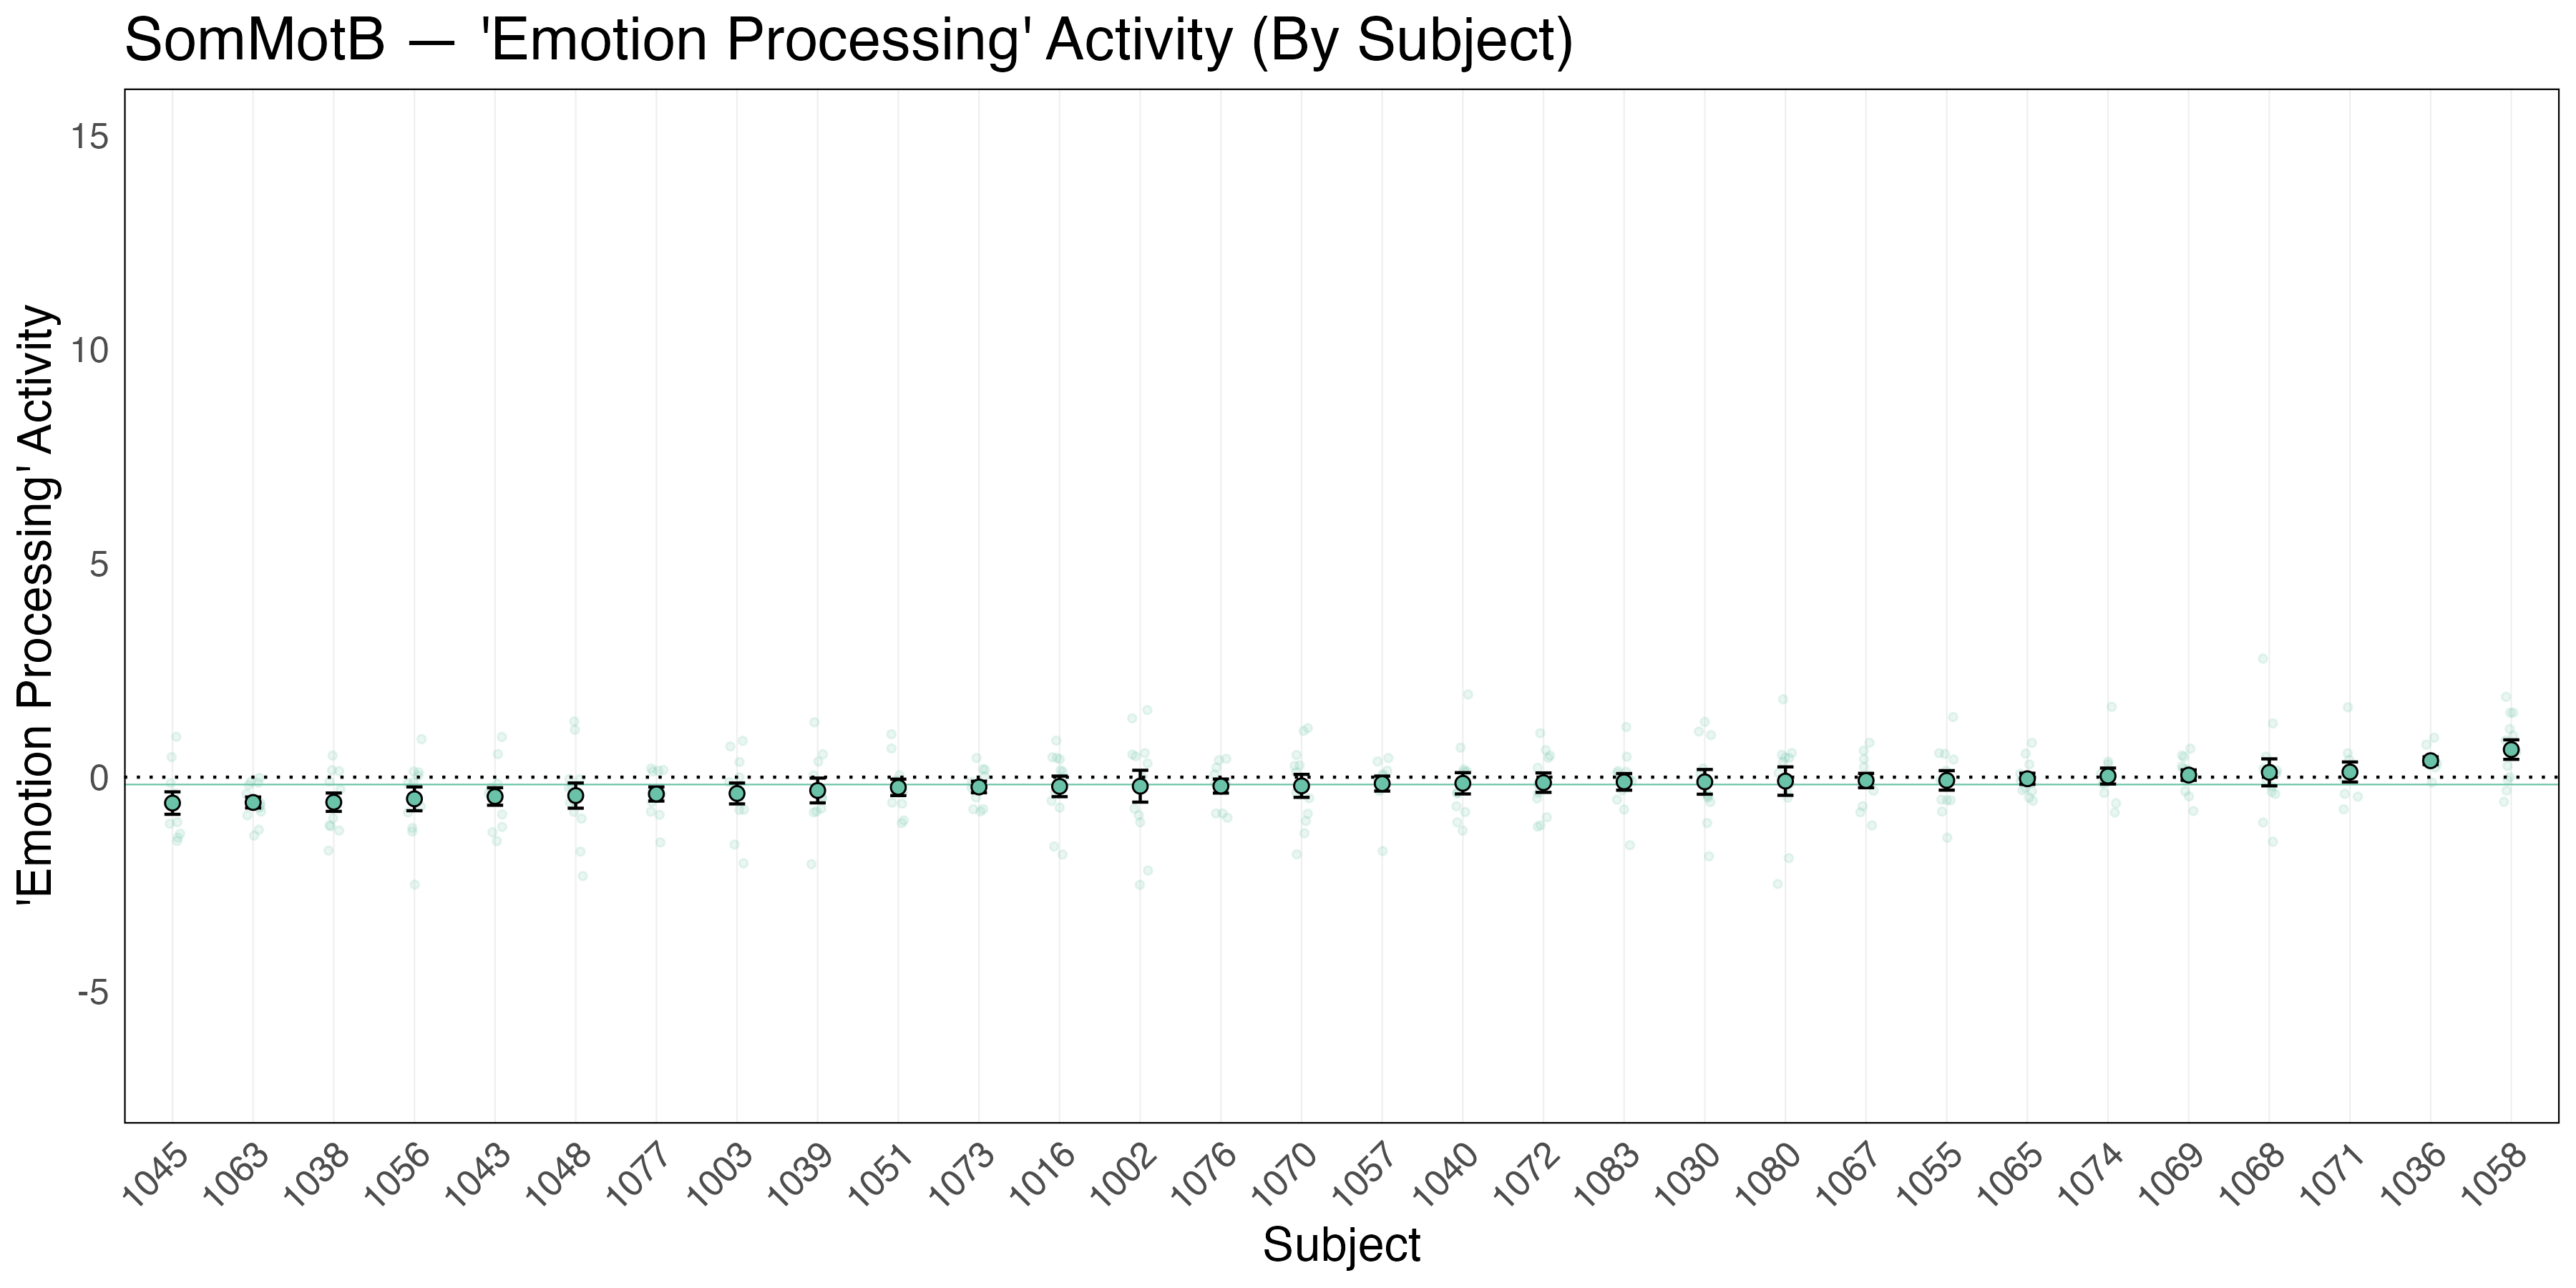
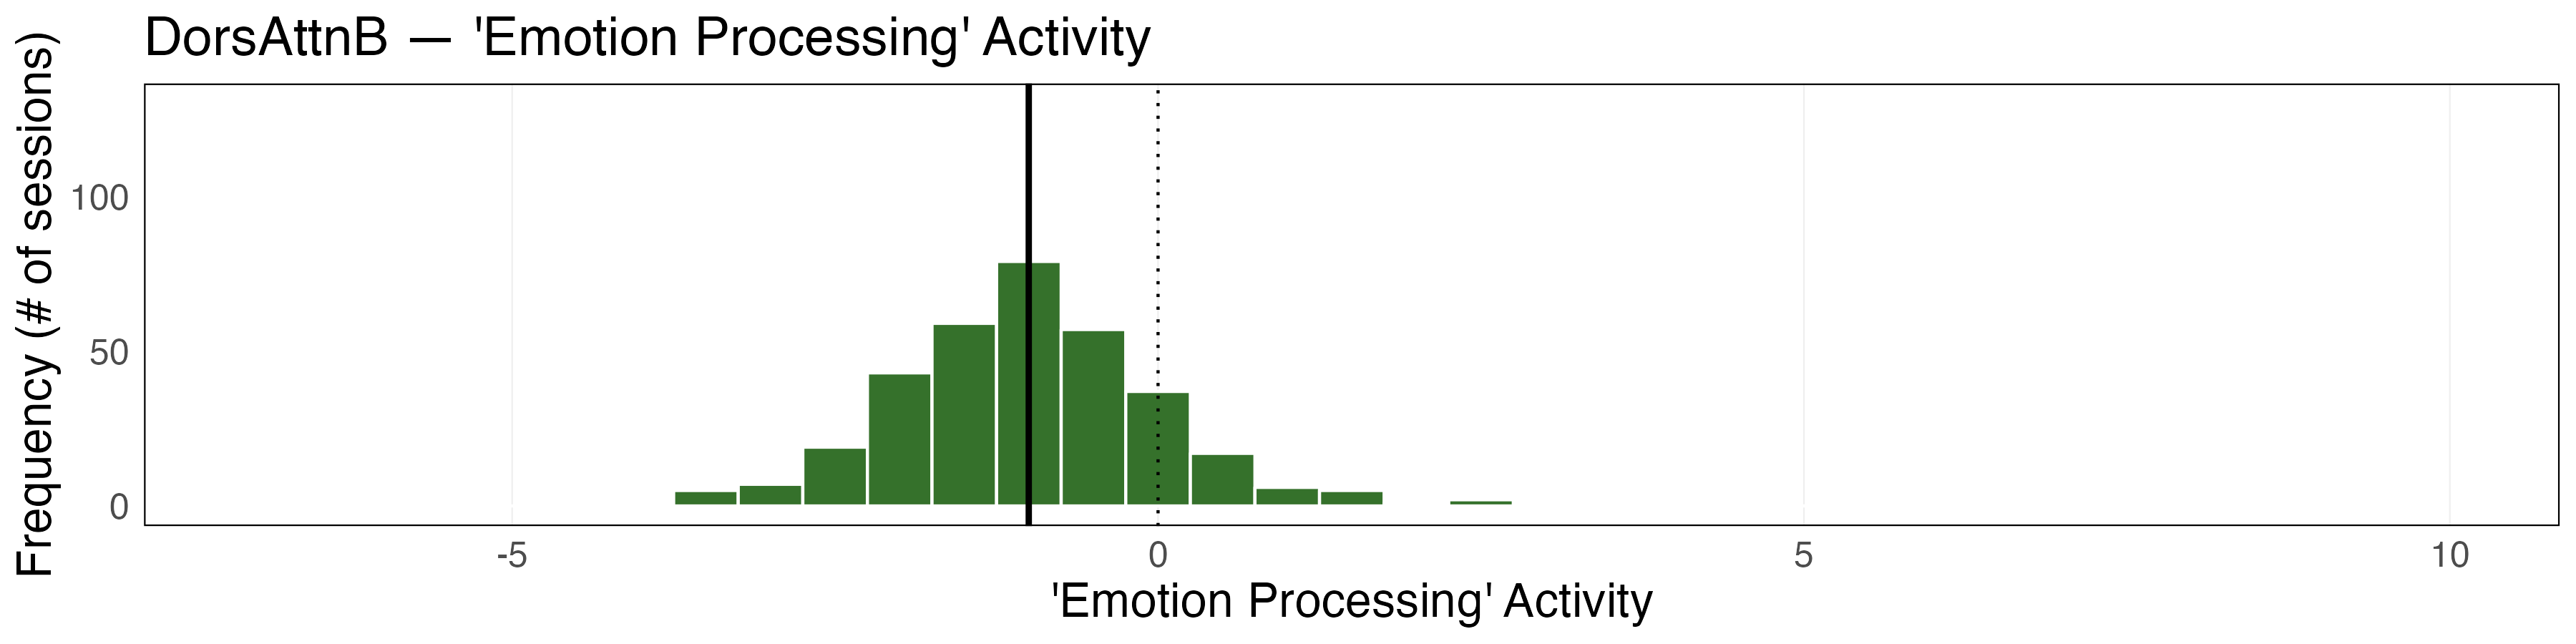
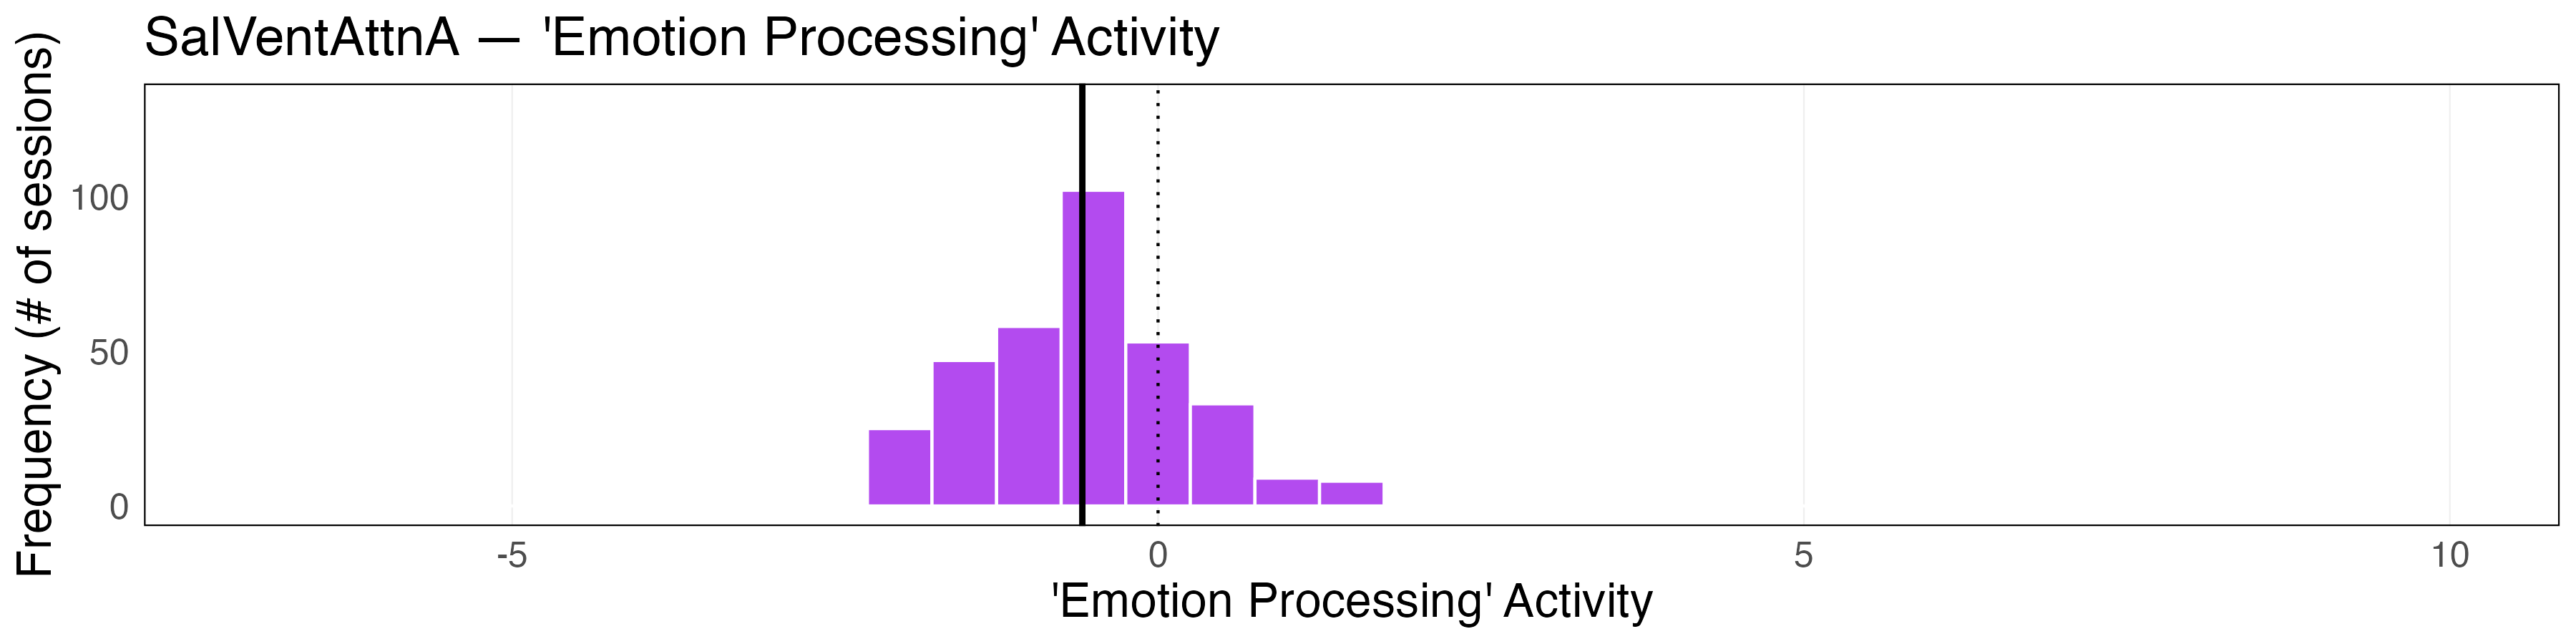
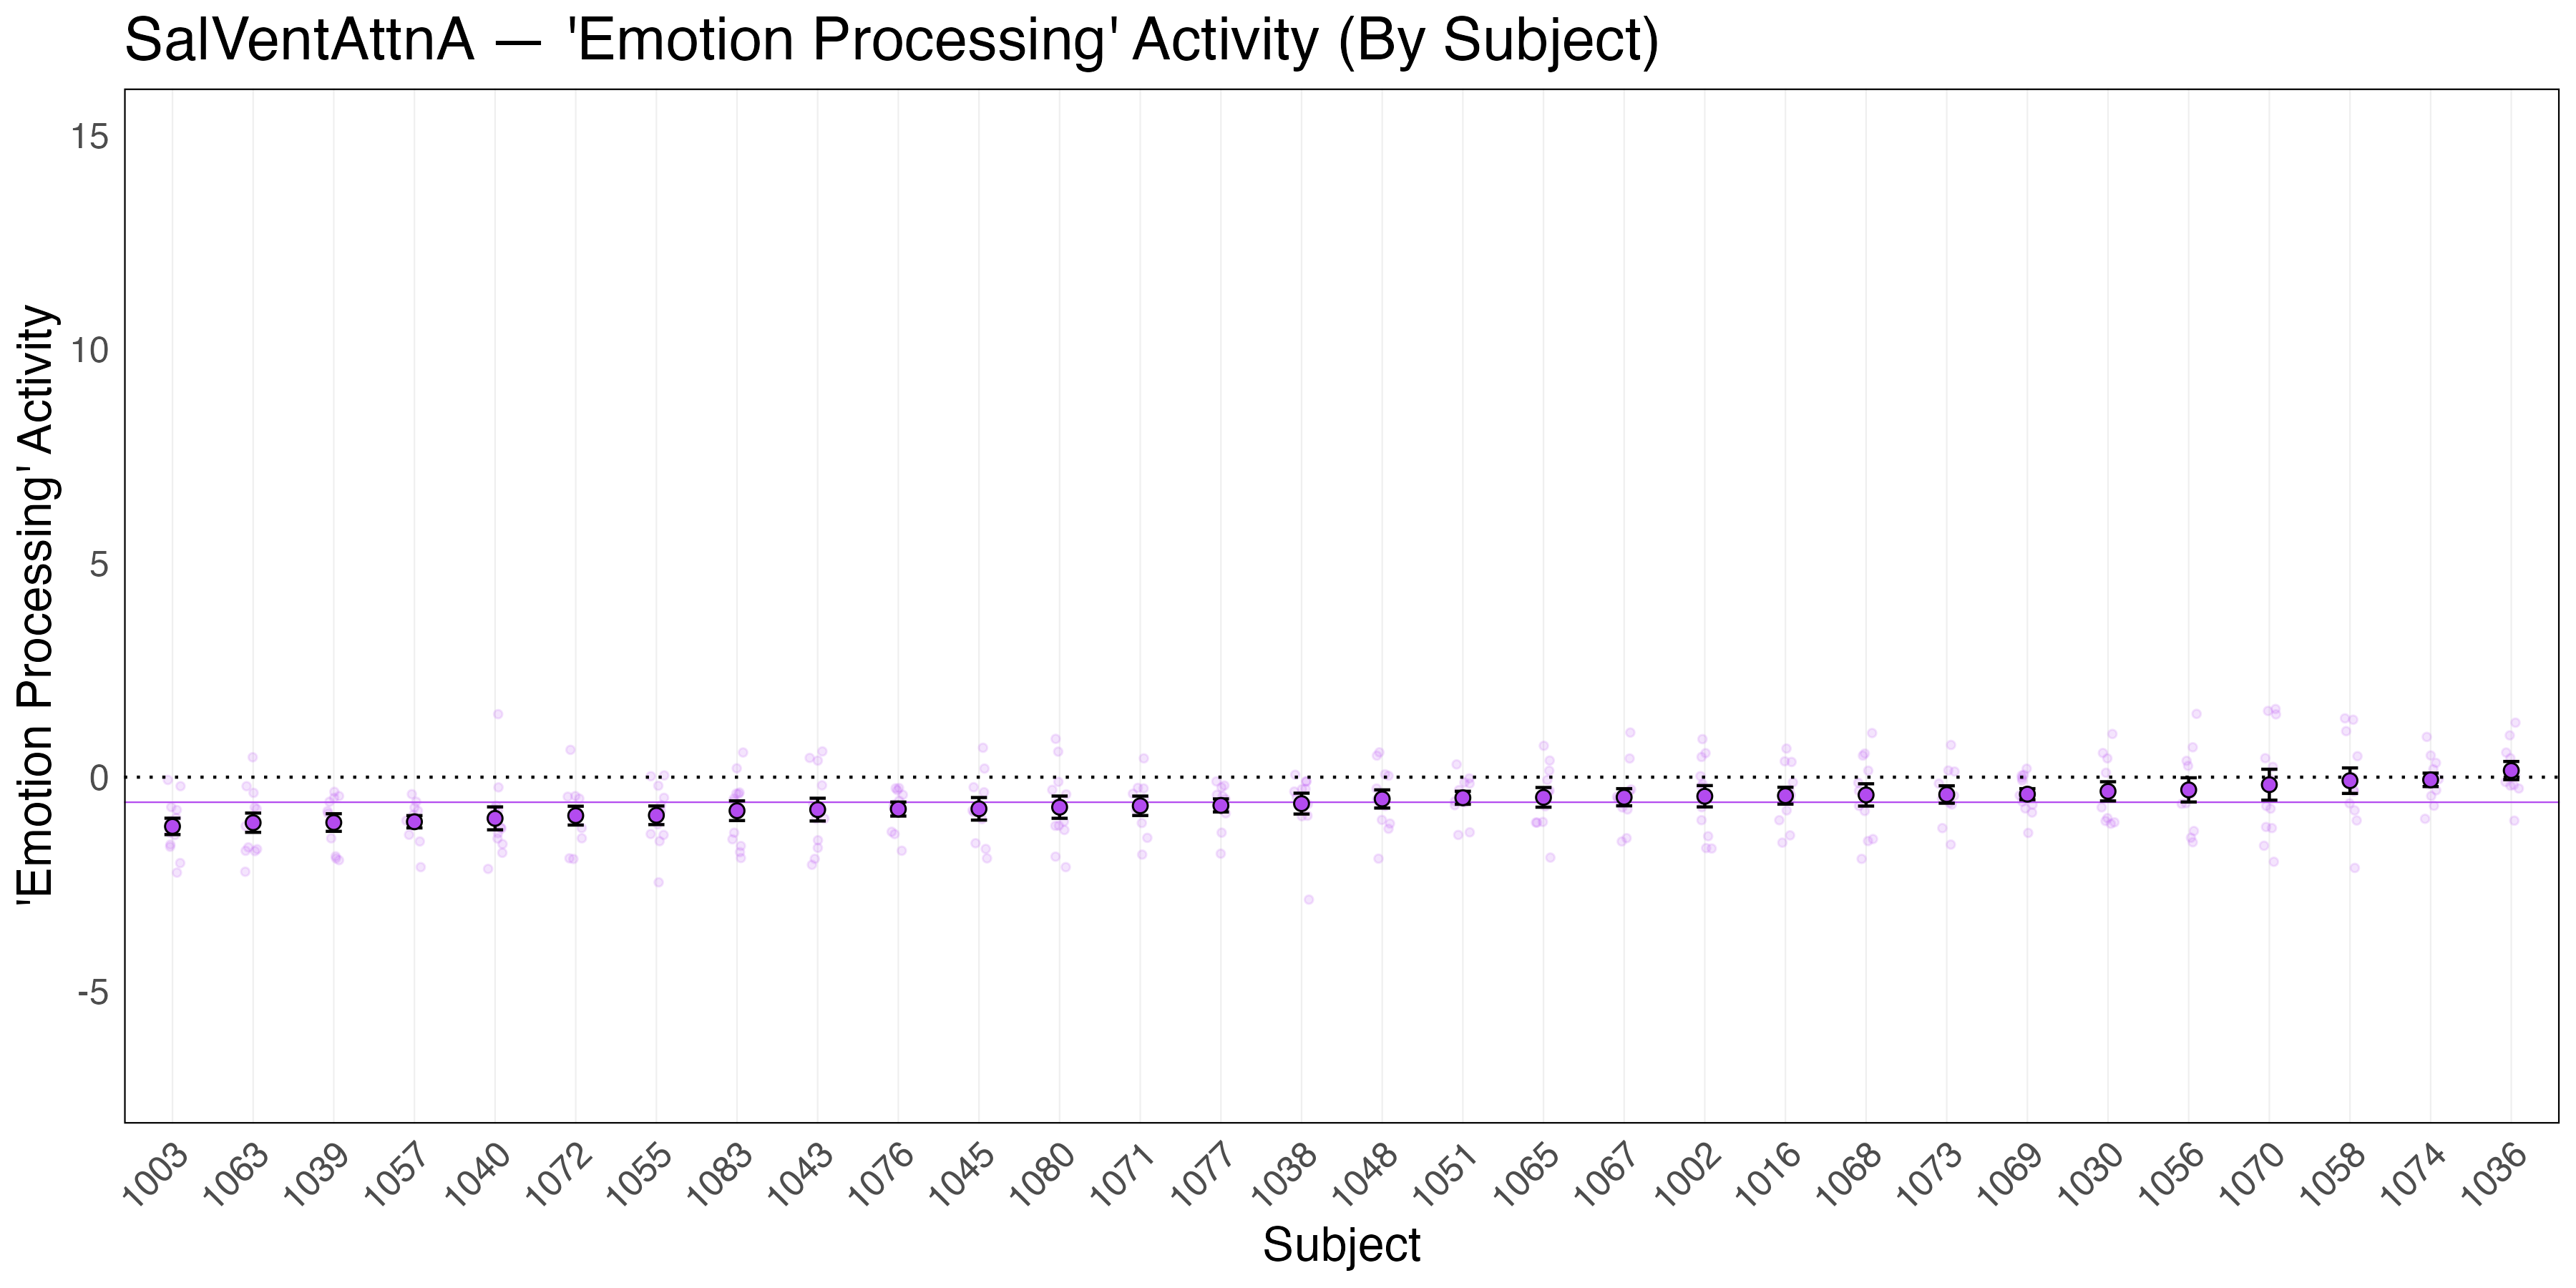
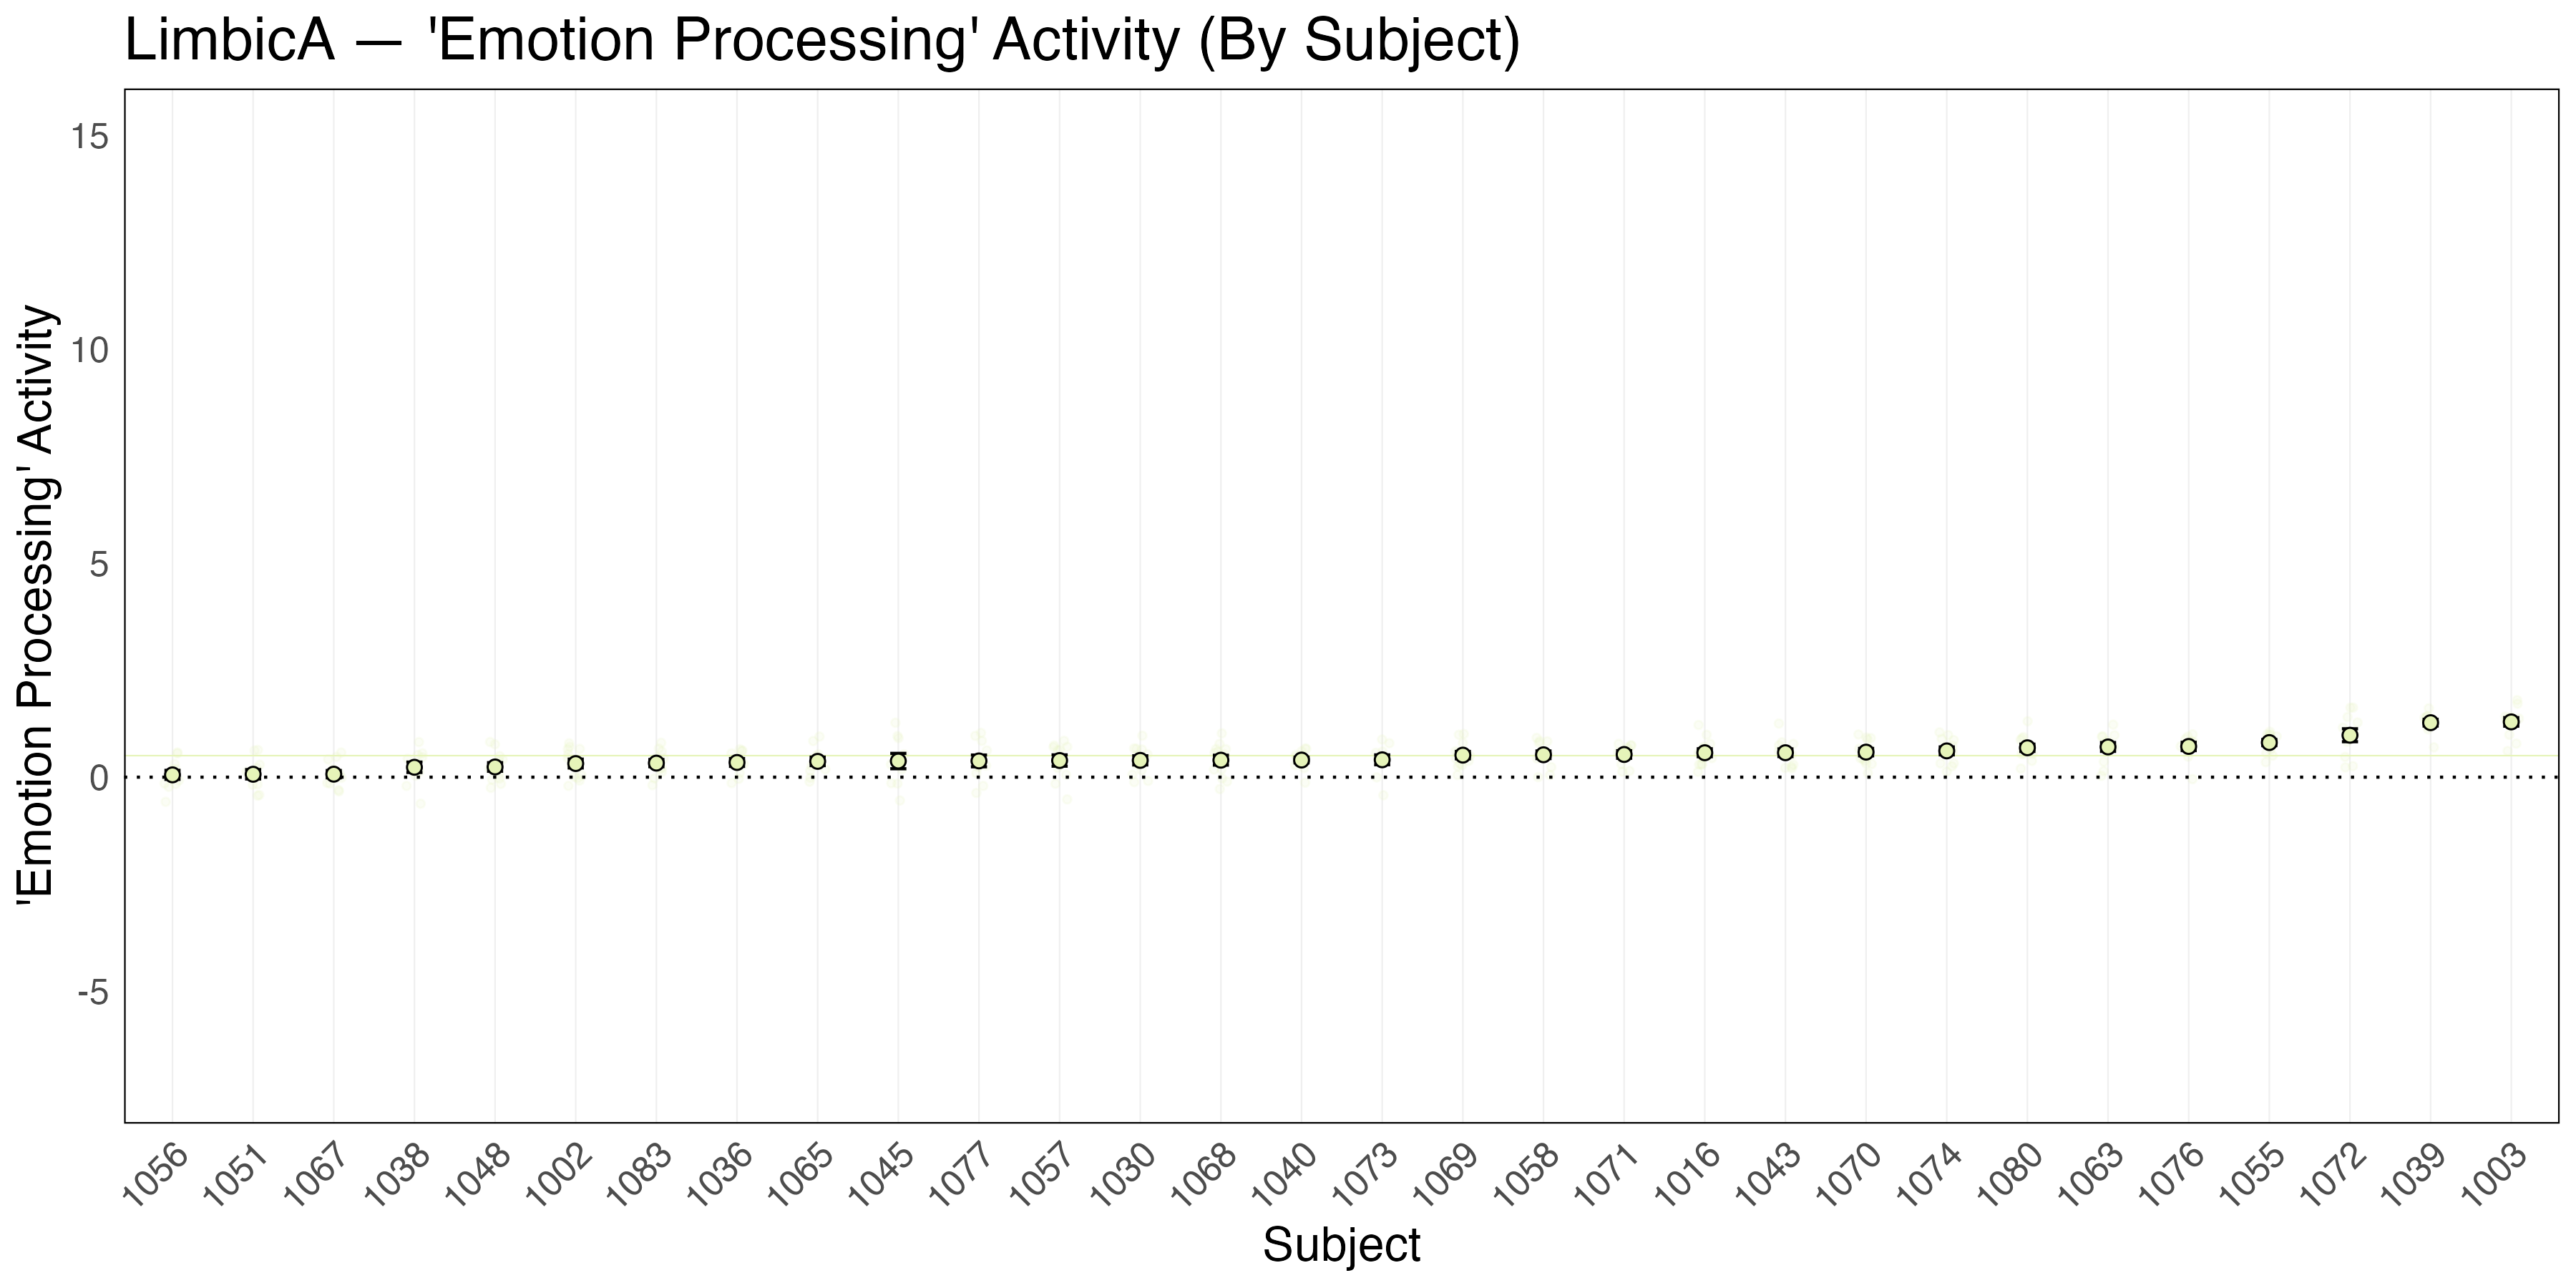
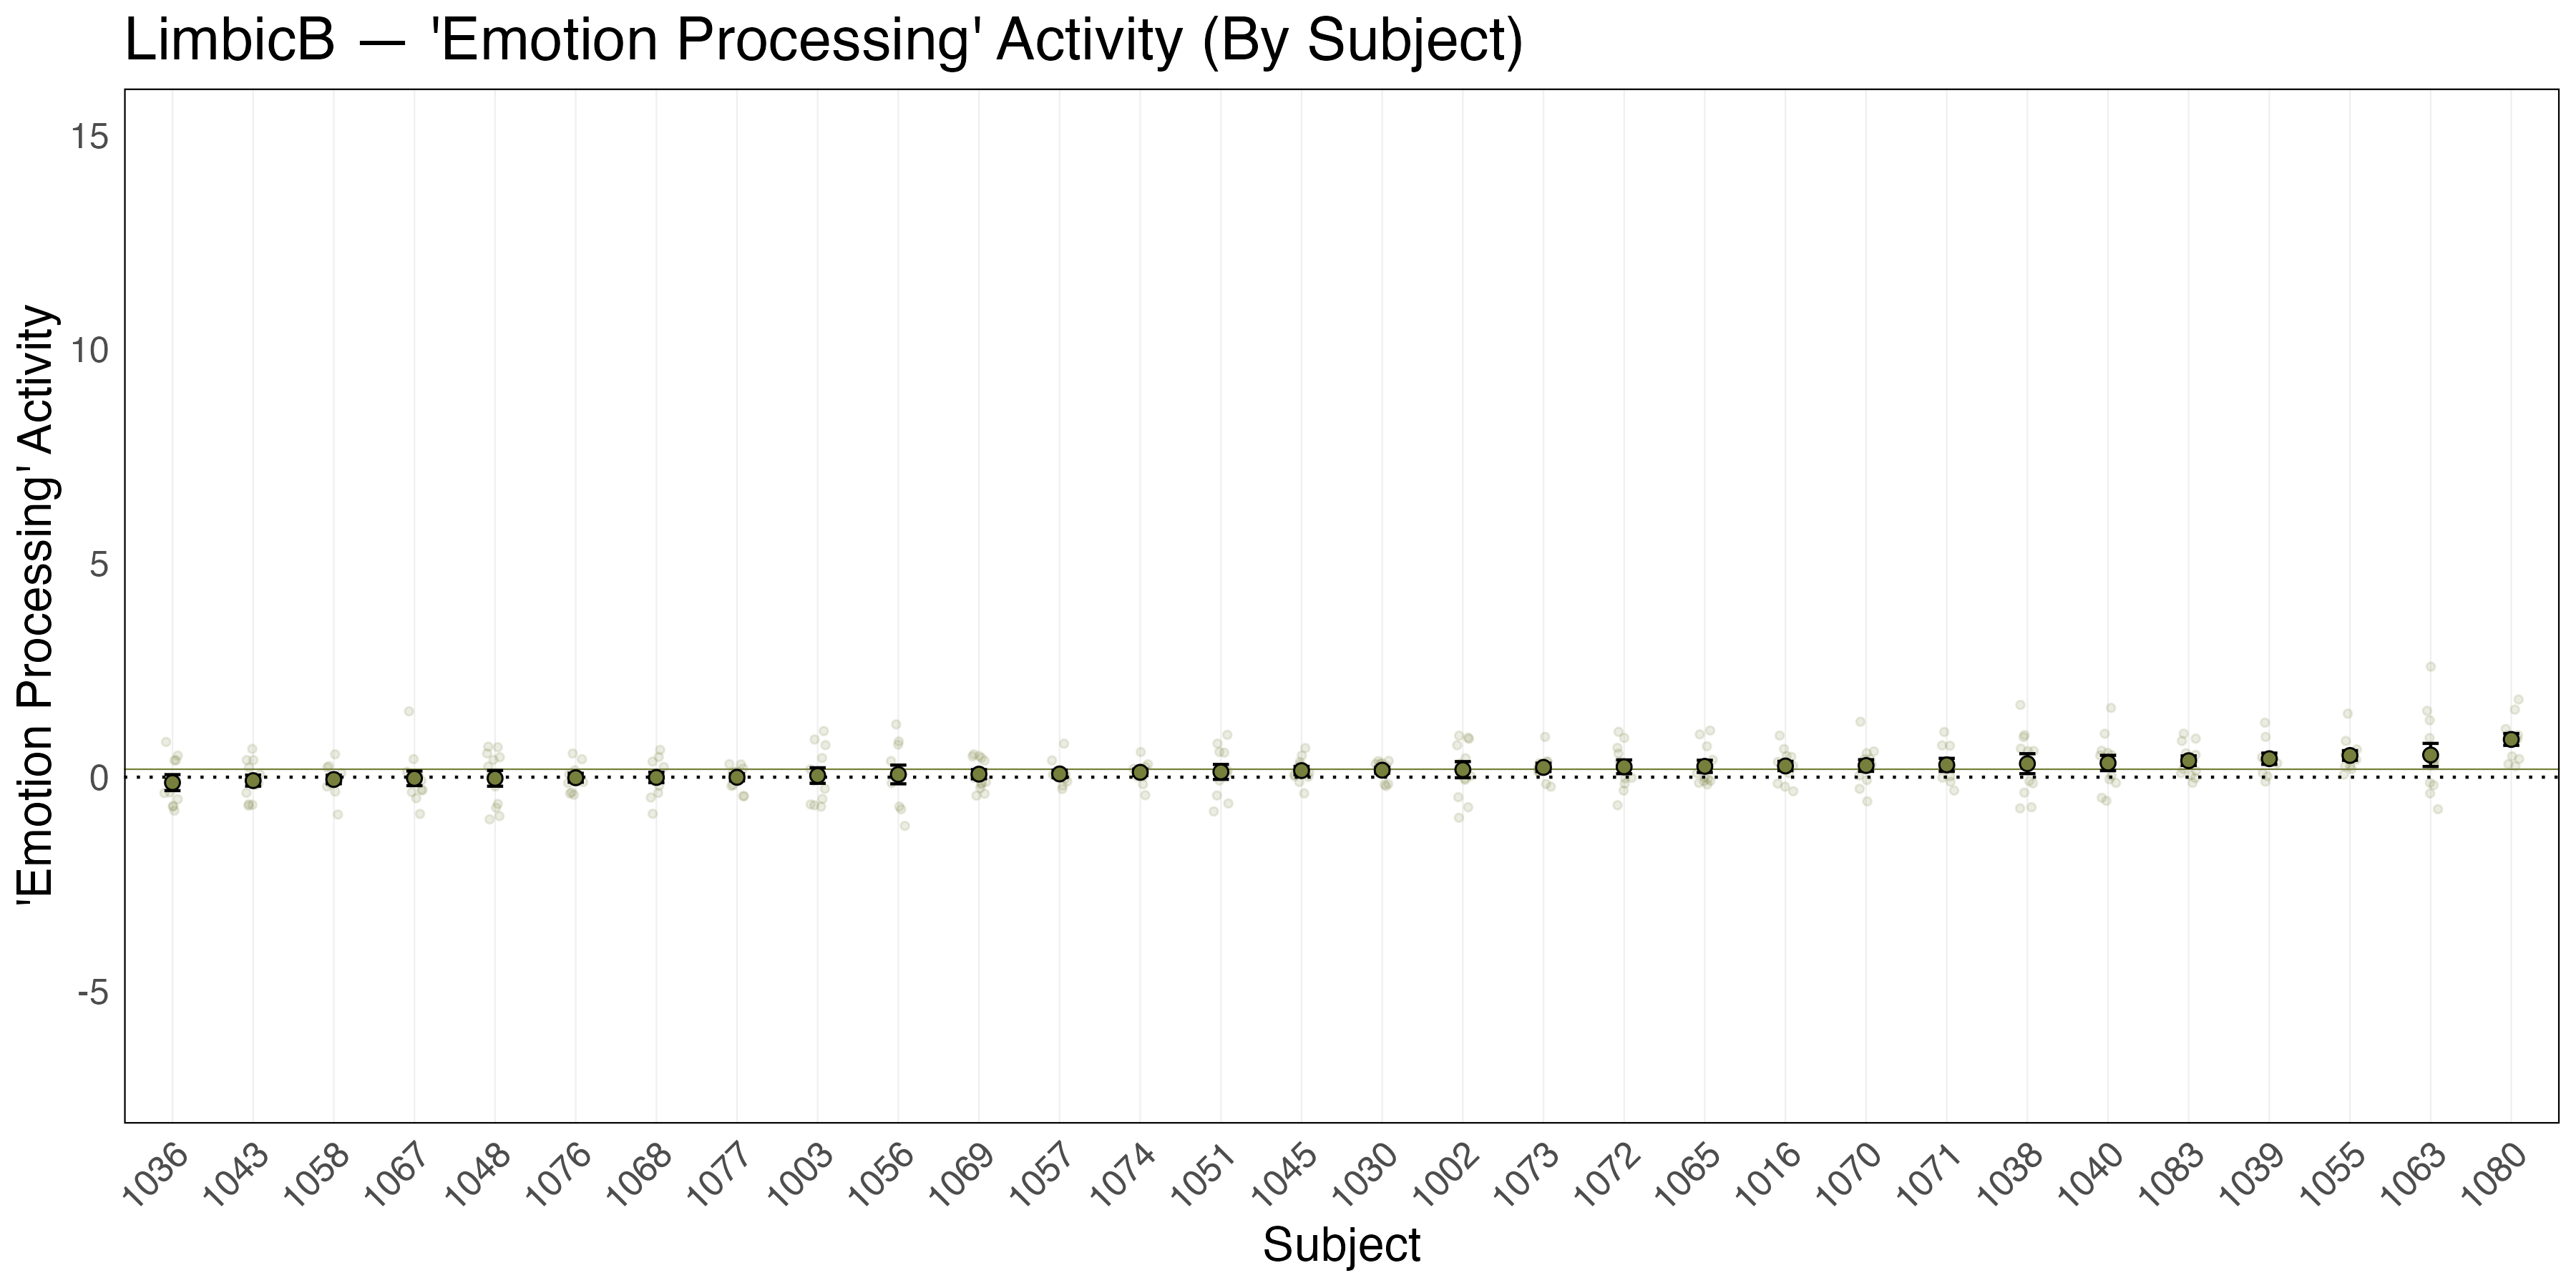
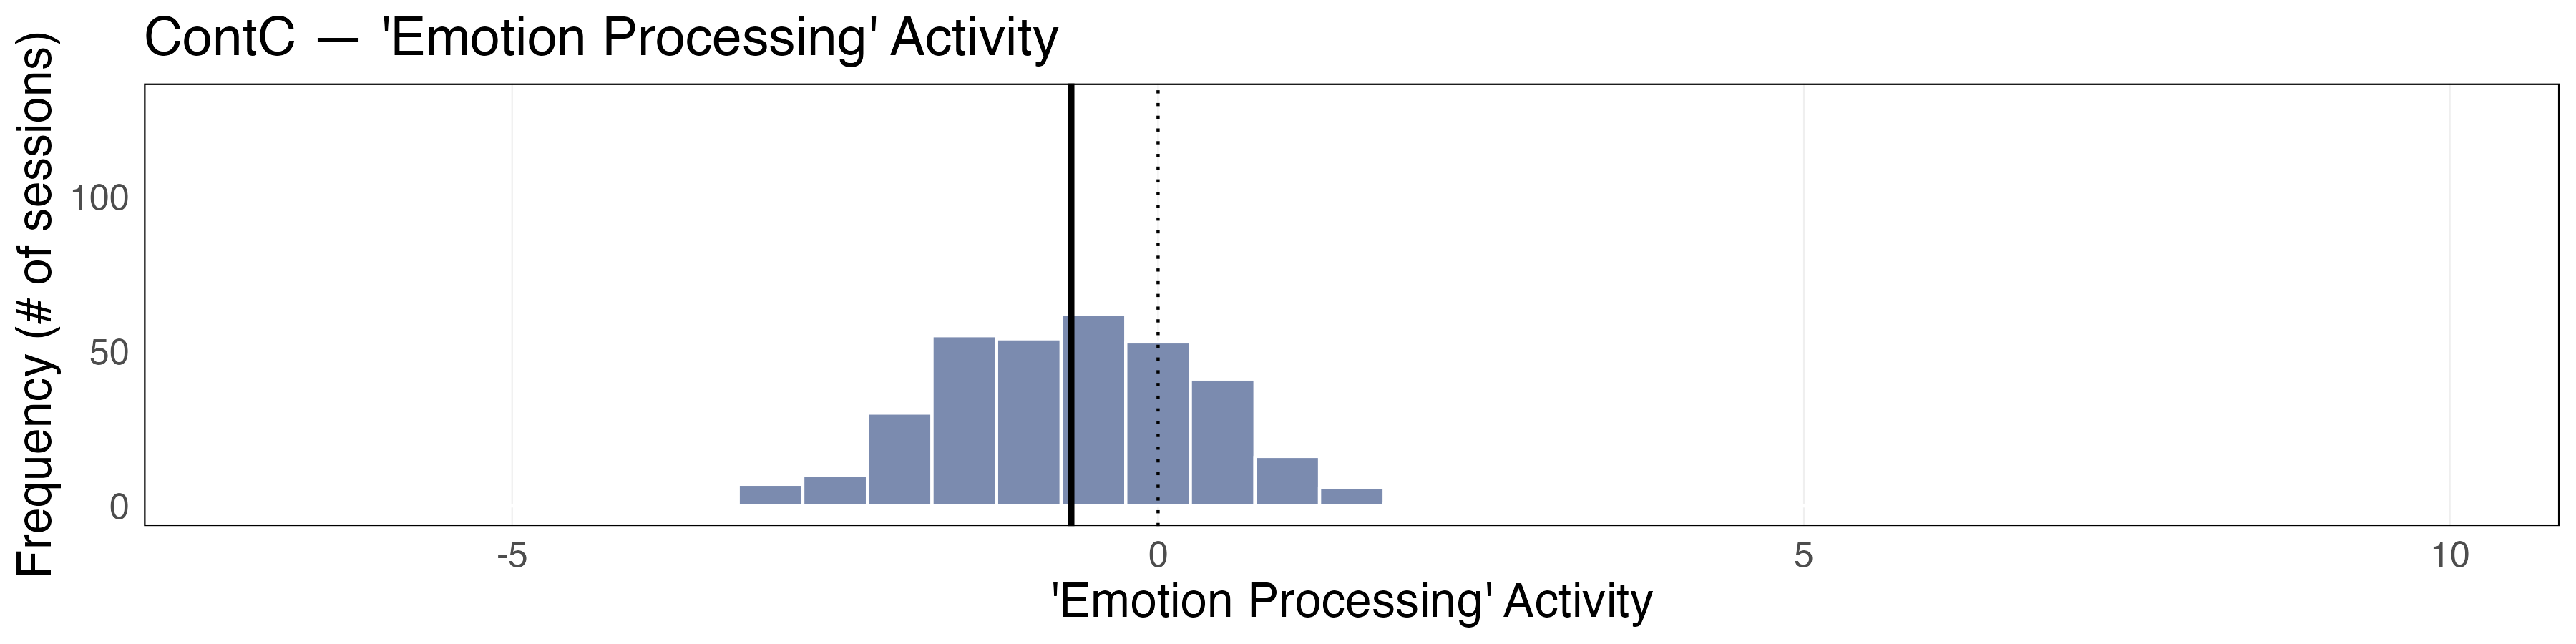
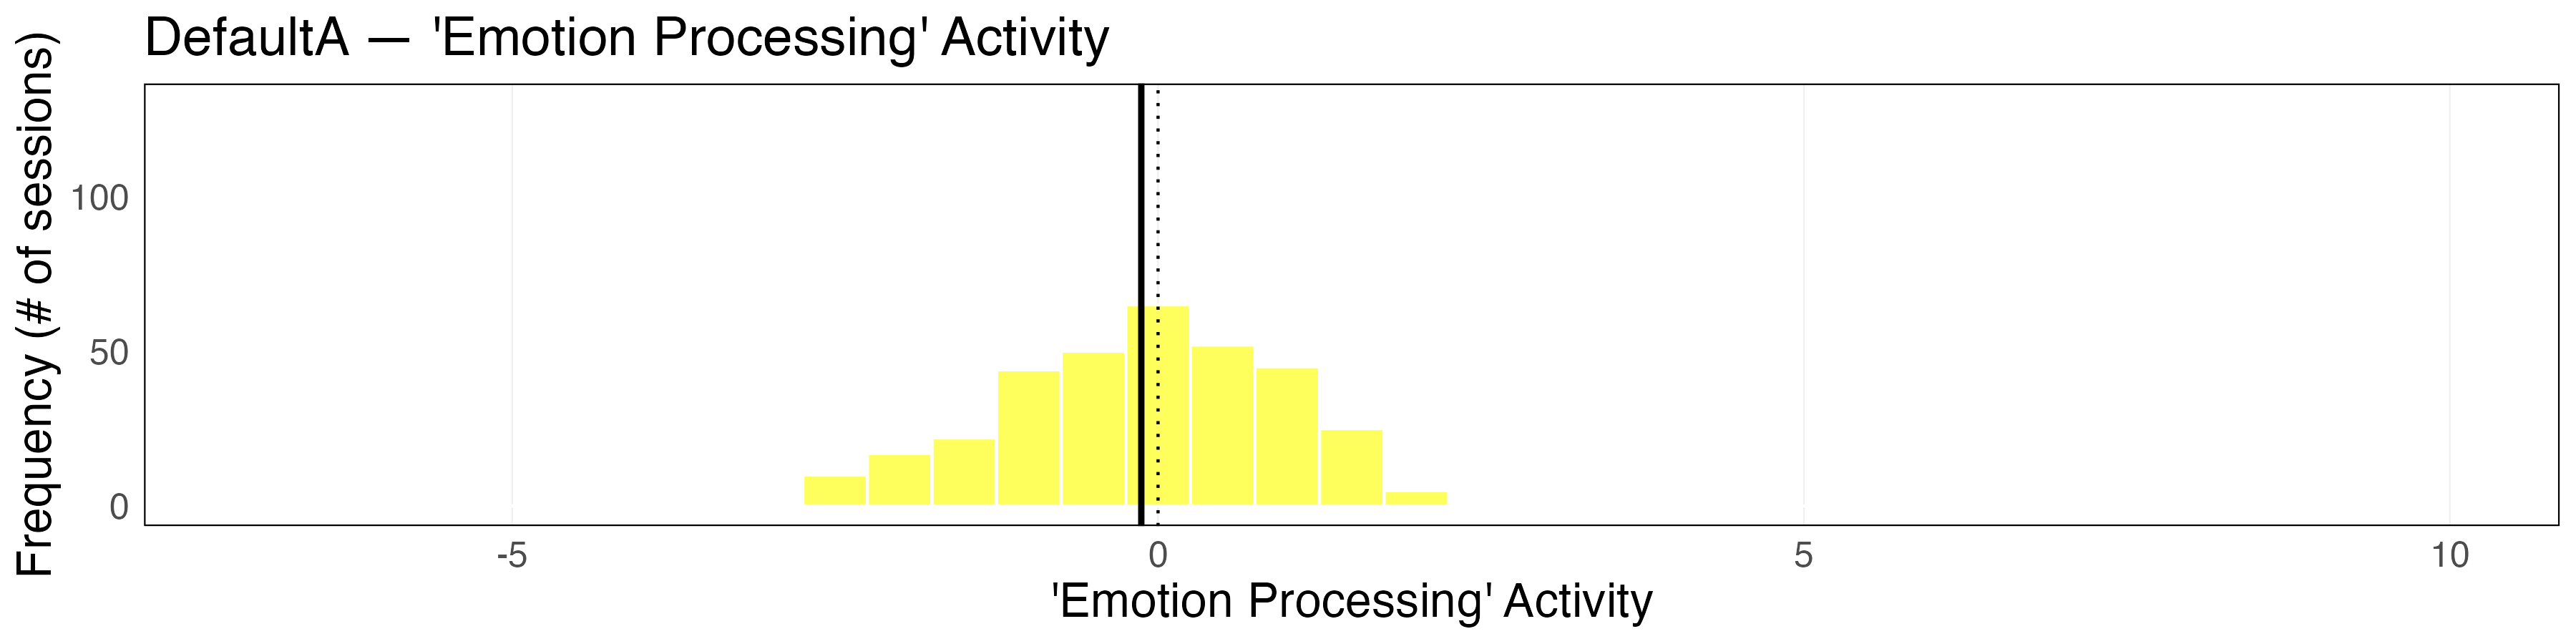
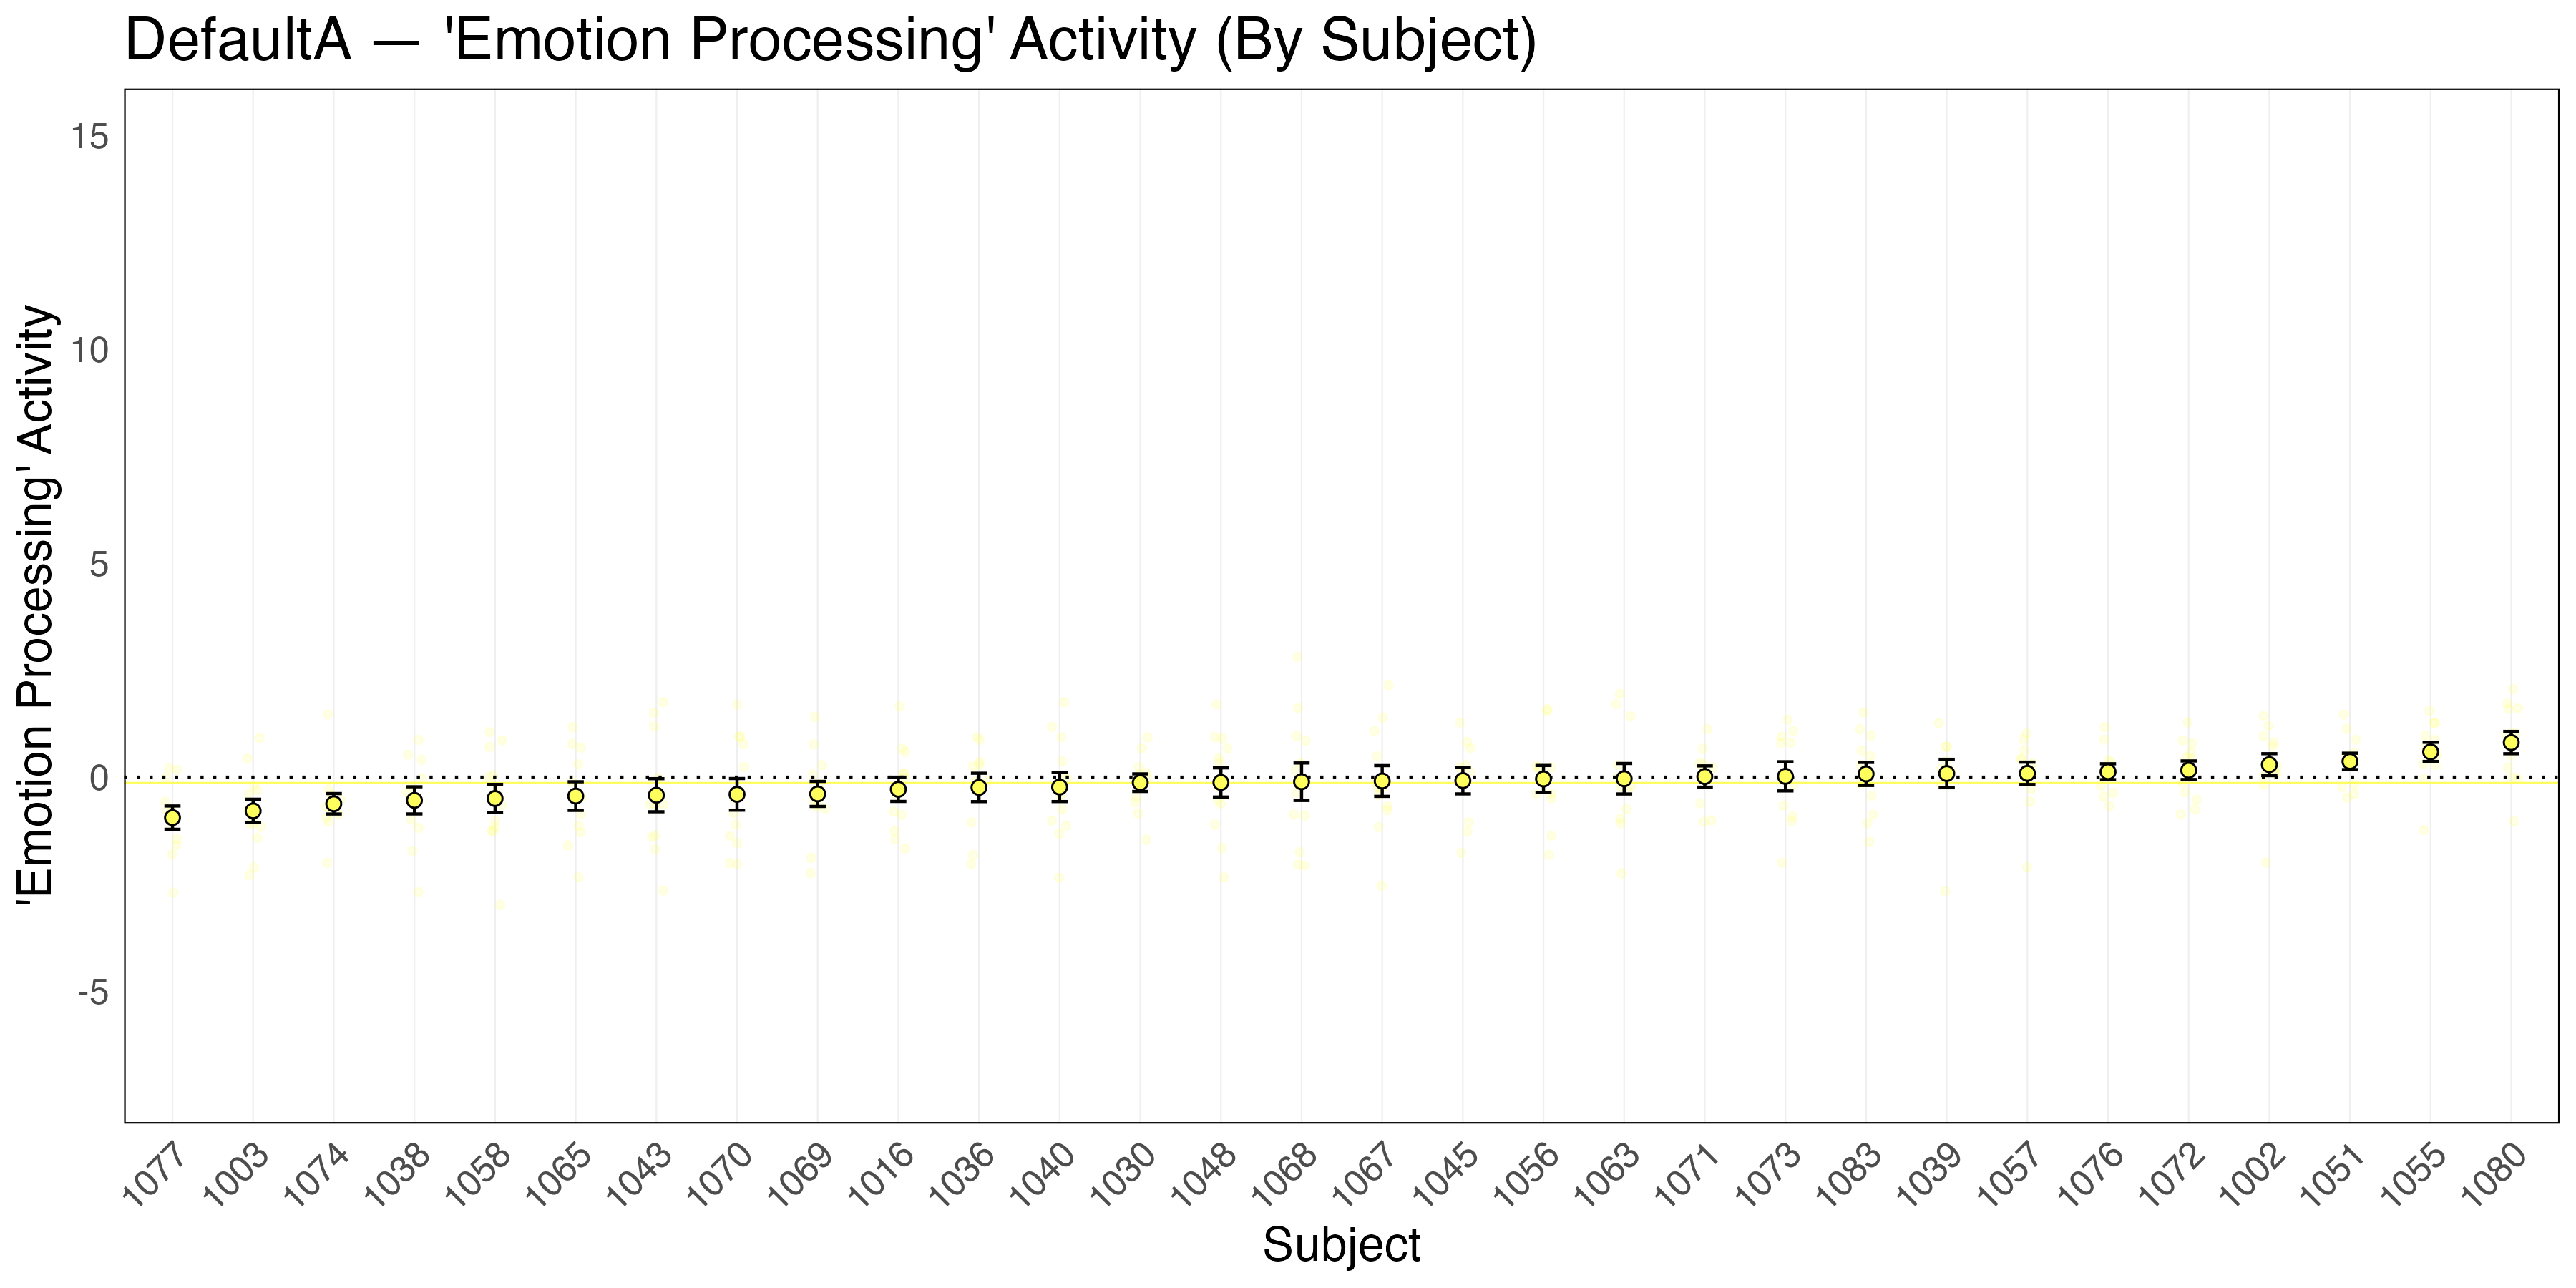
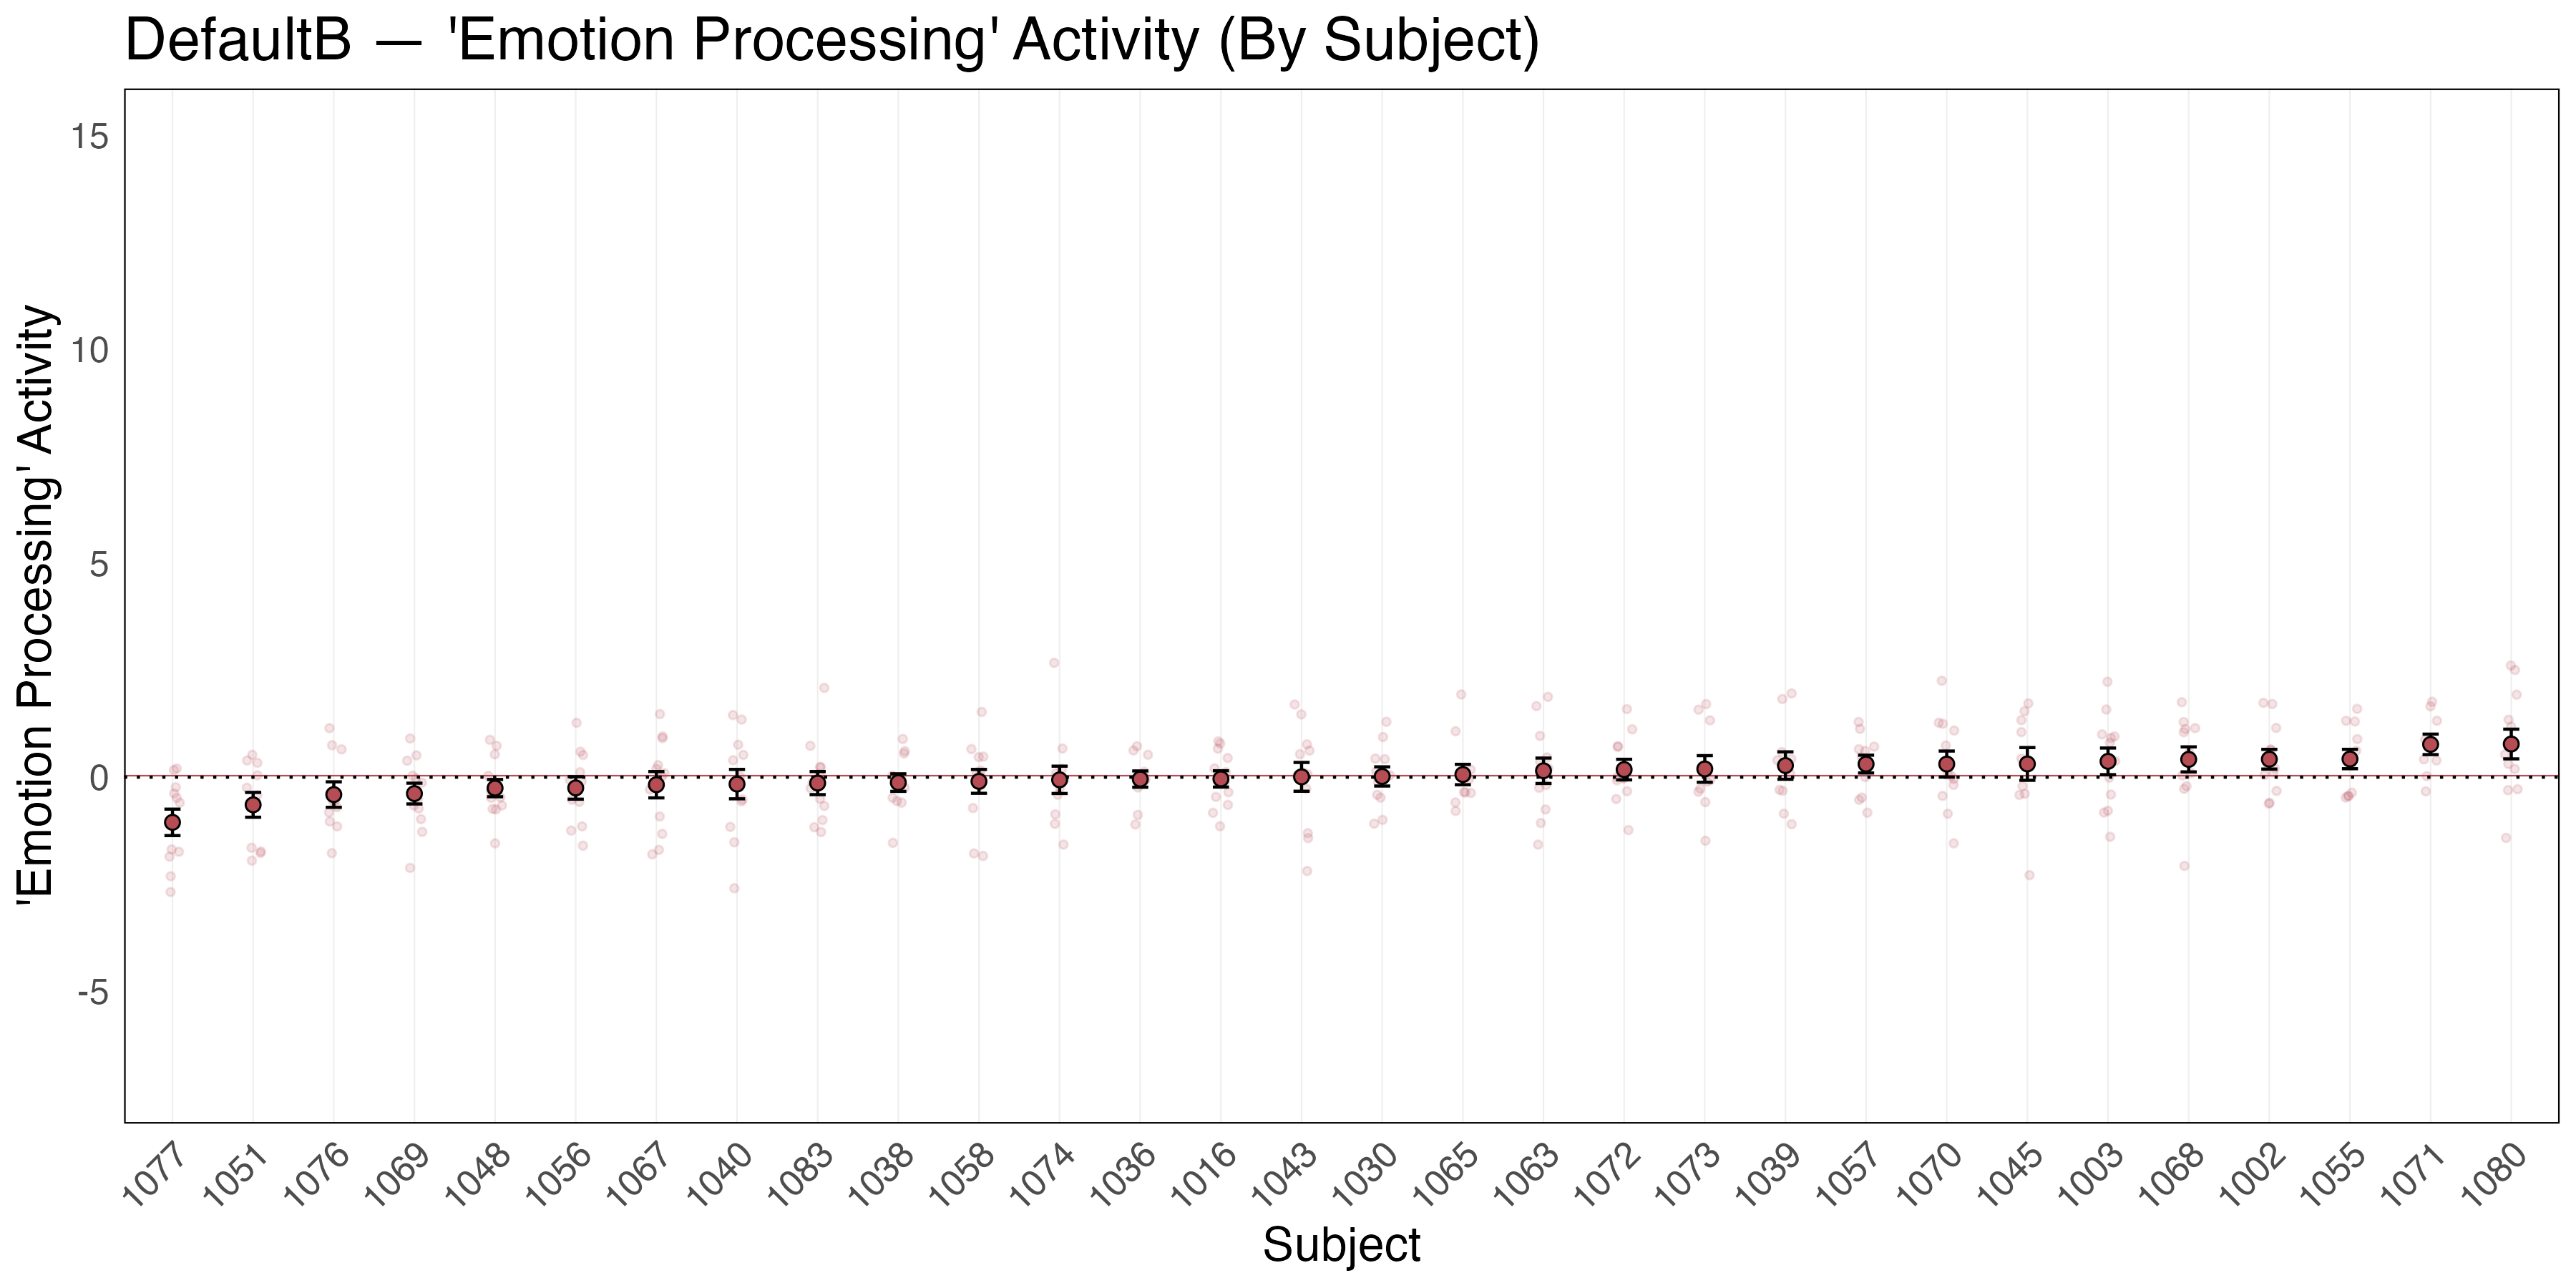
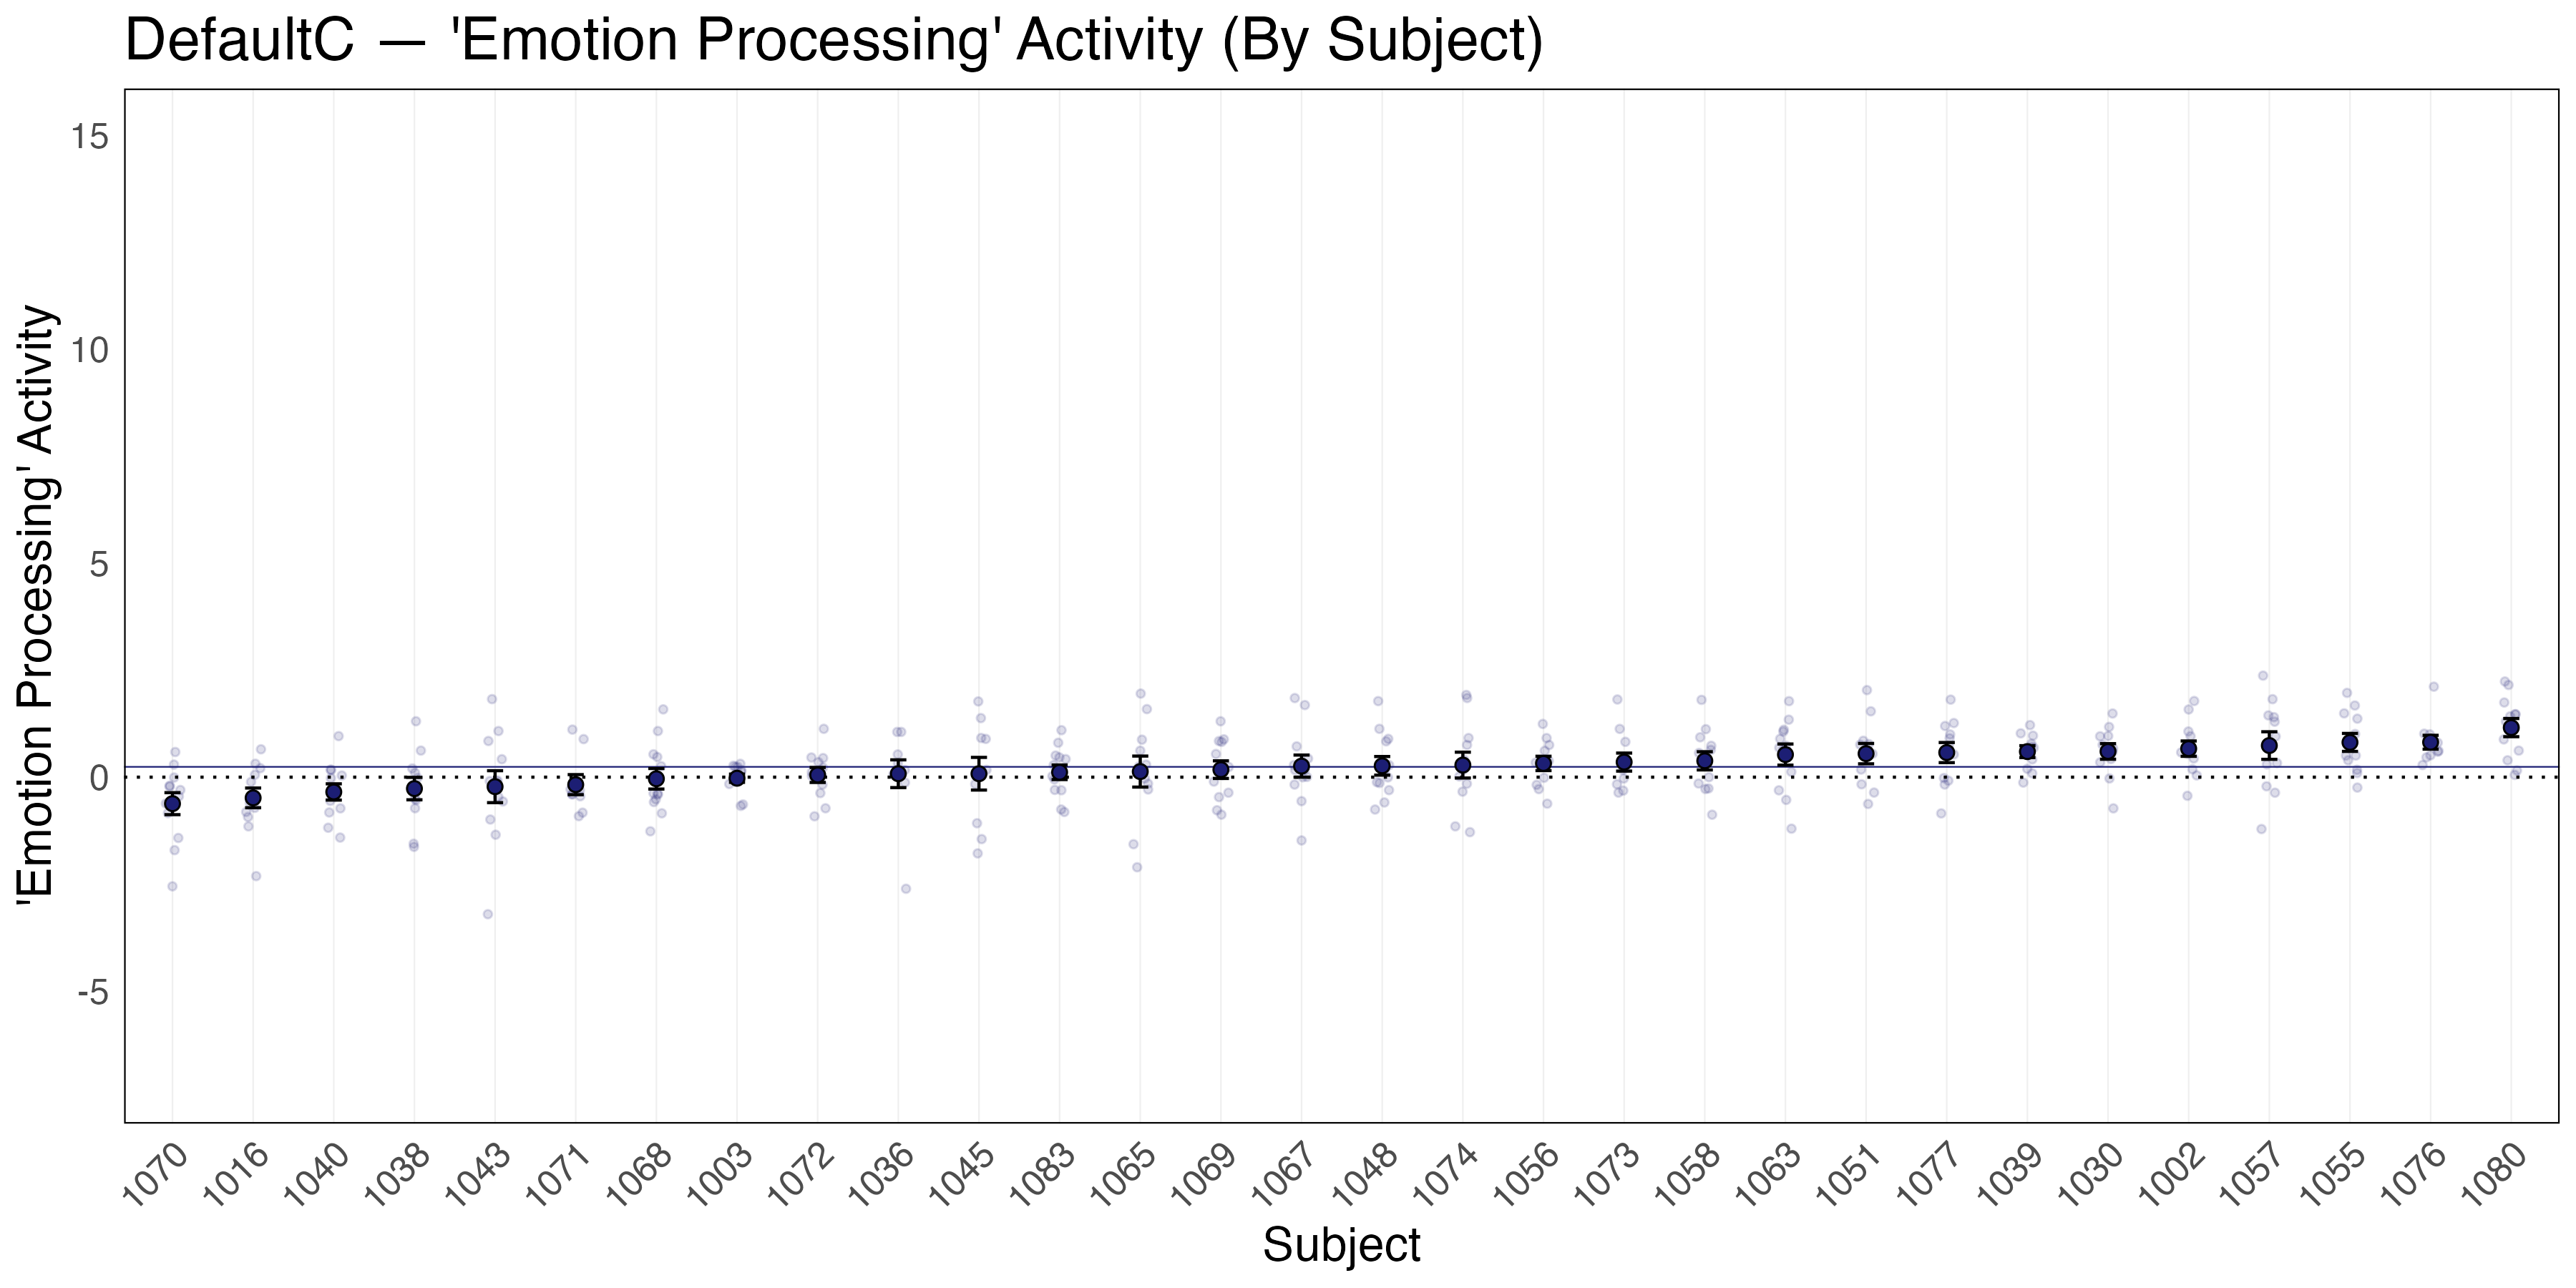
Below the ‘emotion processing’ variability plots visually decompose the between-subject and within-subject variability observed within each boundary. These plots depict the sources of variance (between and within person) that lead to activity with poor ICCs in many of the boundaries examined, namely that there is as much or more within-person variance in activity during the Faces > Shapes contrast within the boundaries as there is between-person variance.
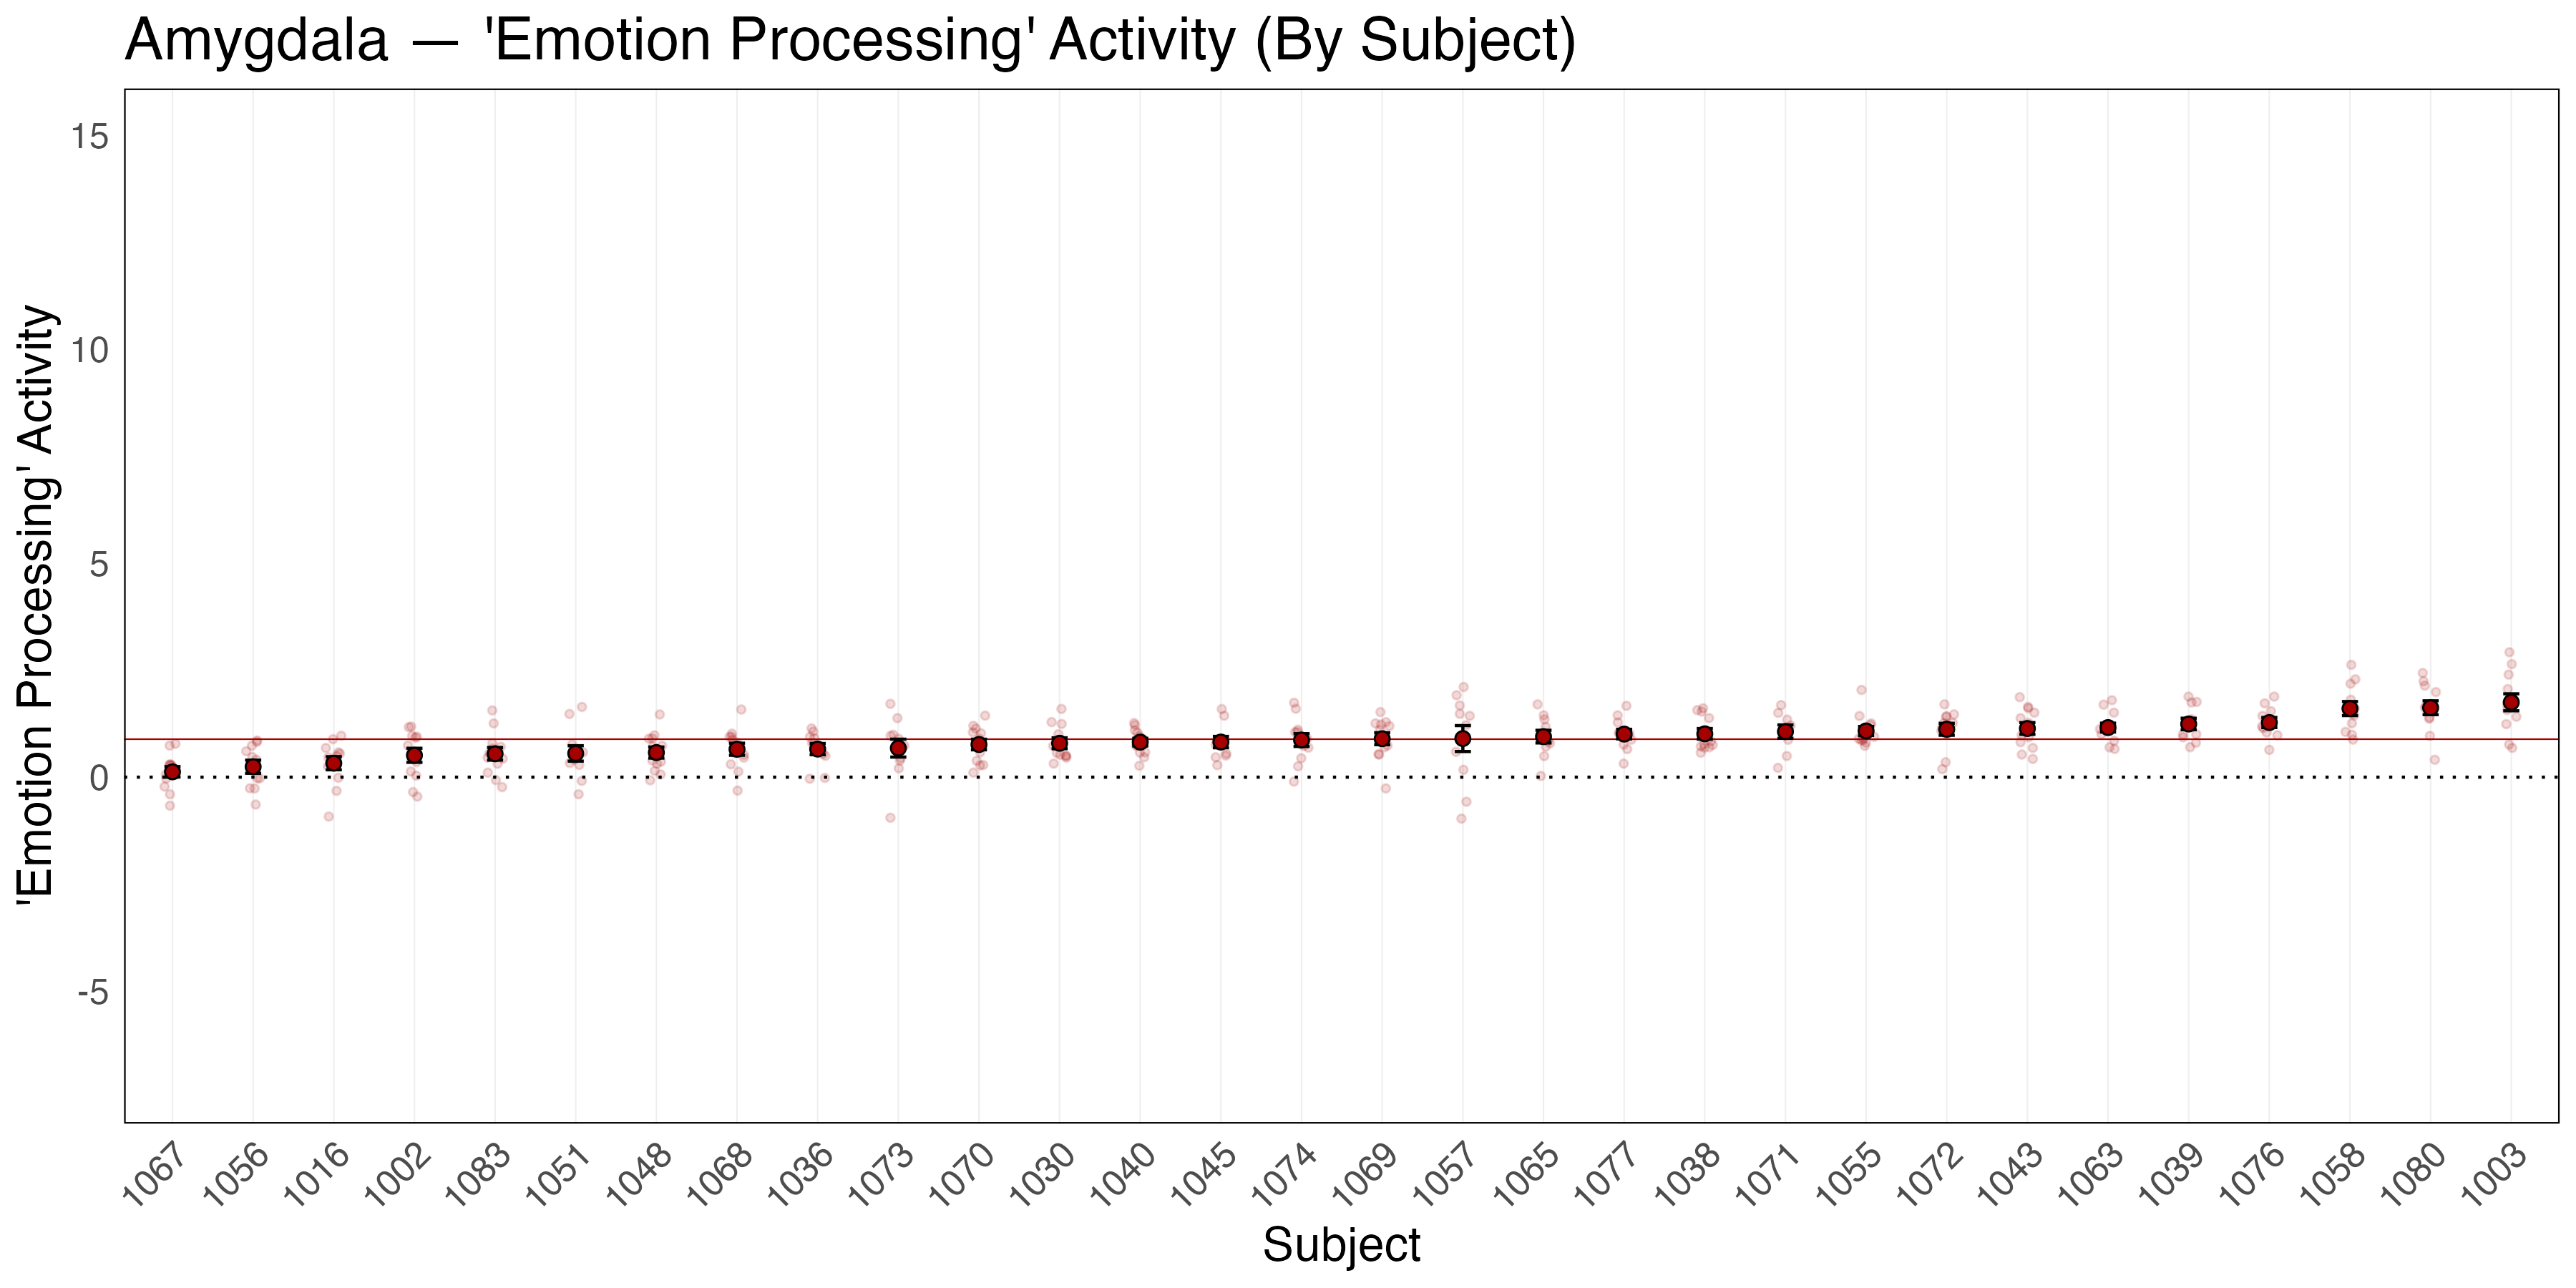
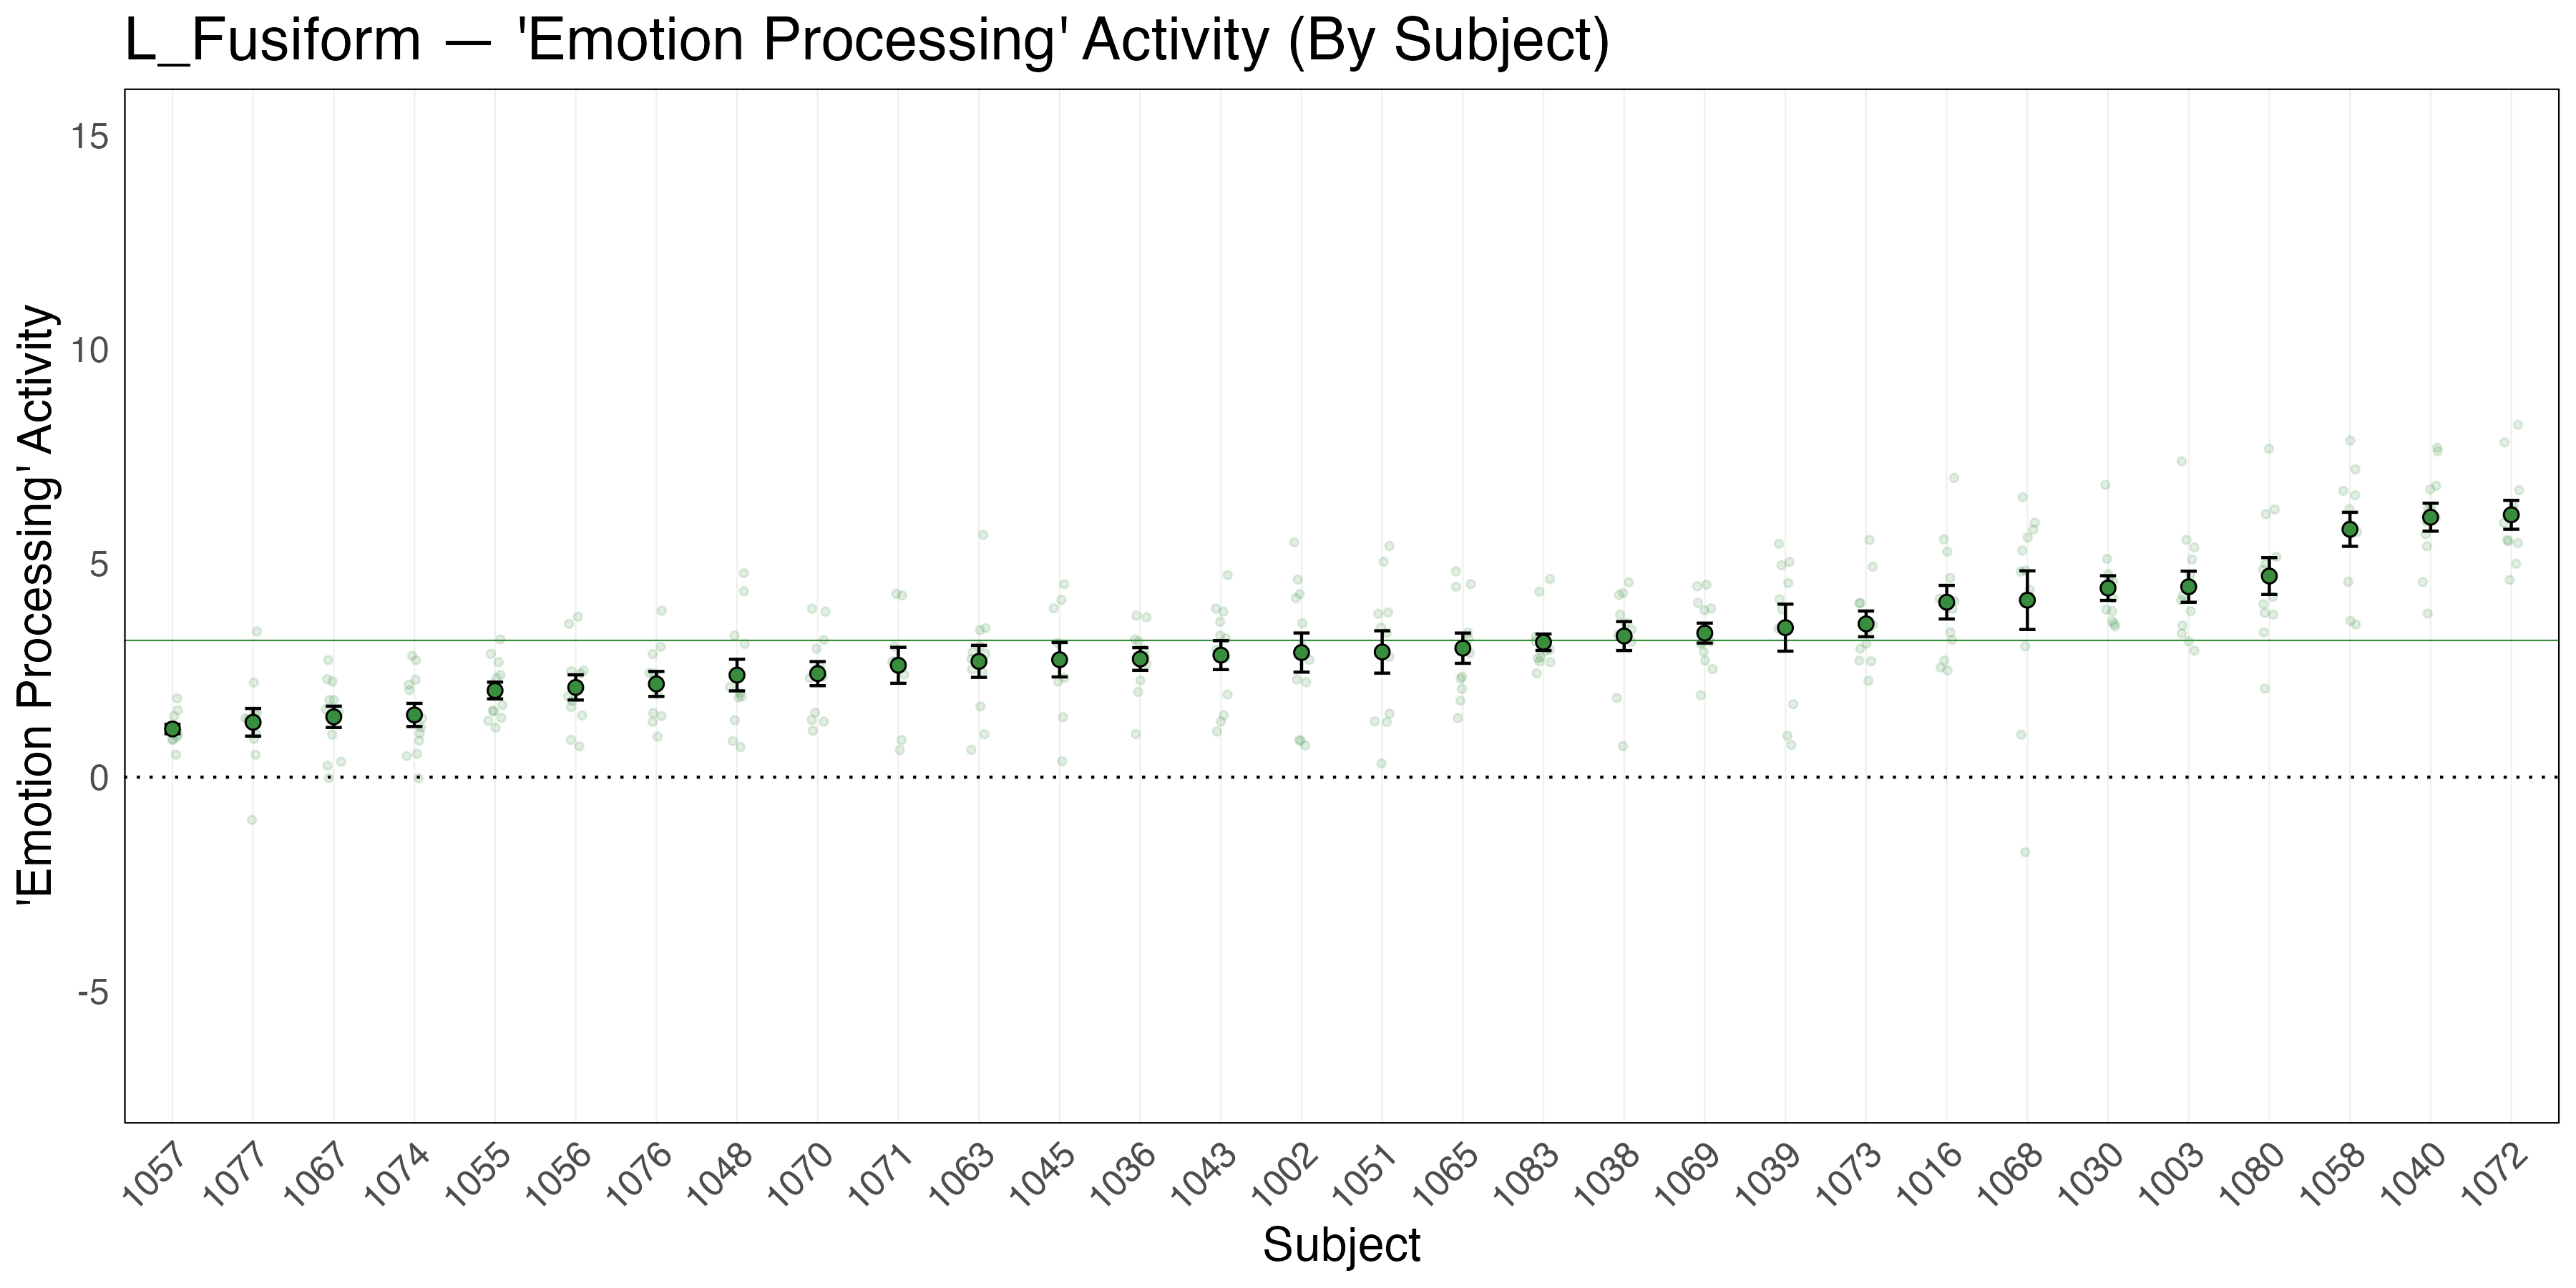
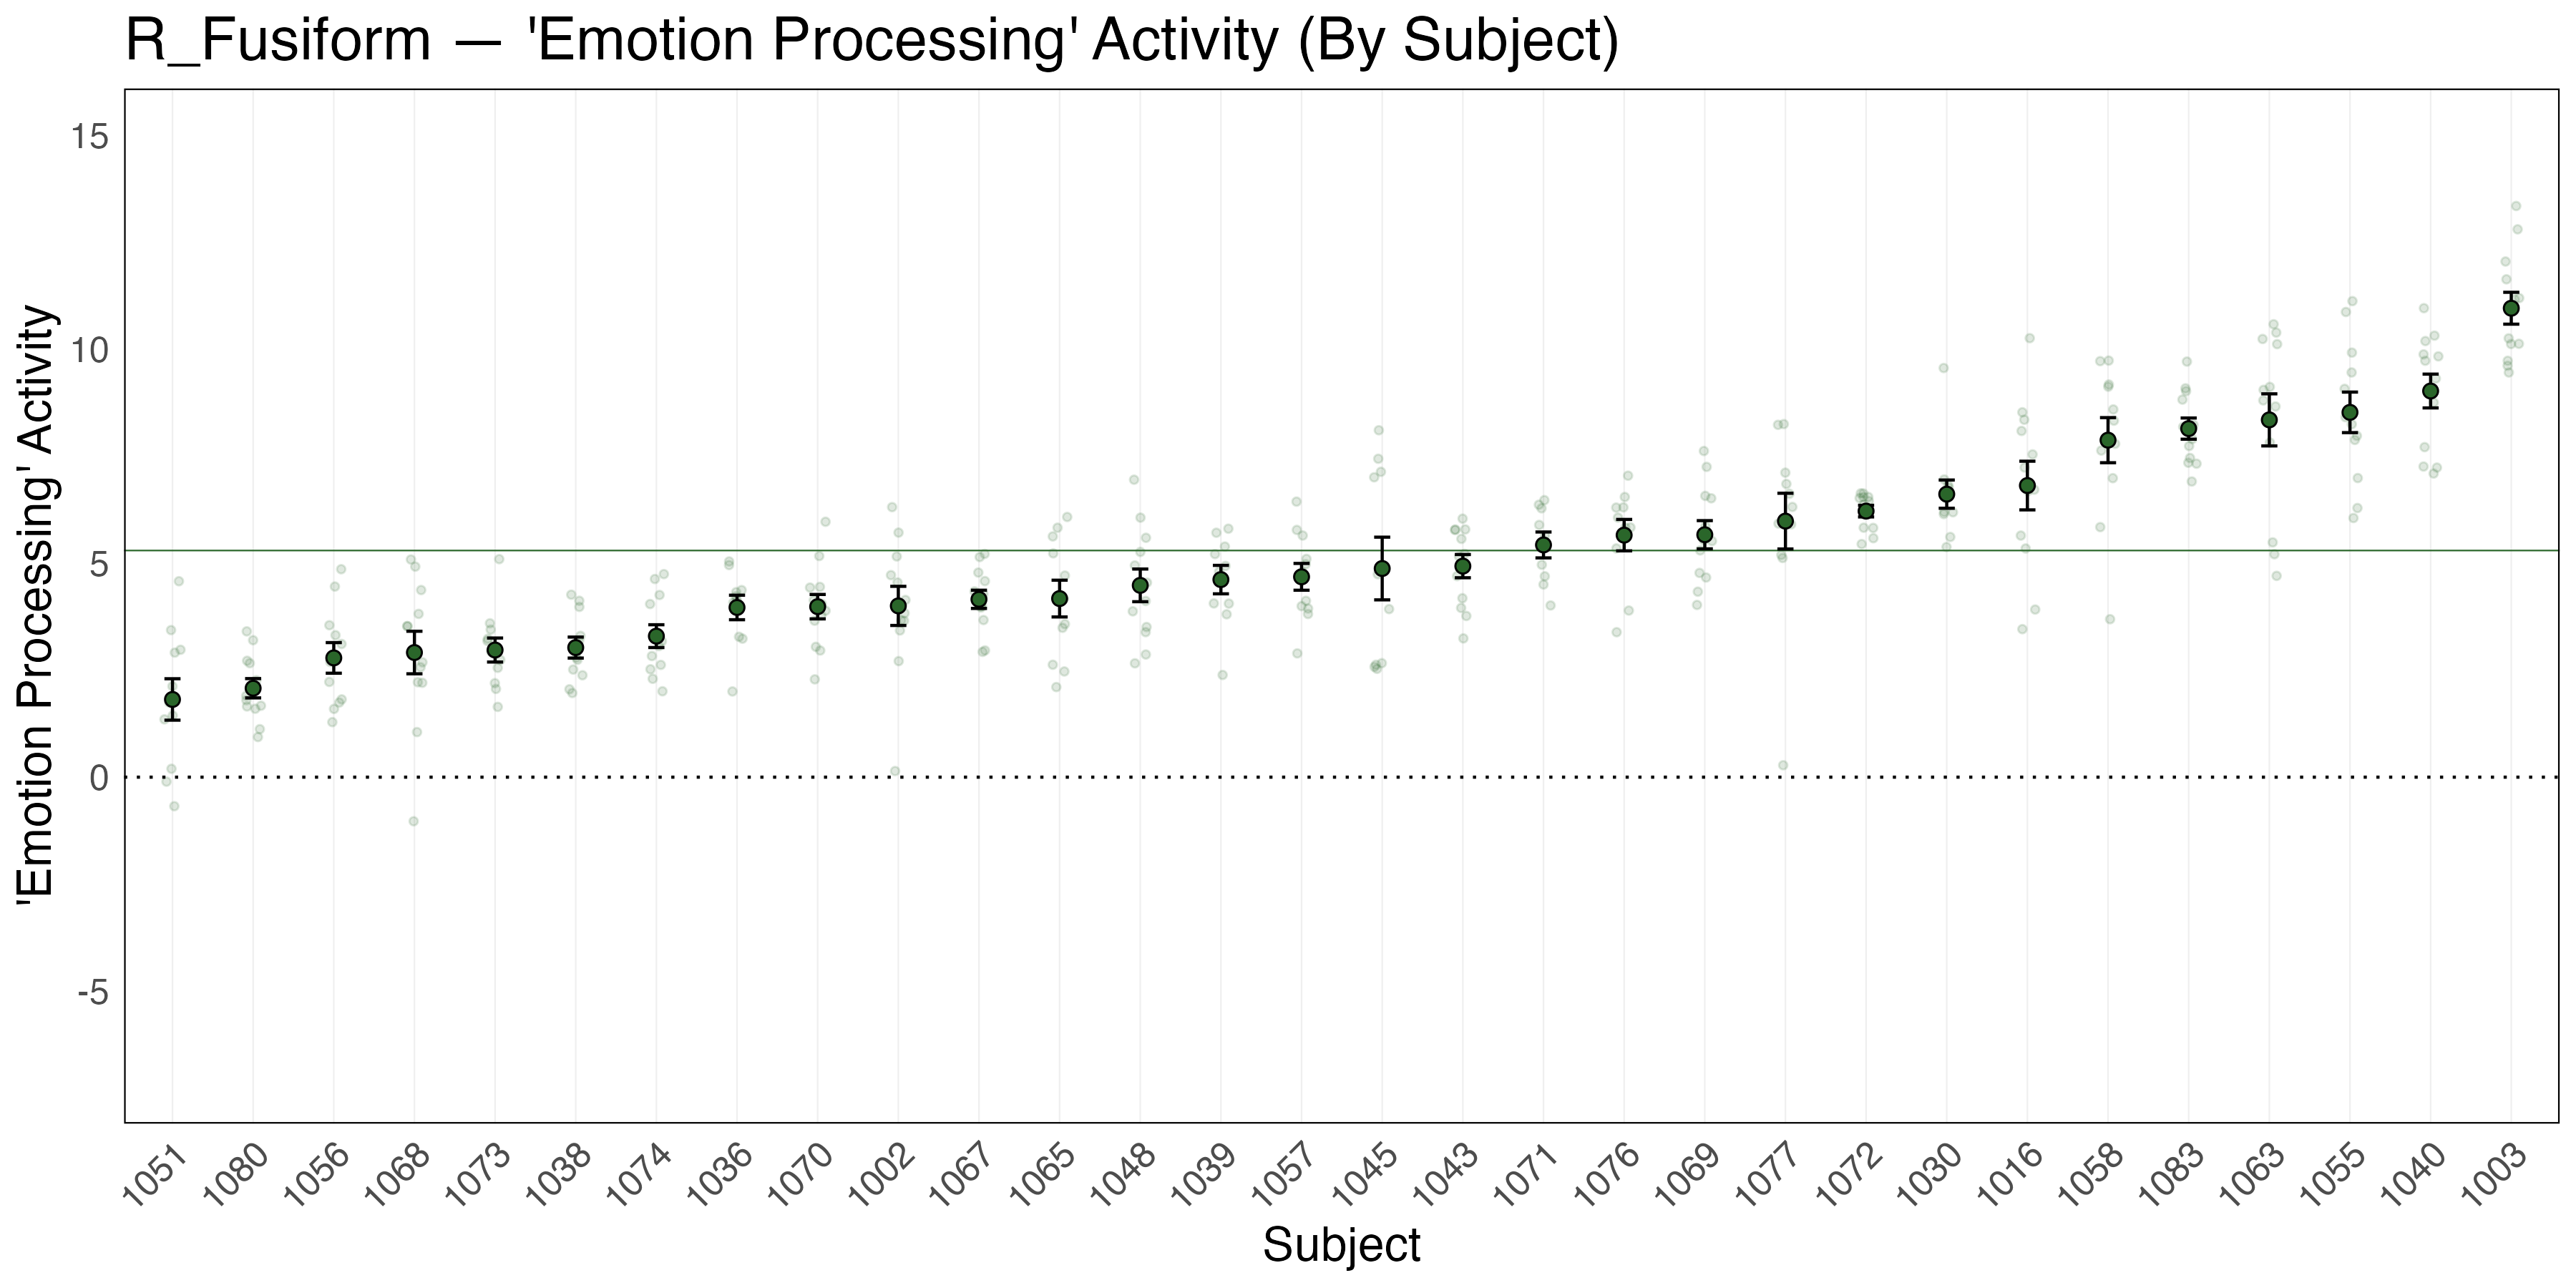
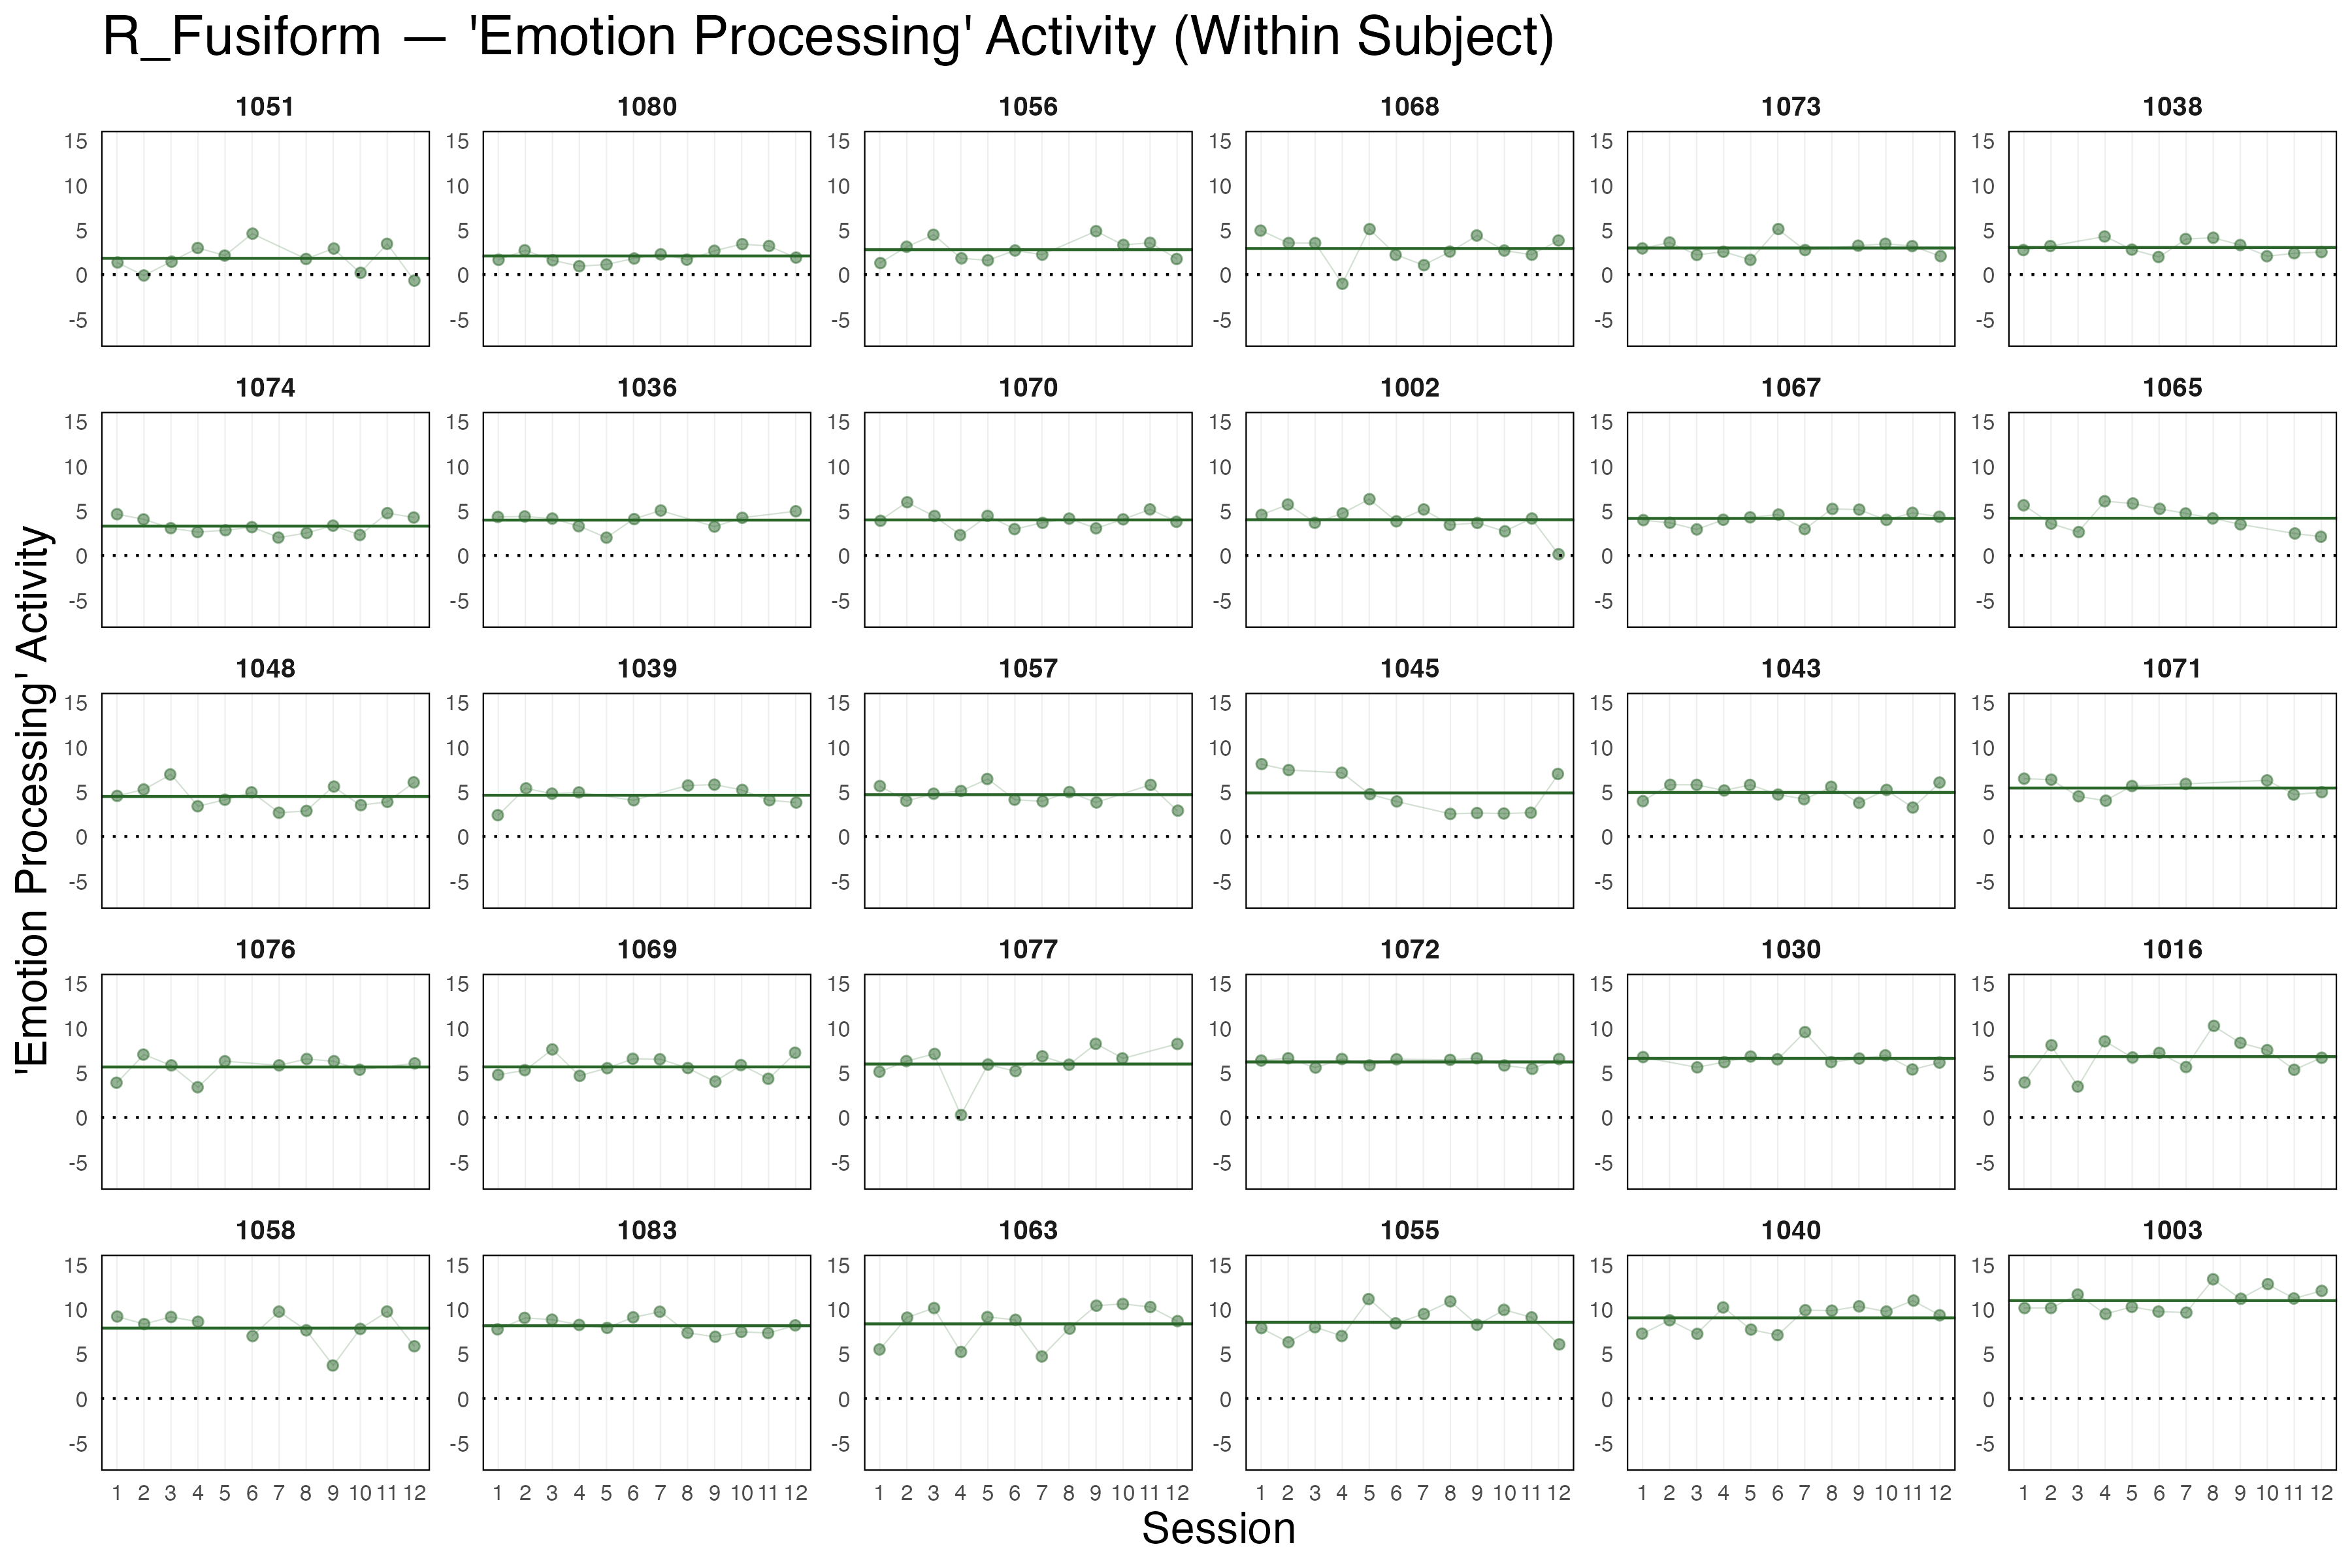
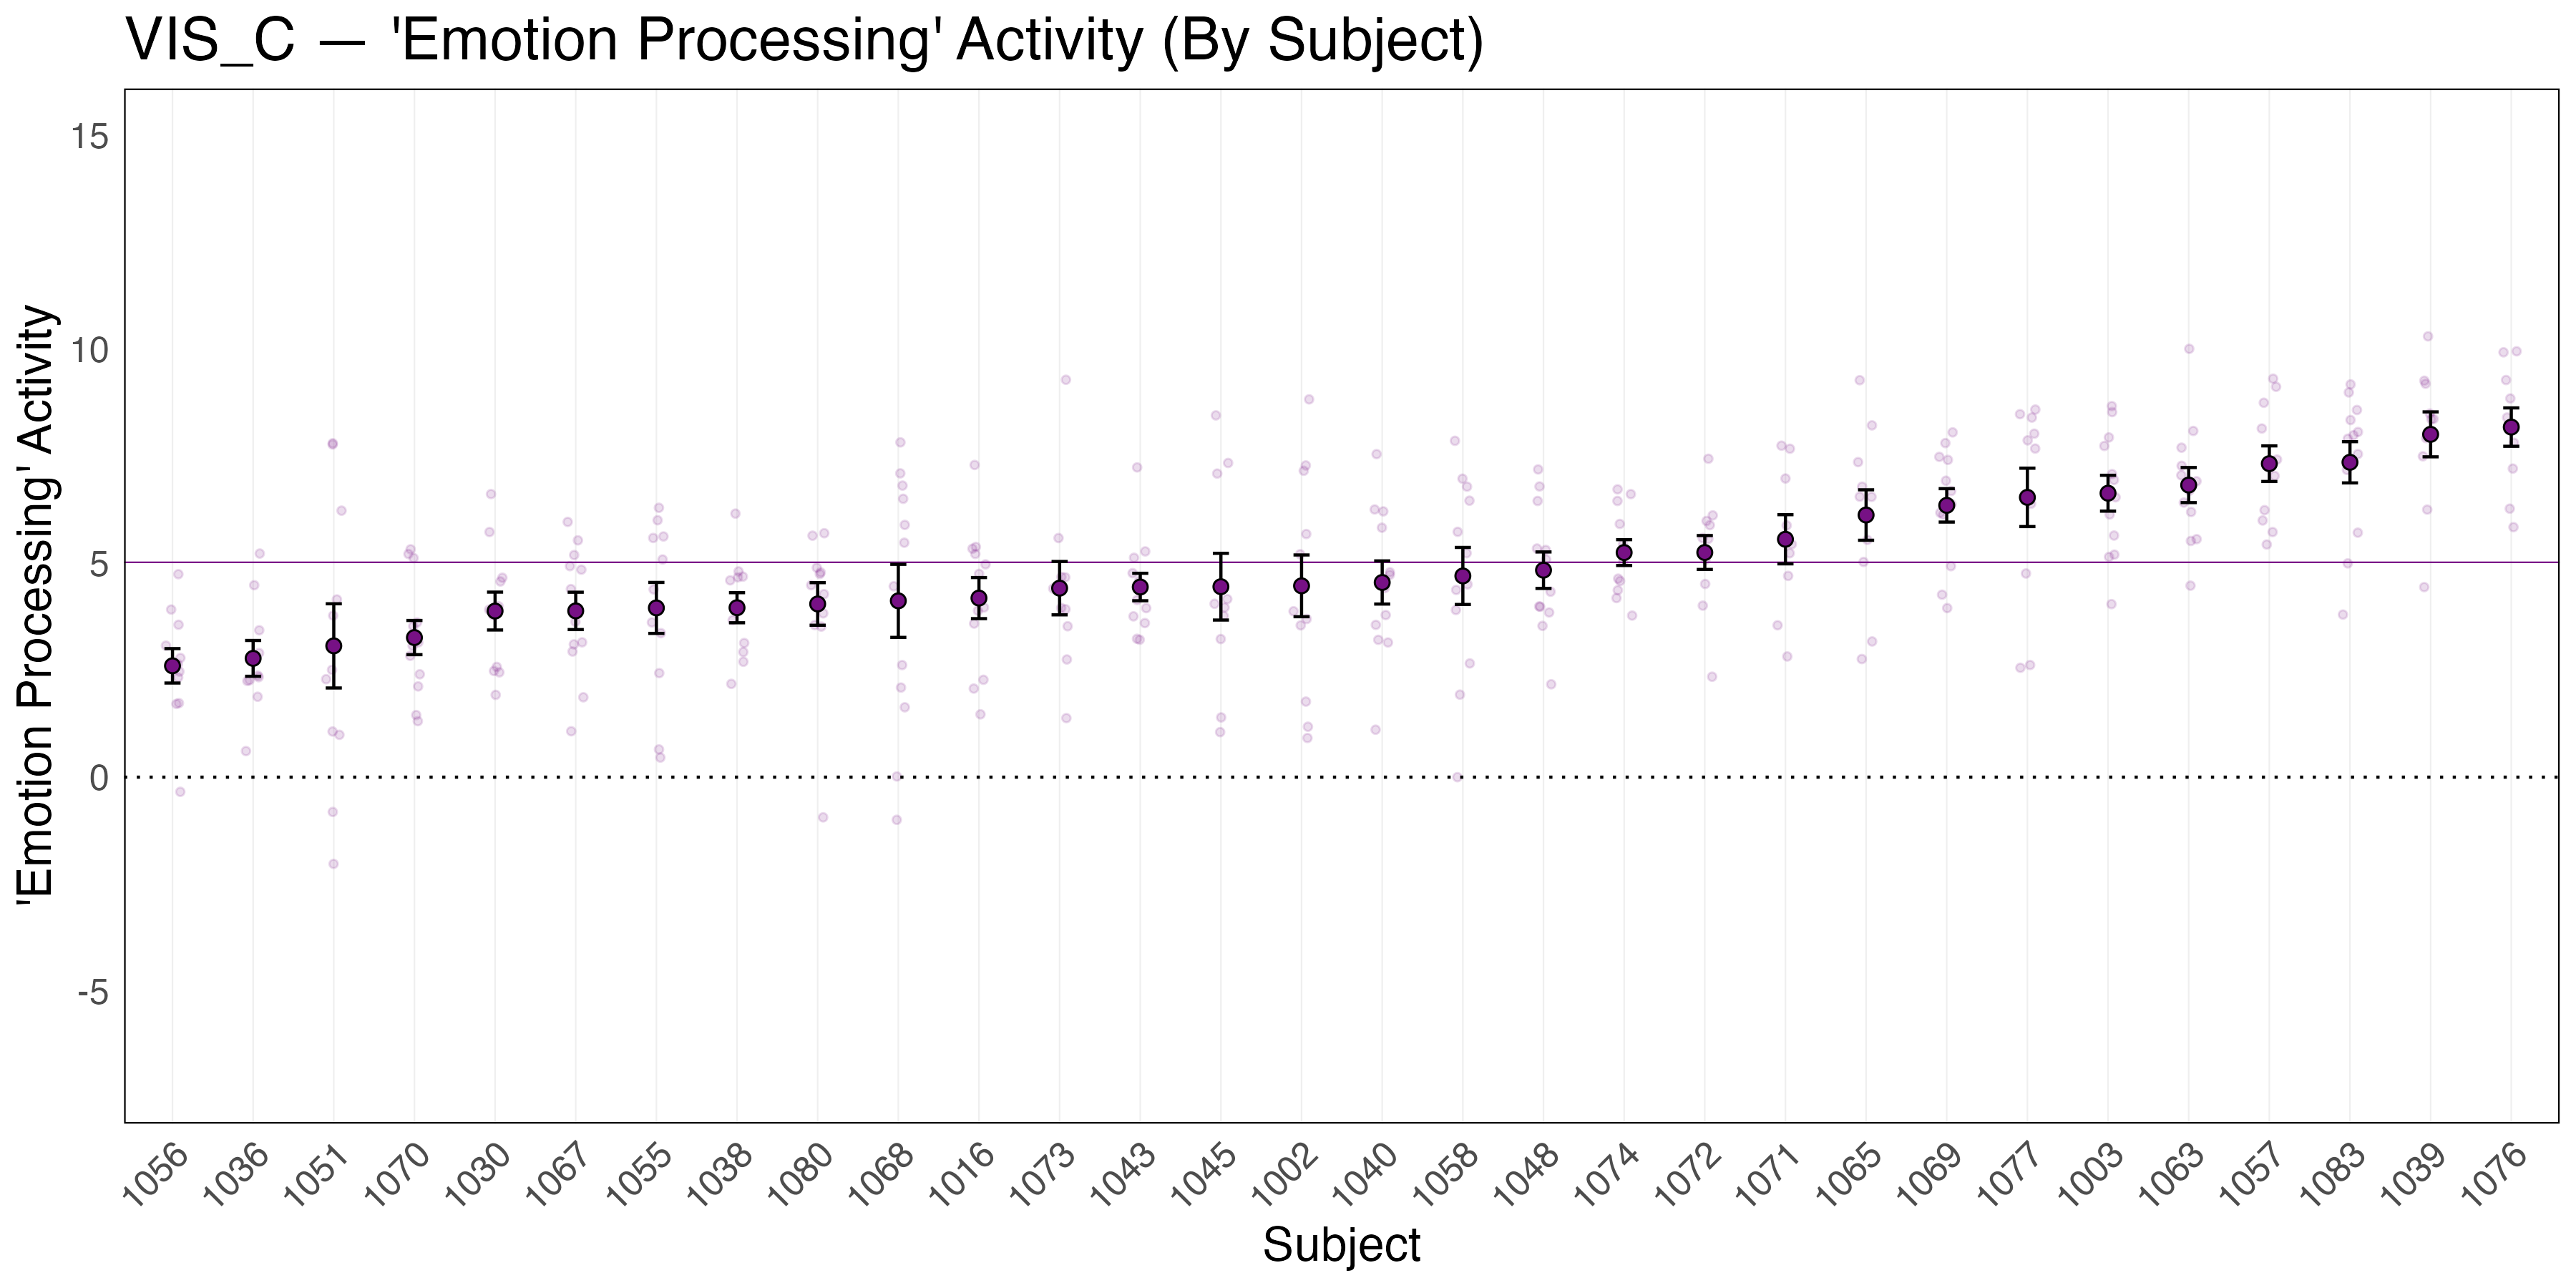
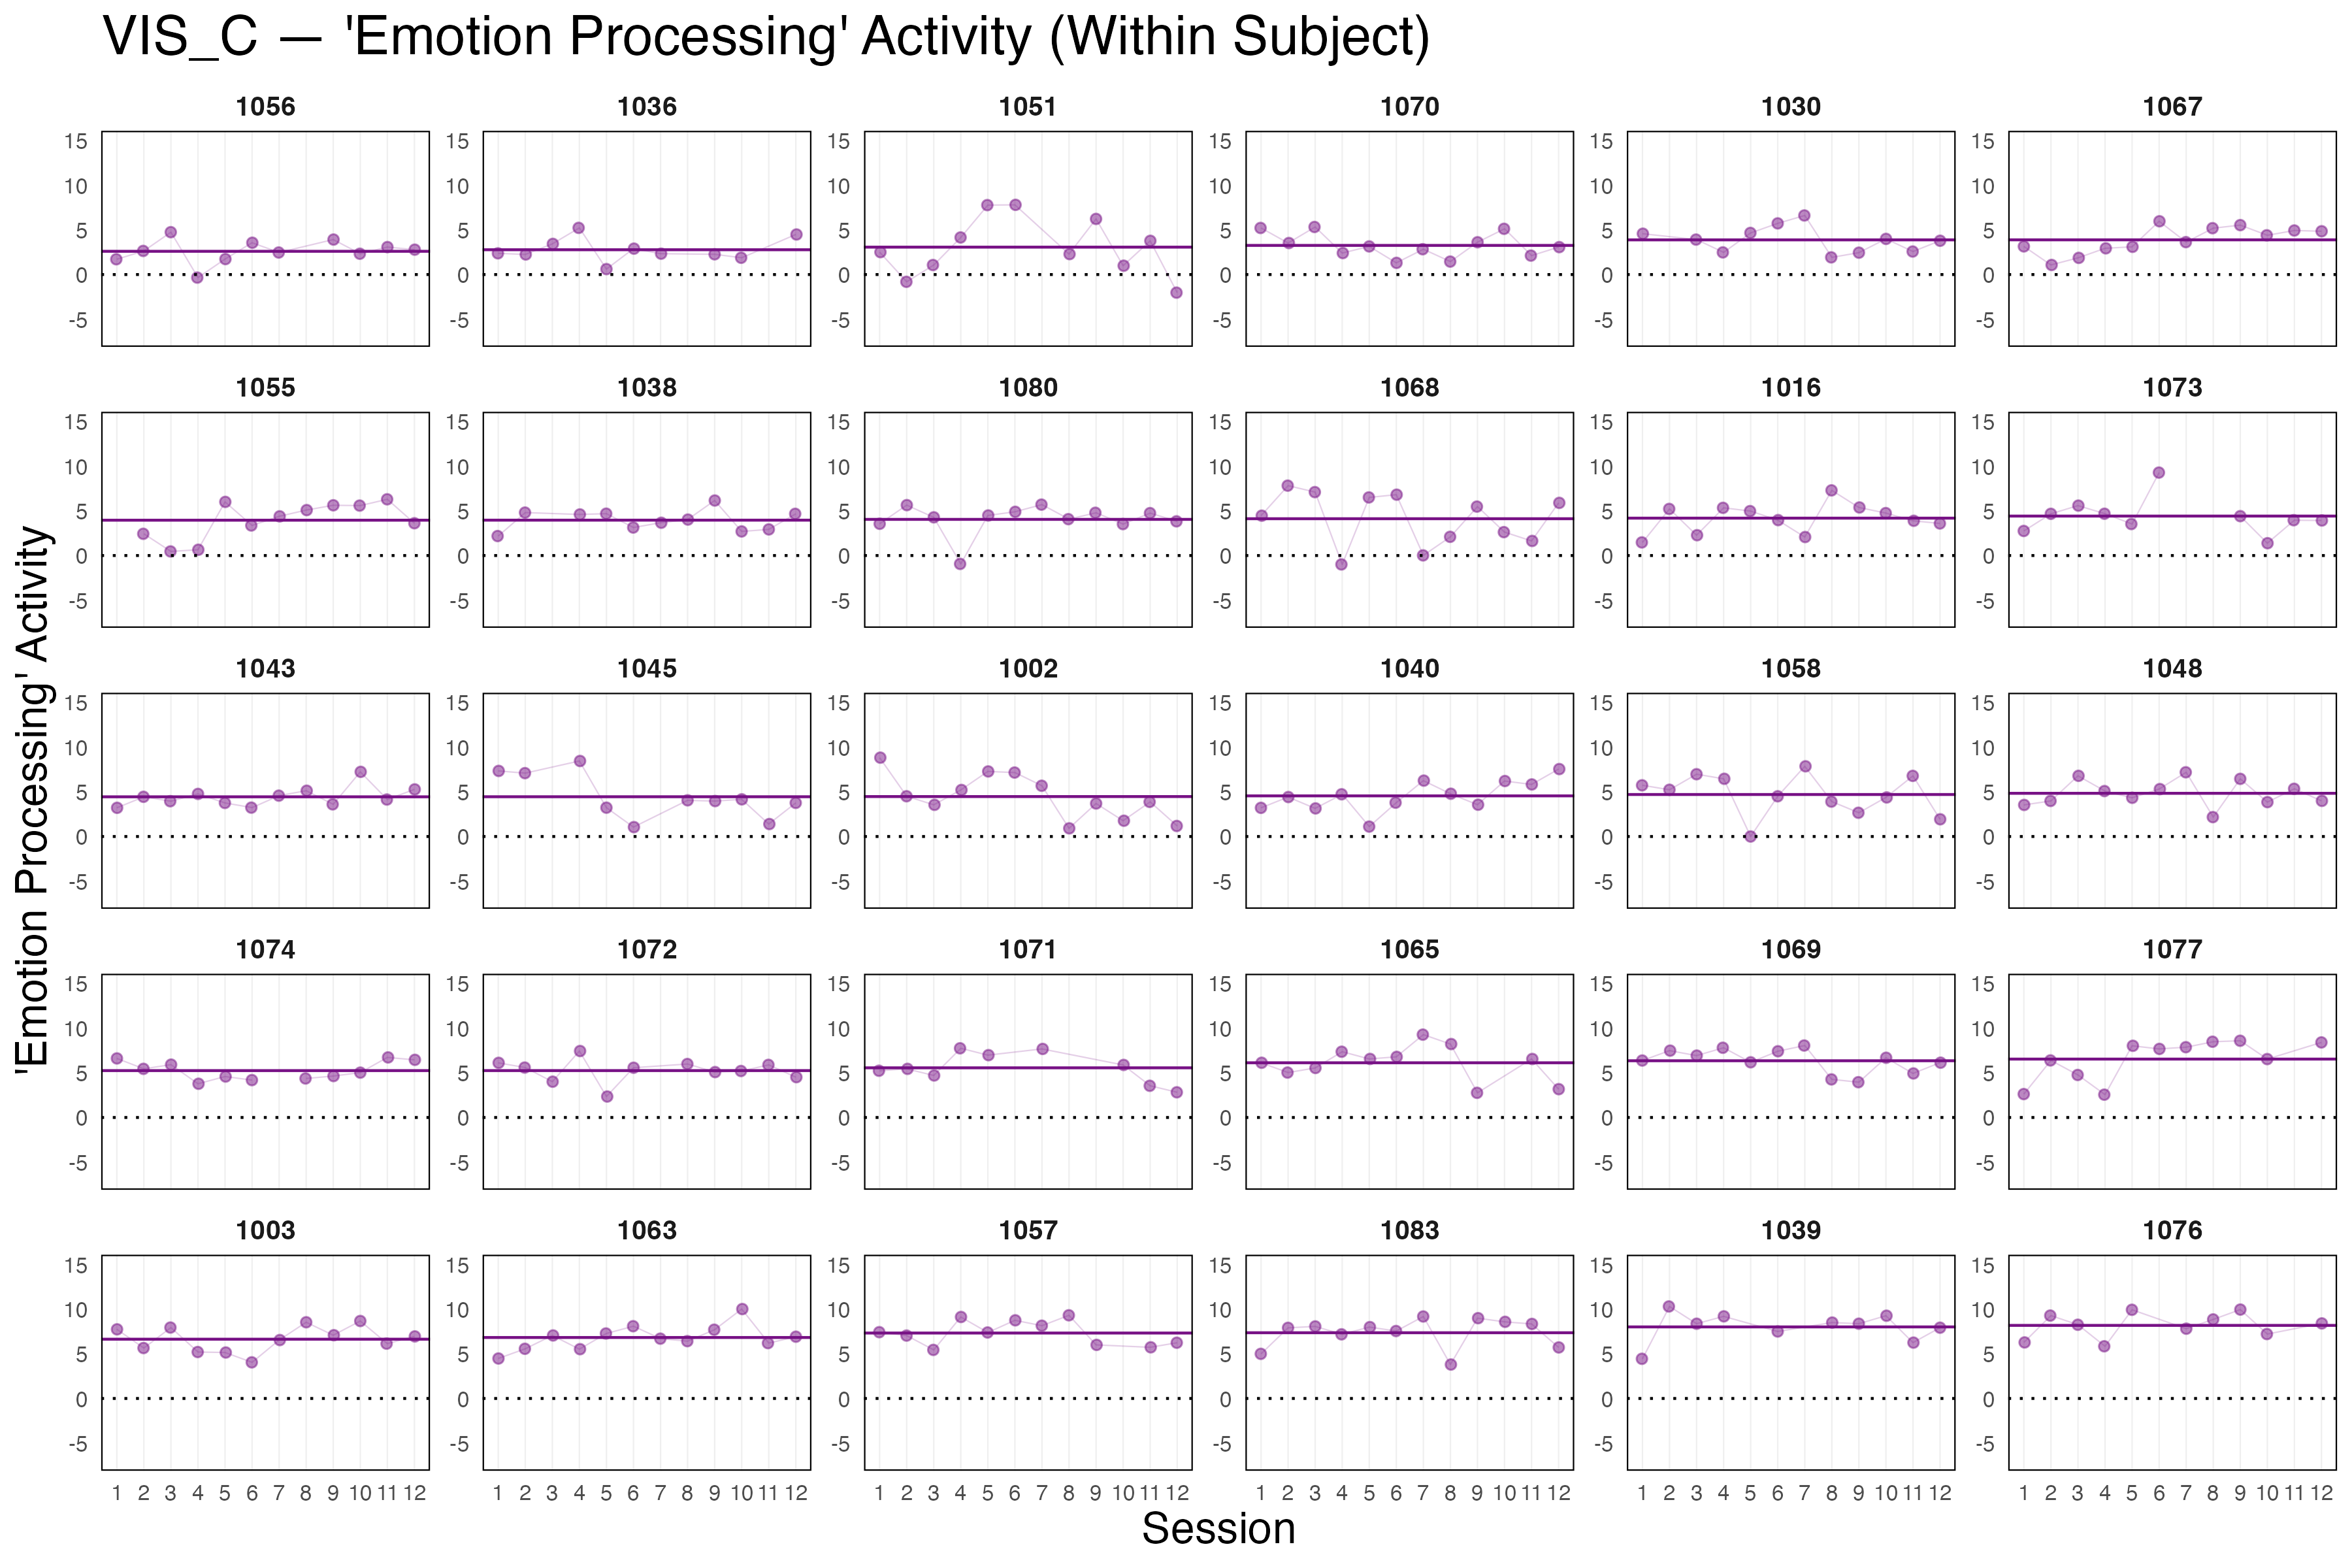
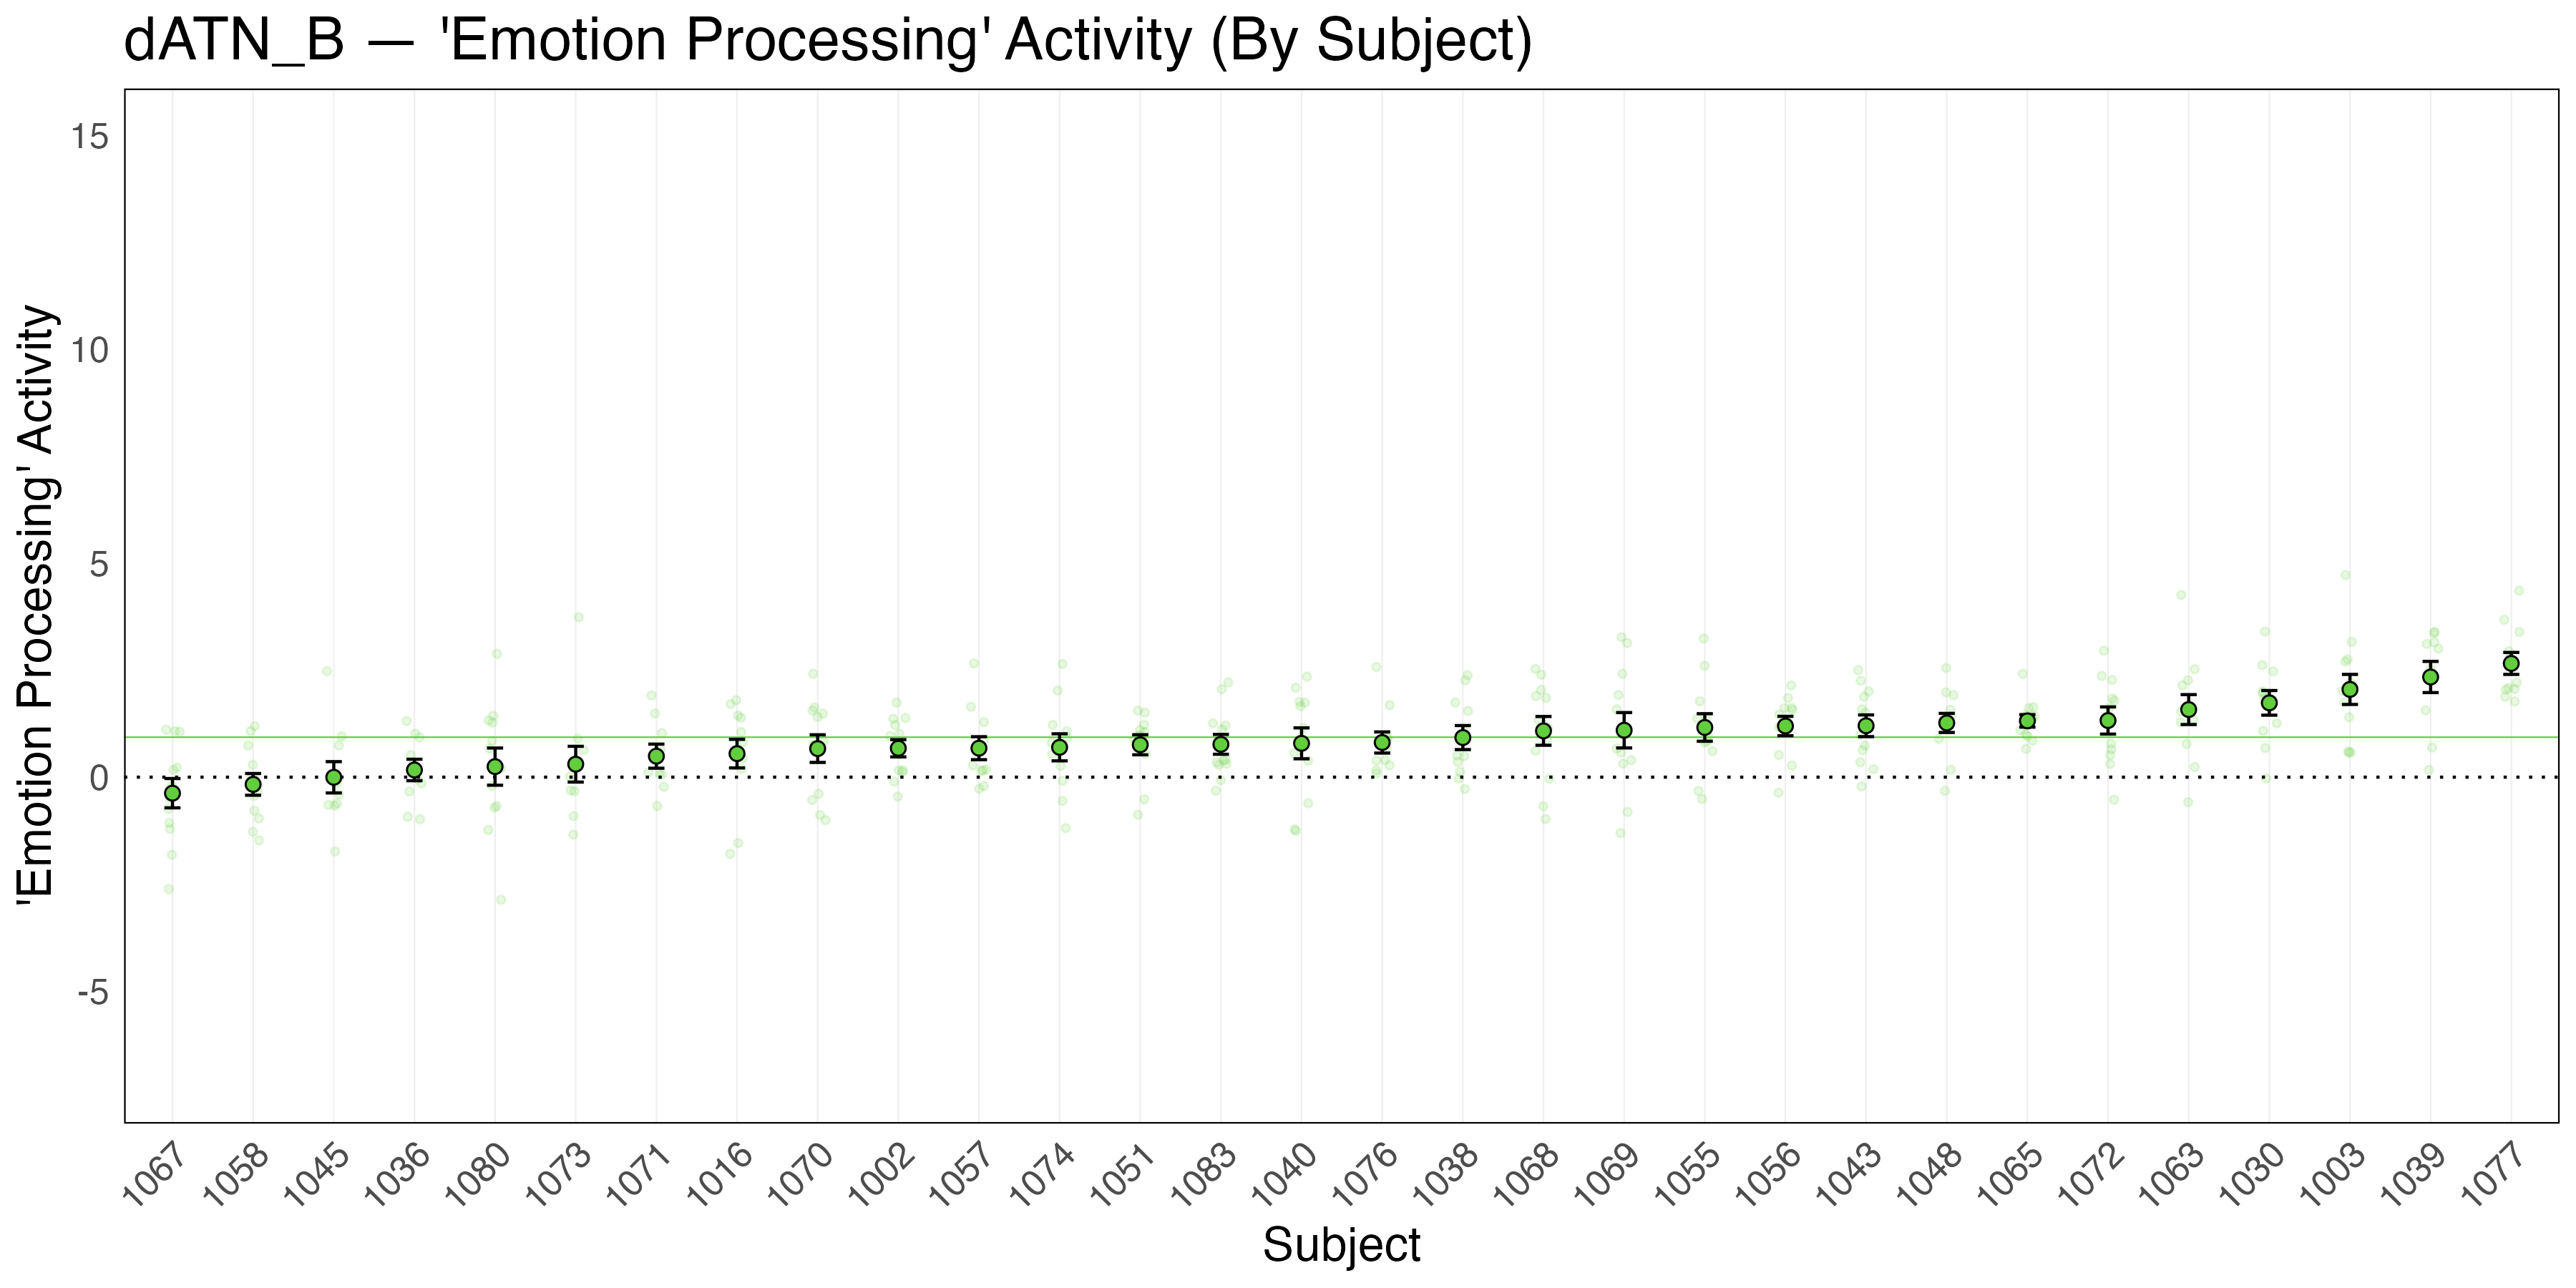
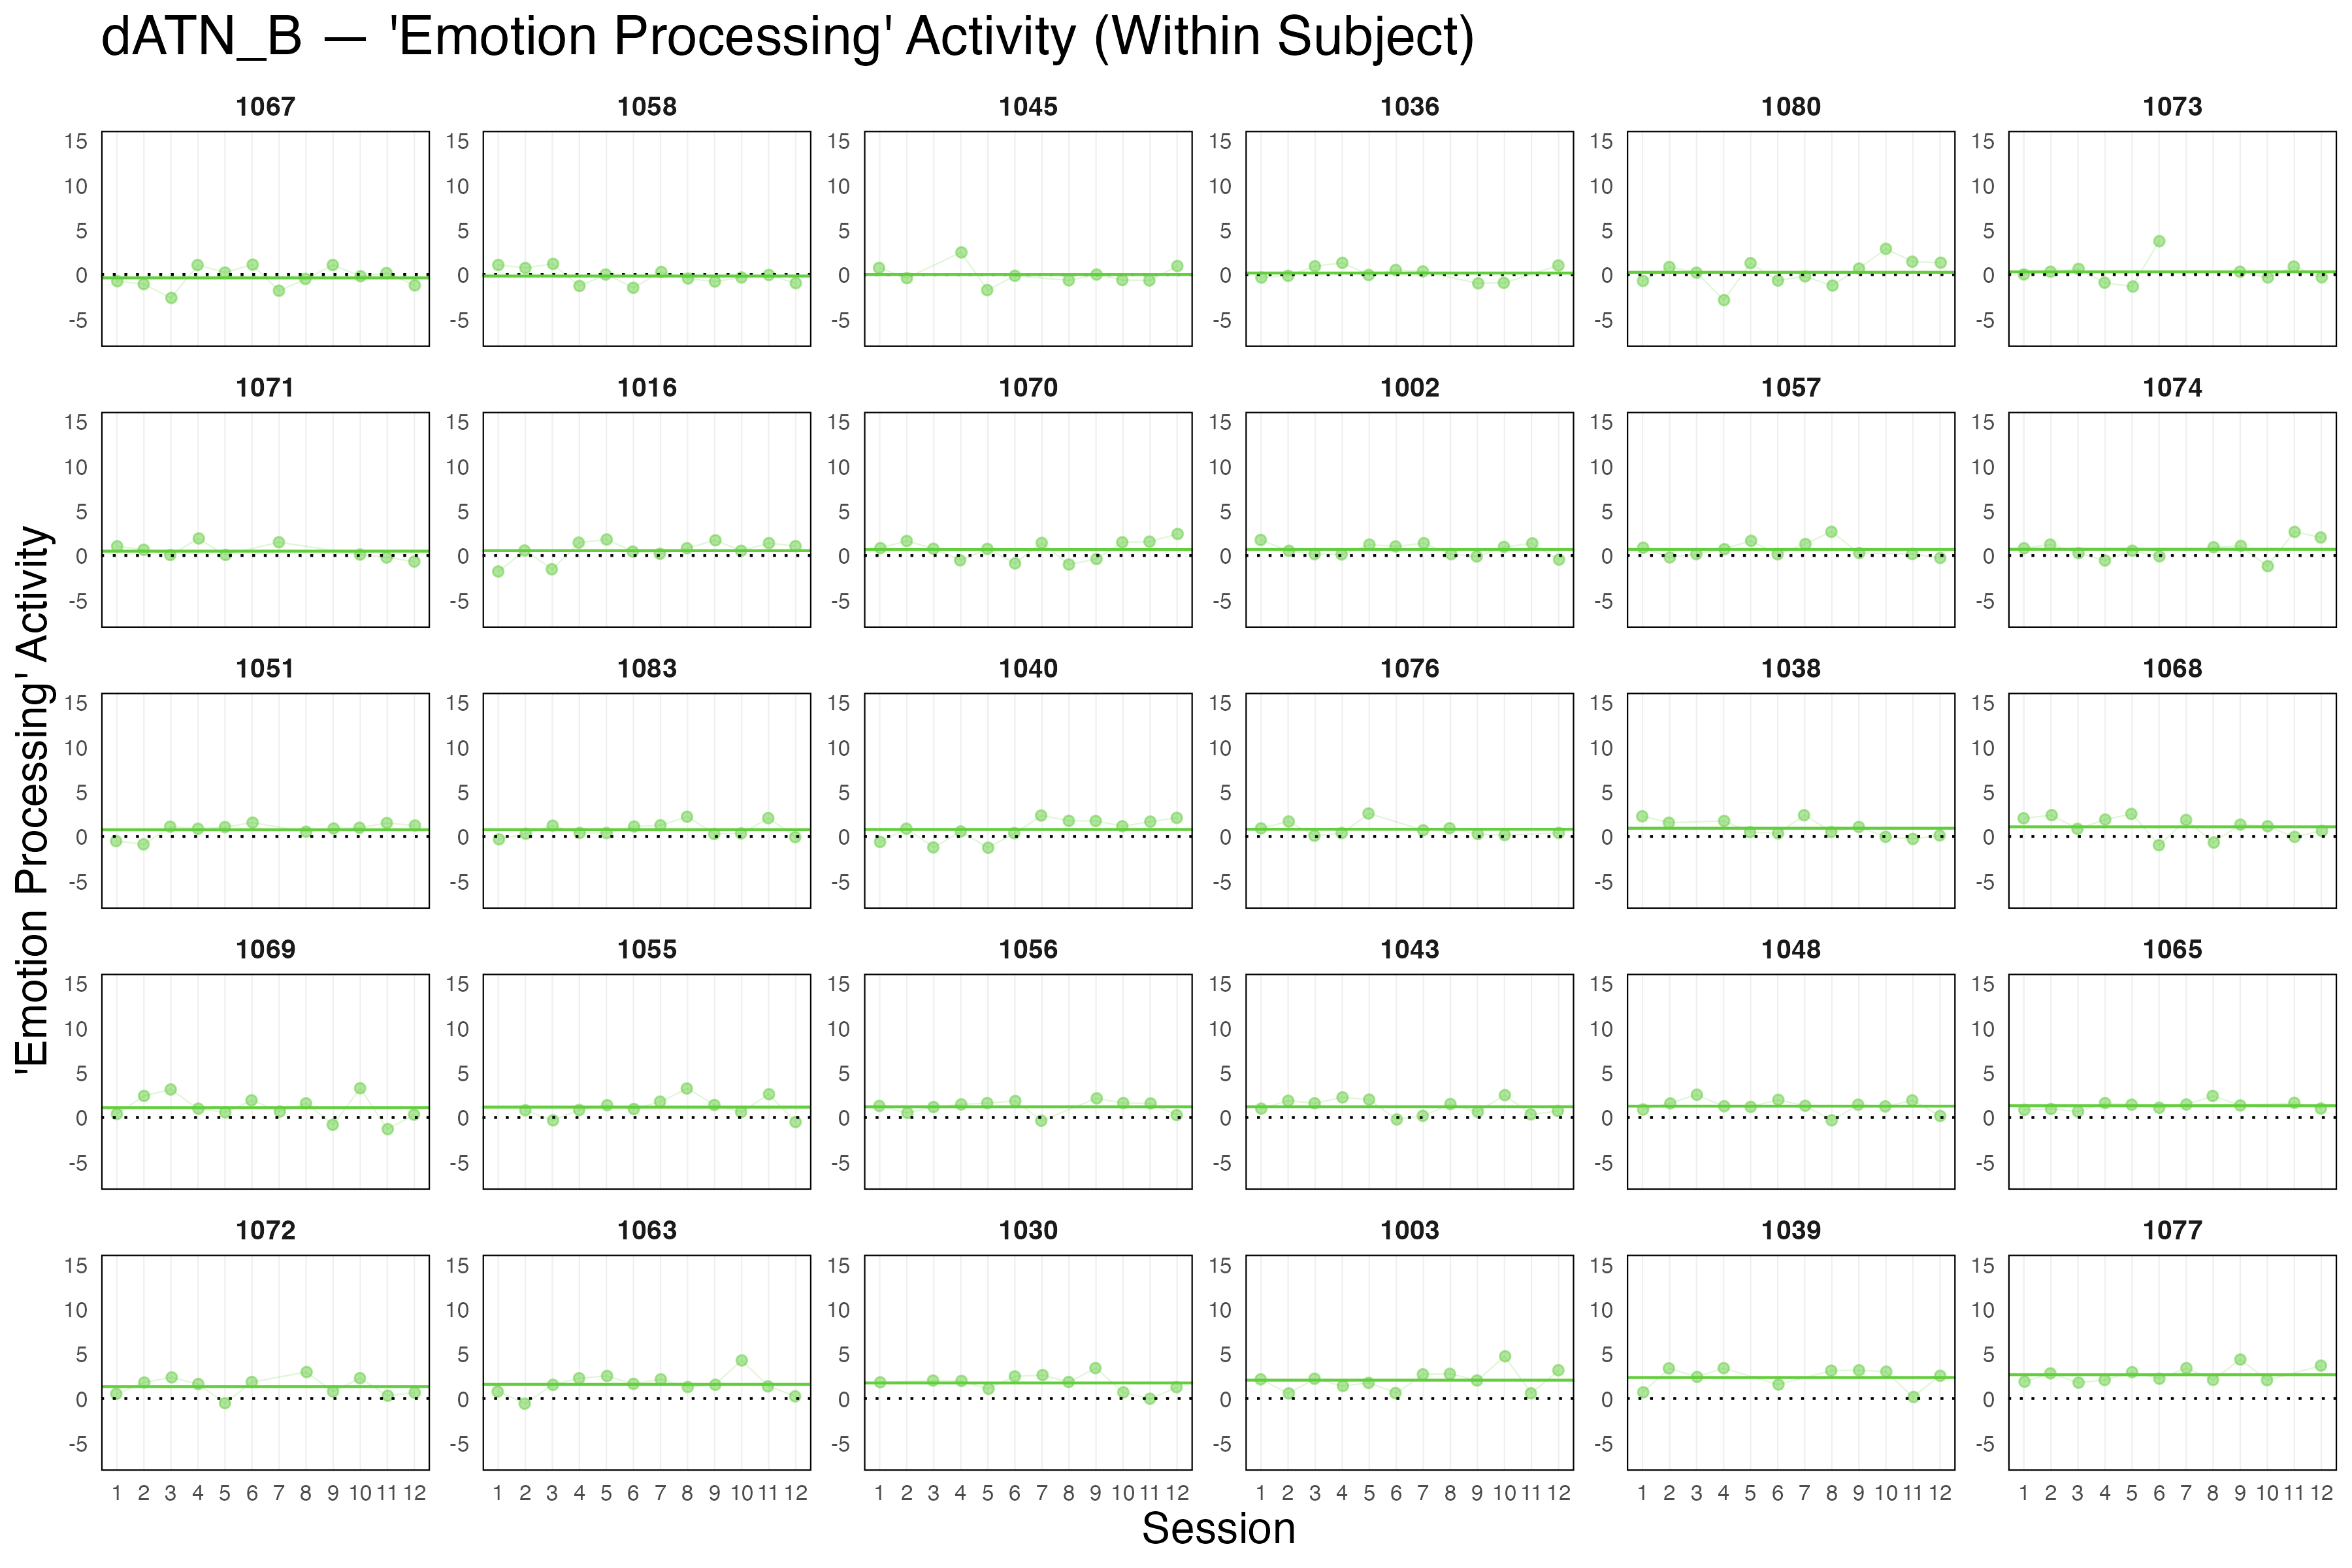
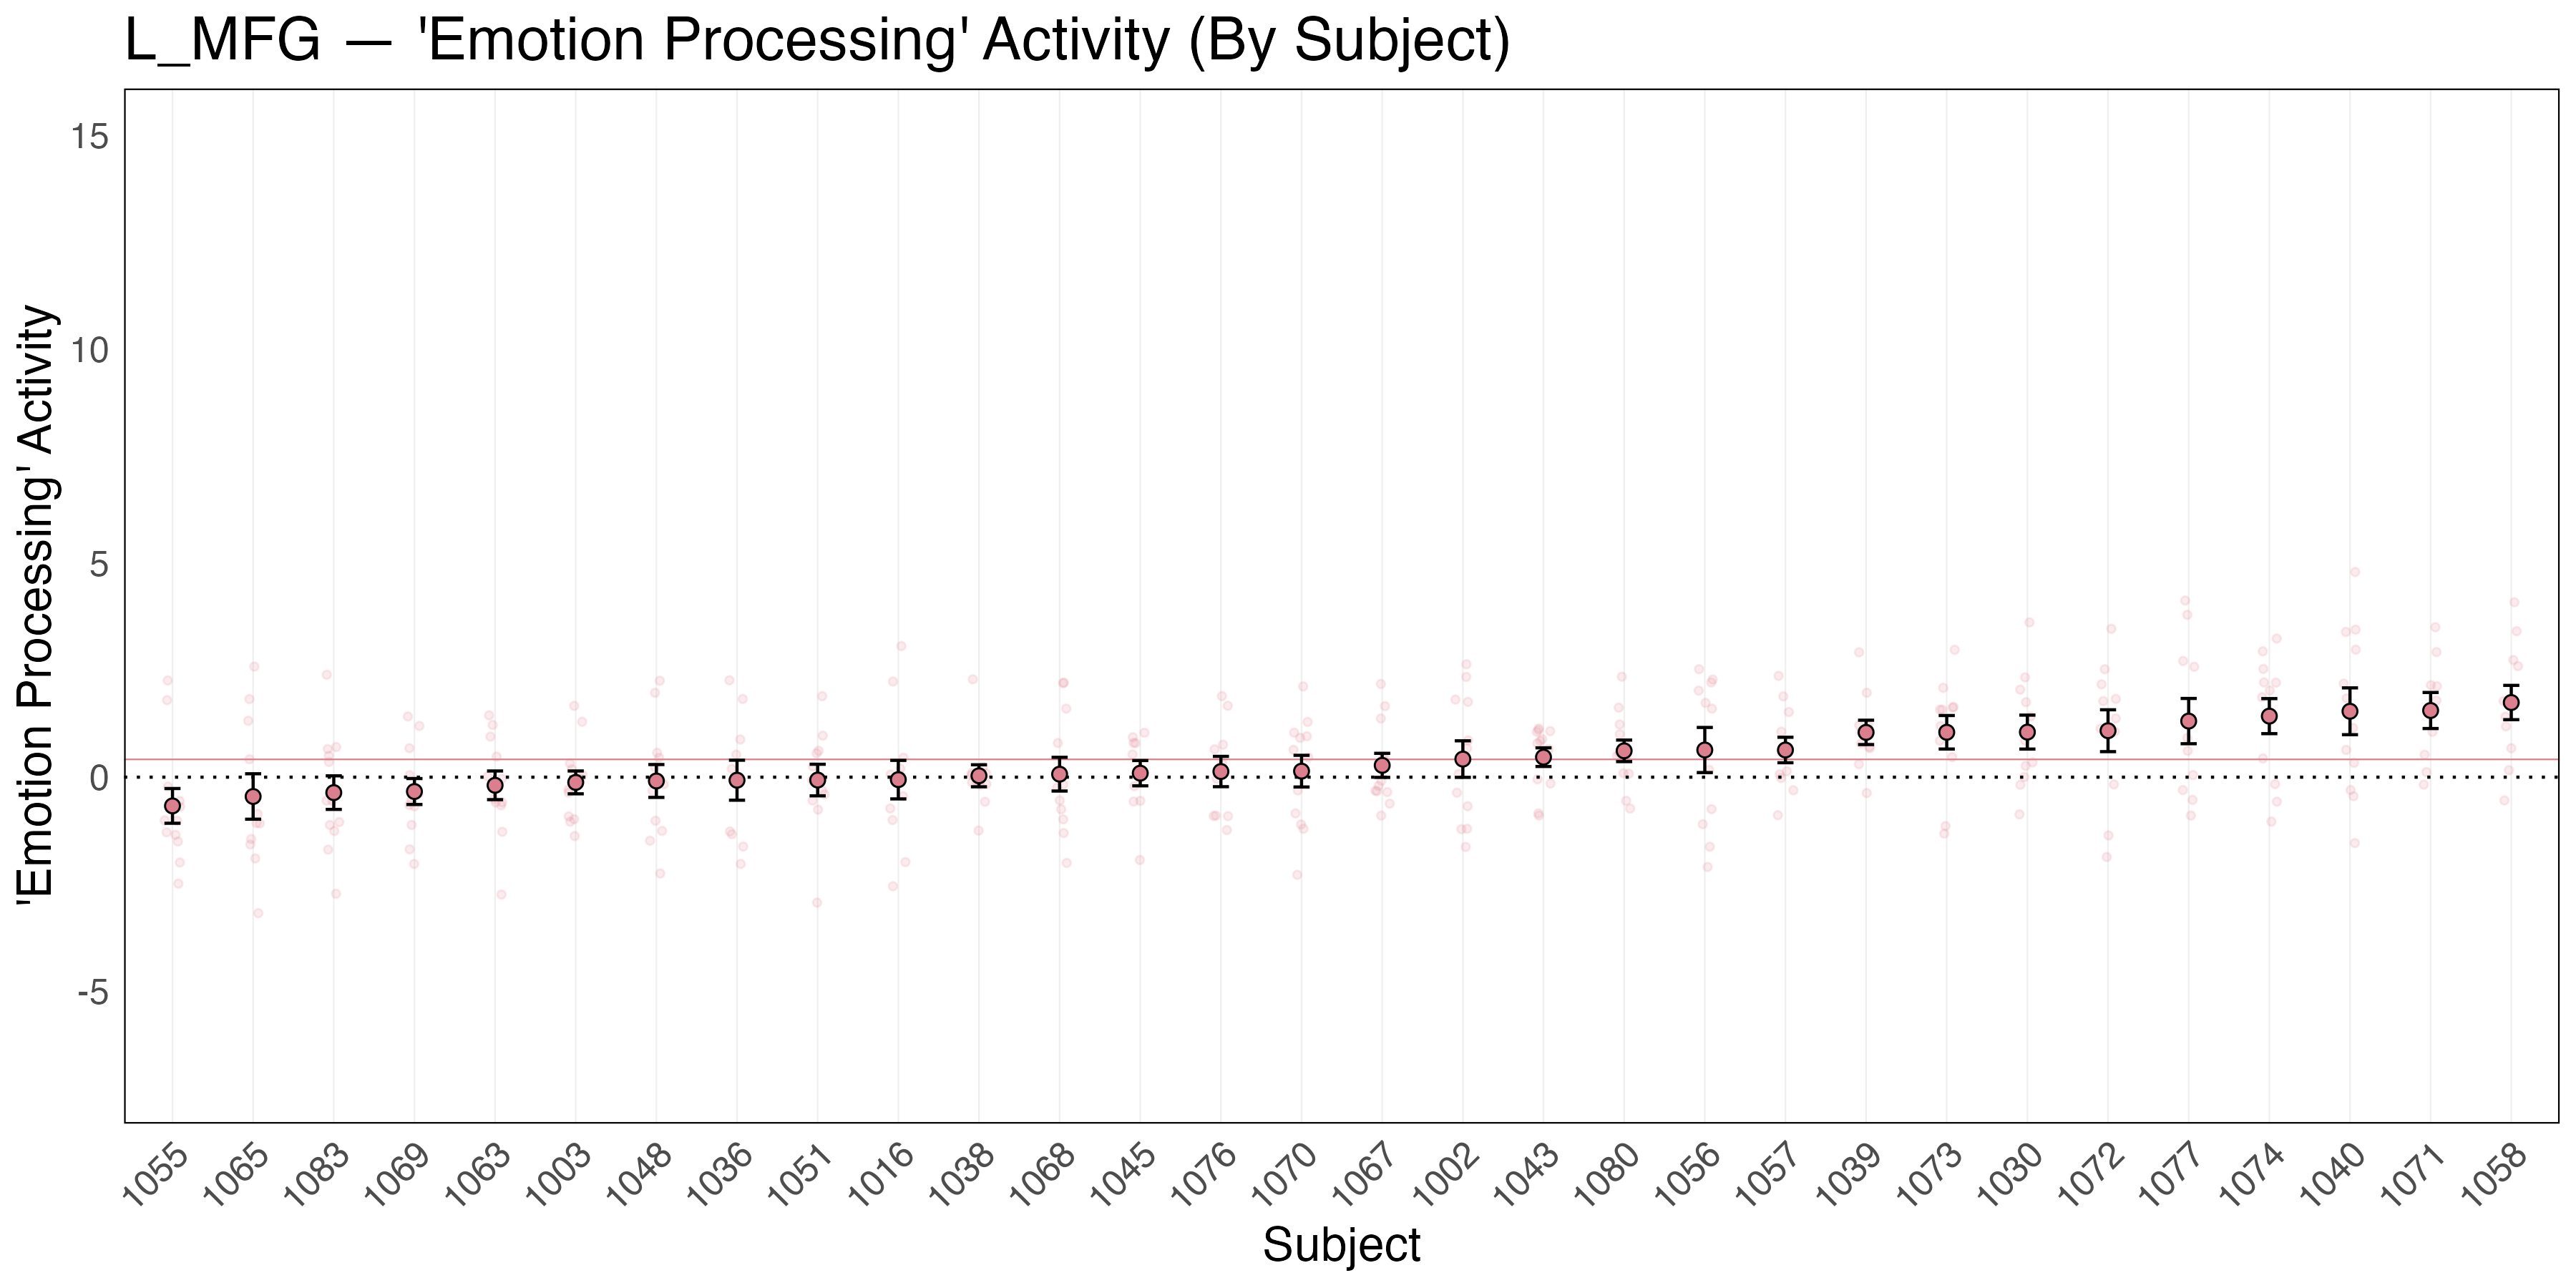
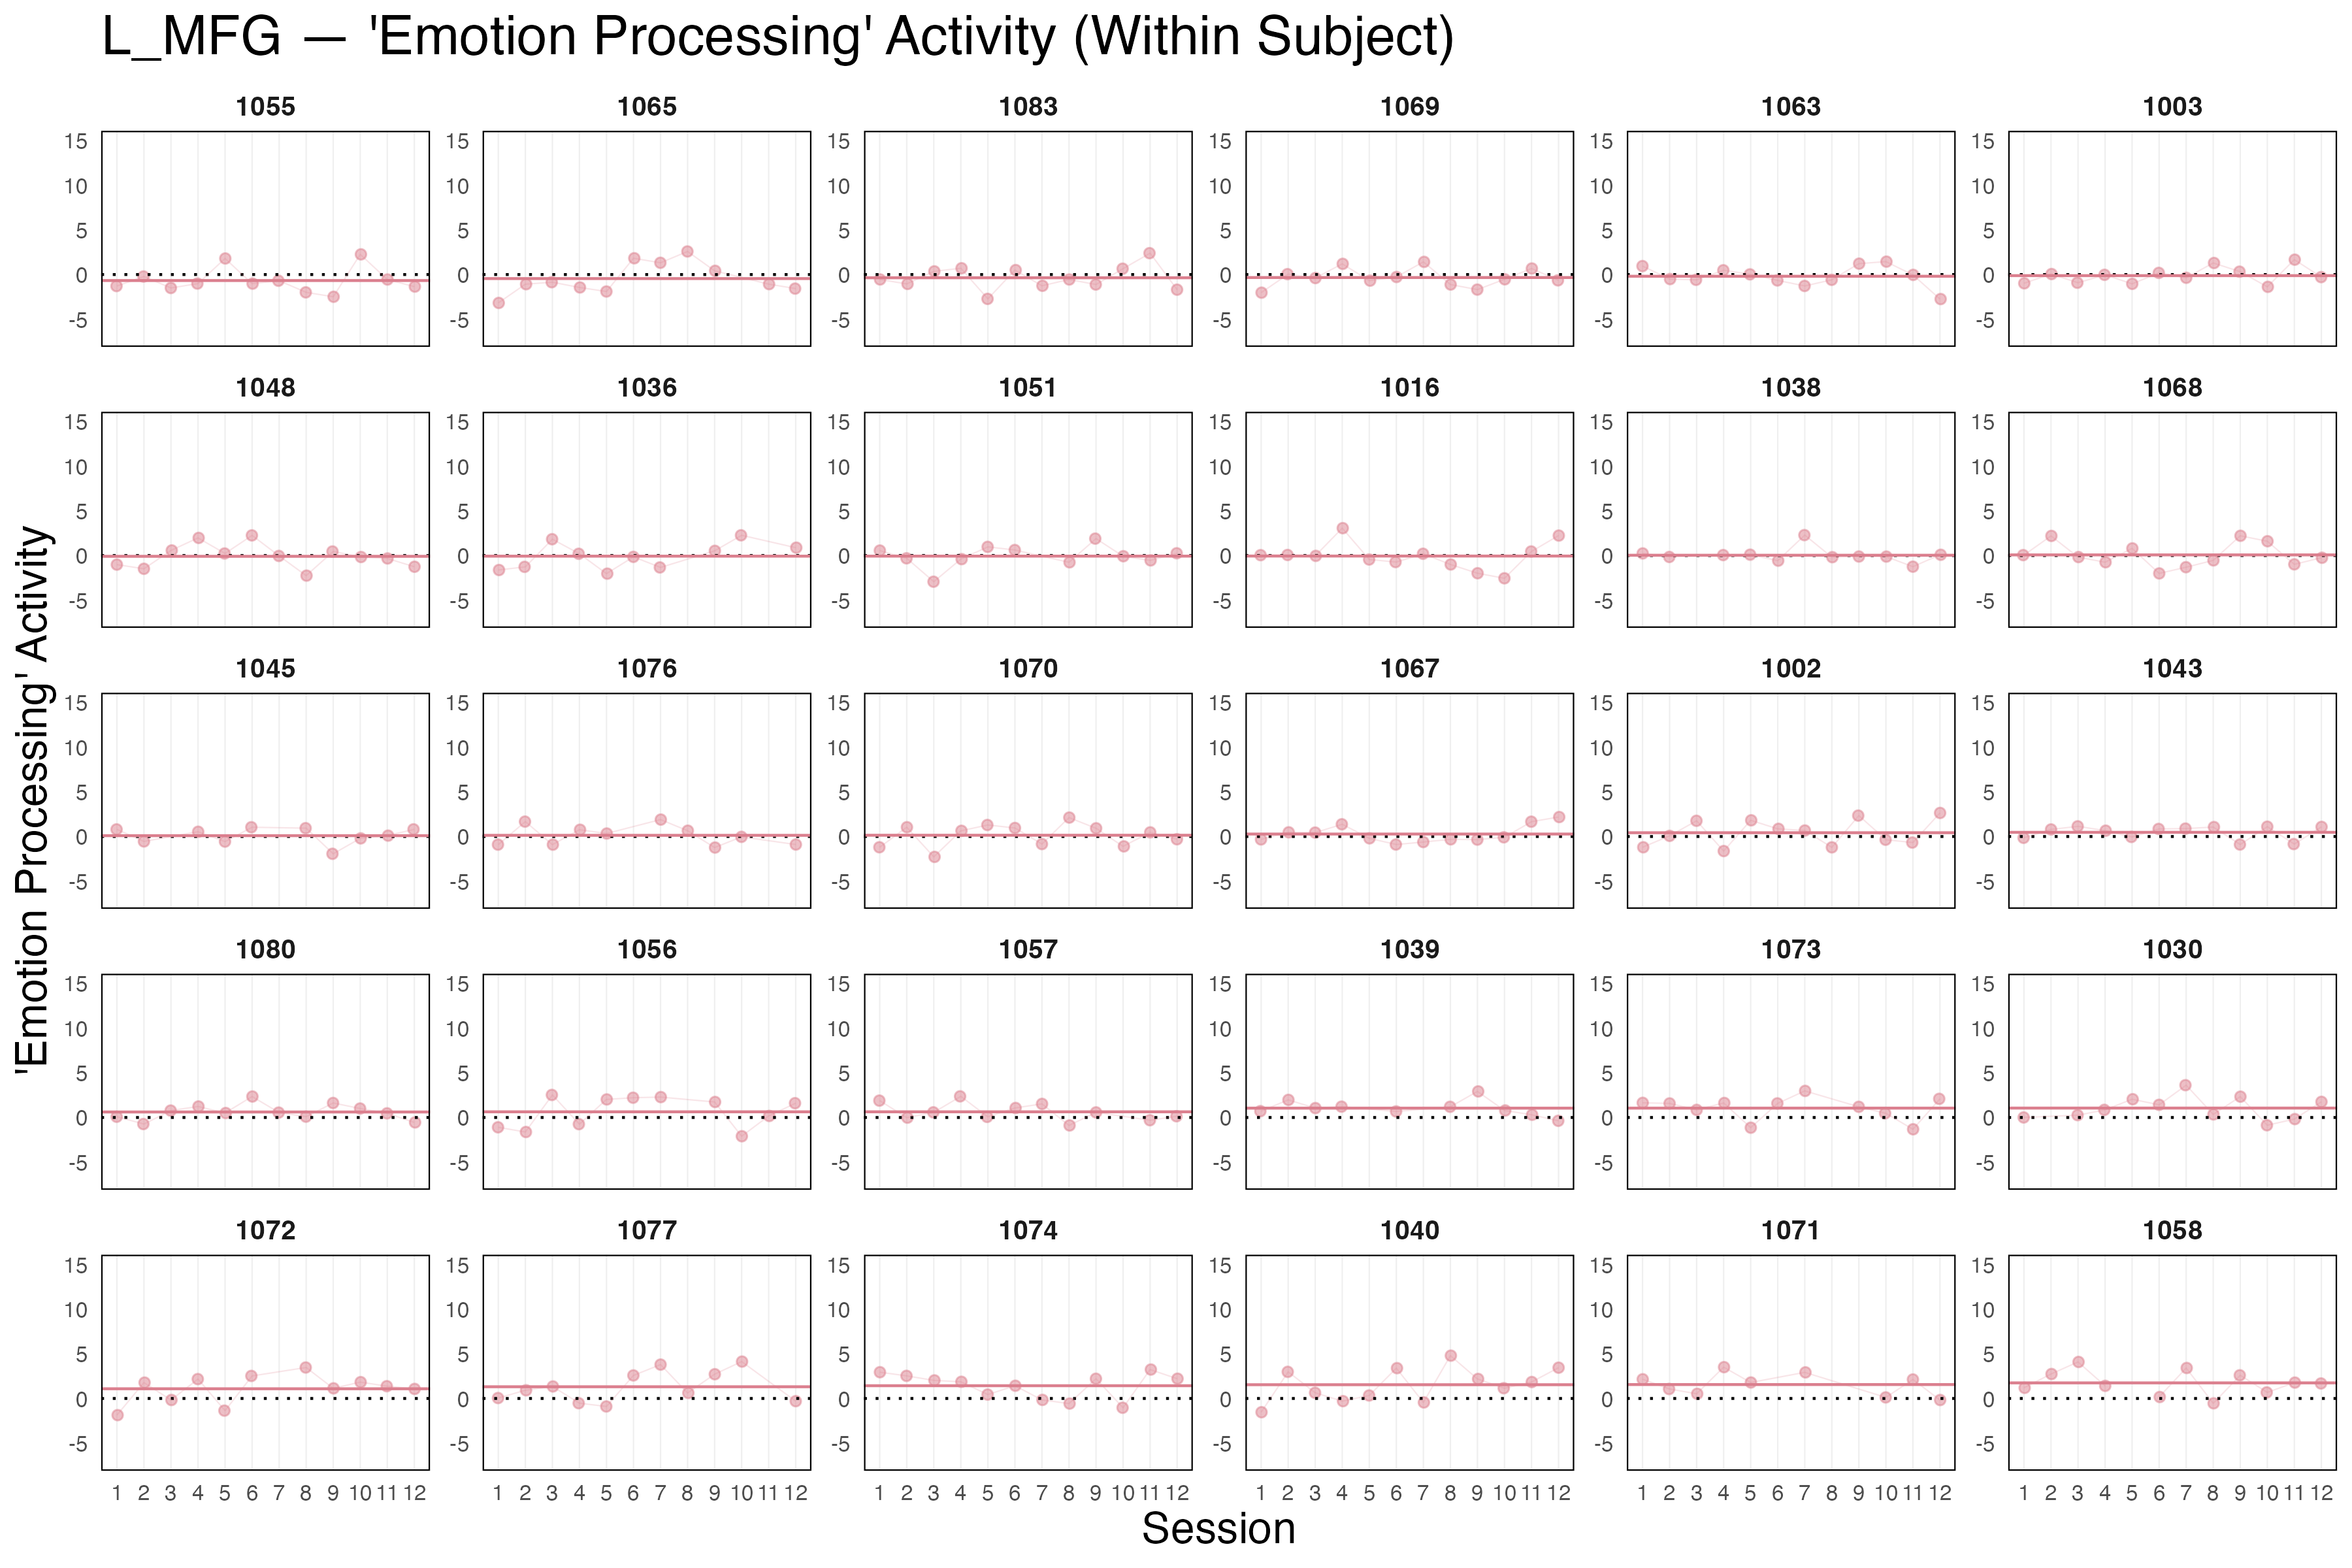
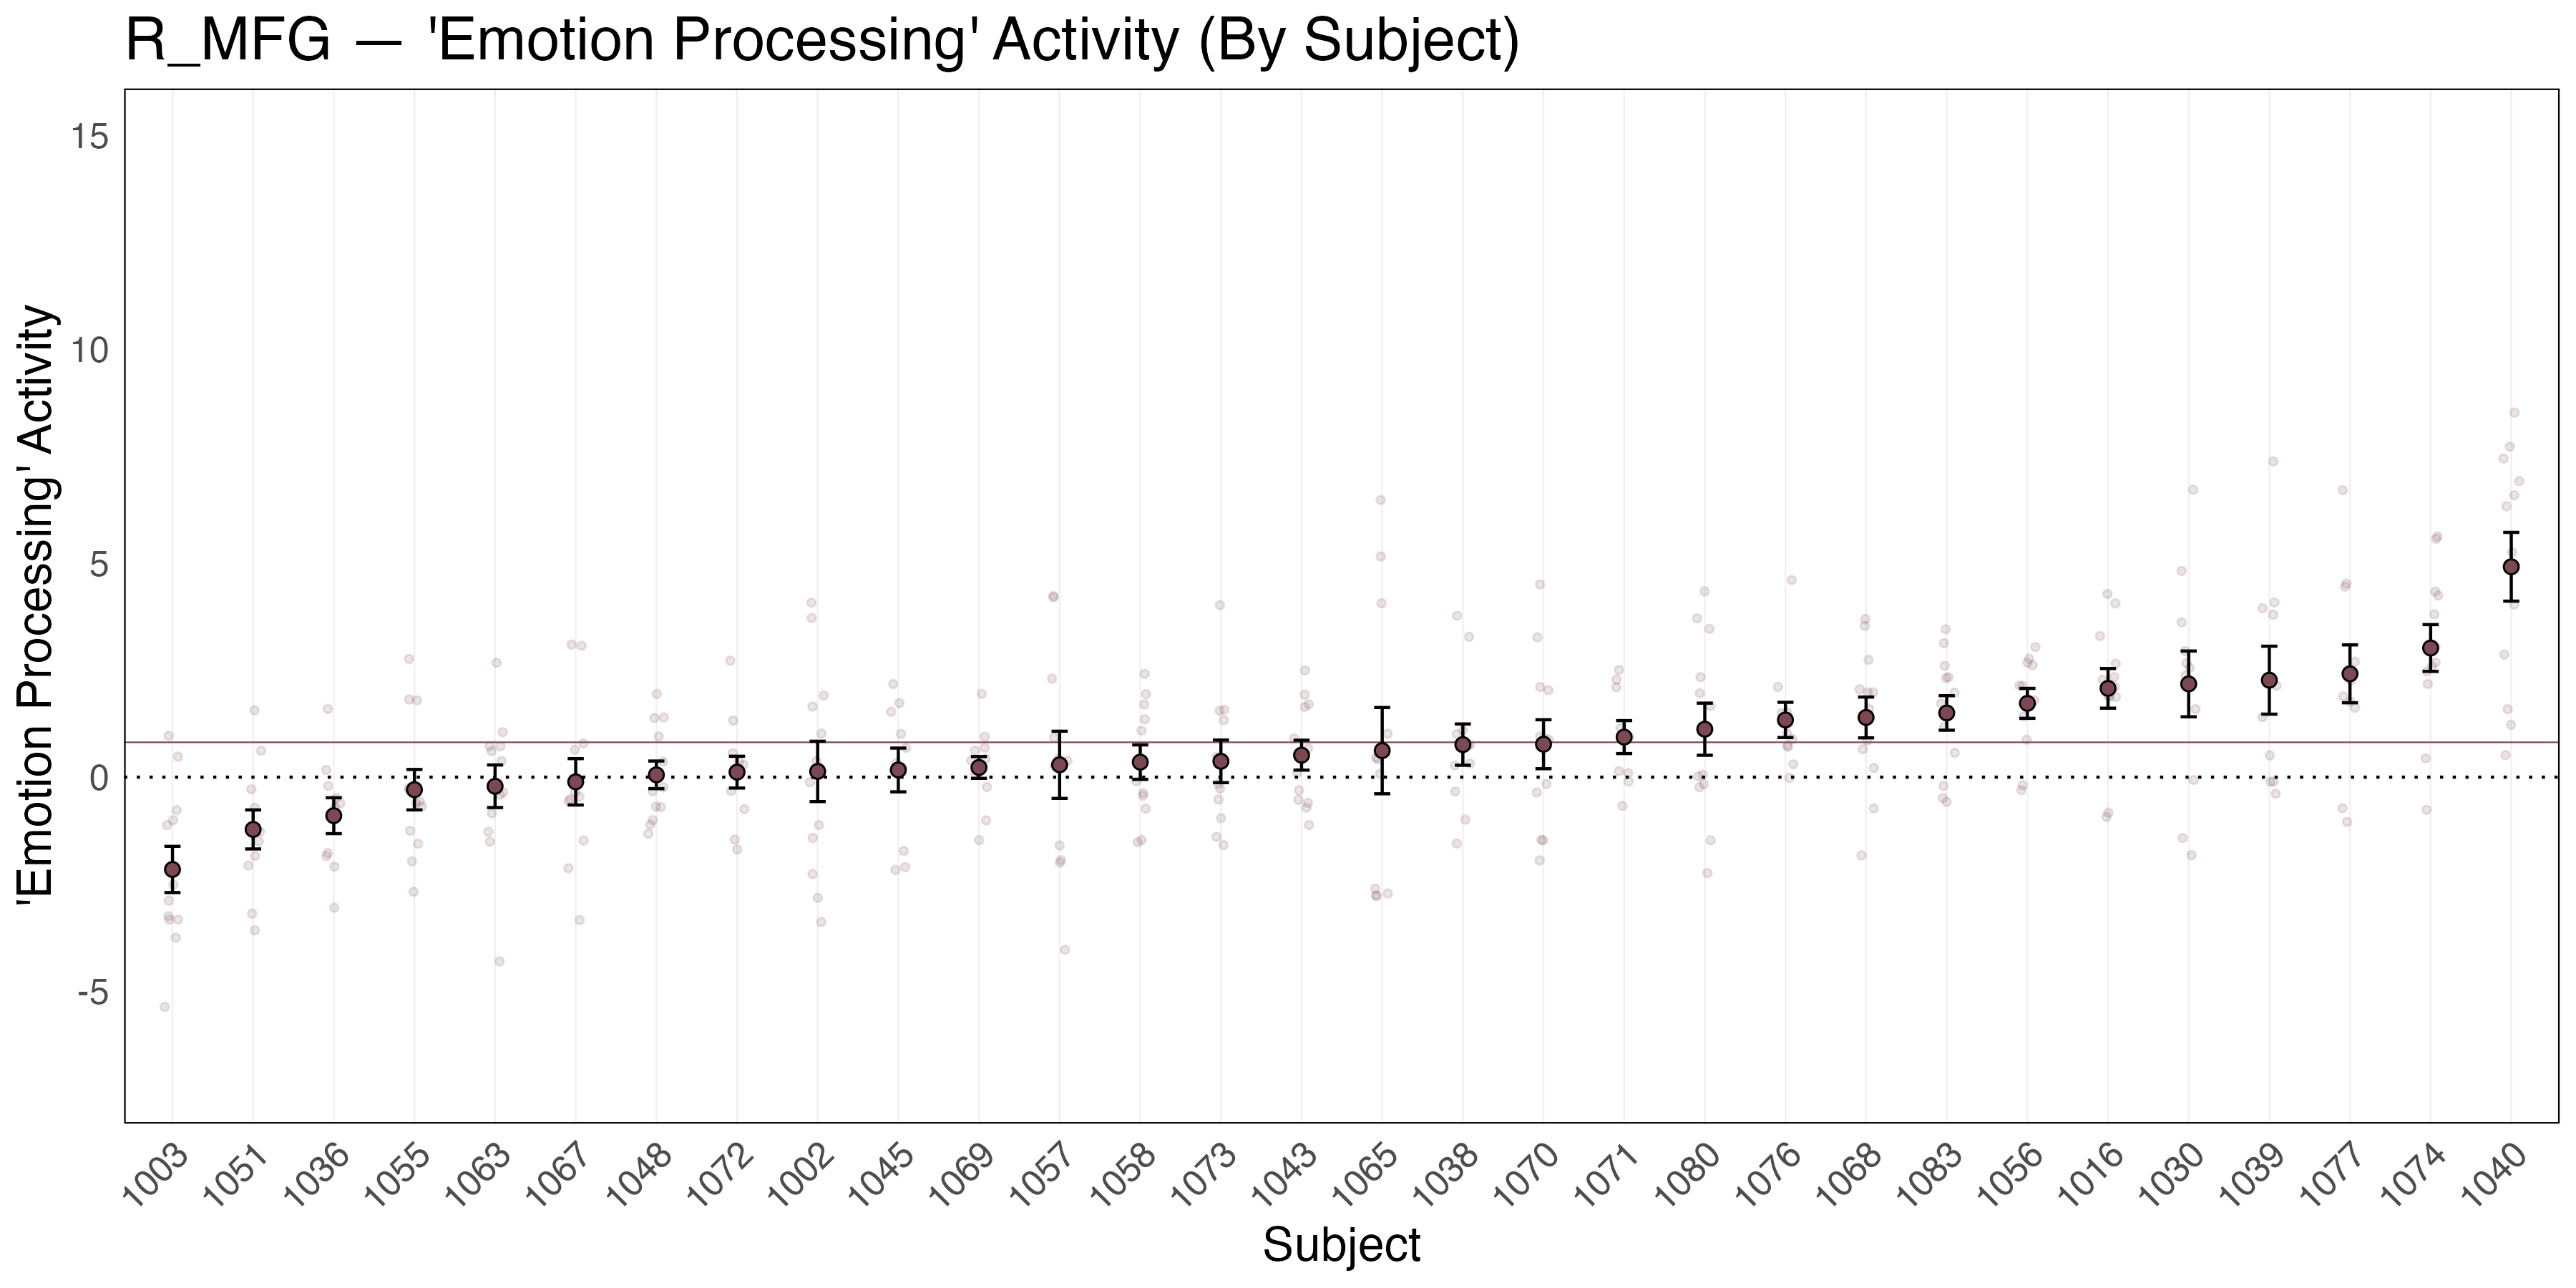
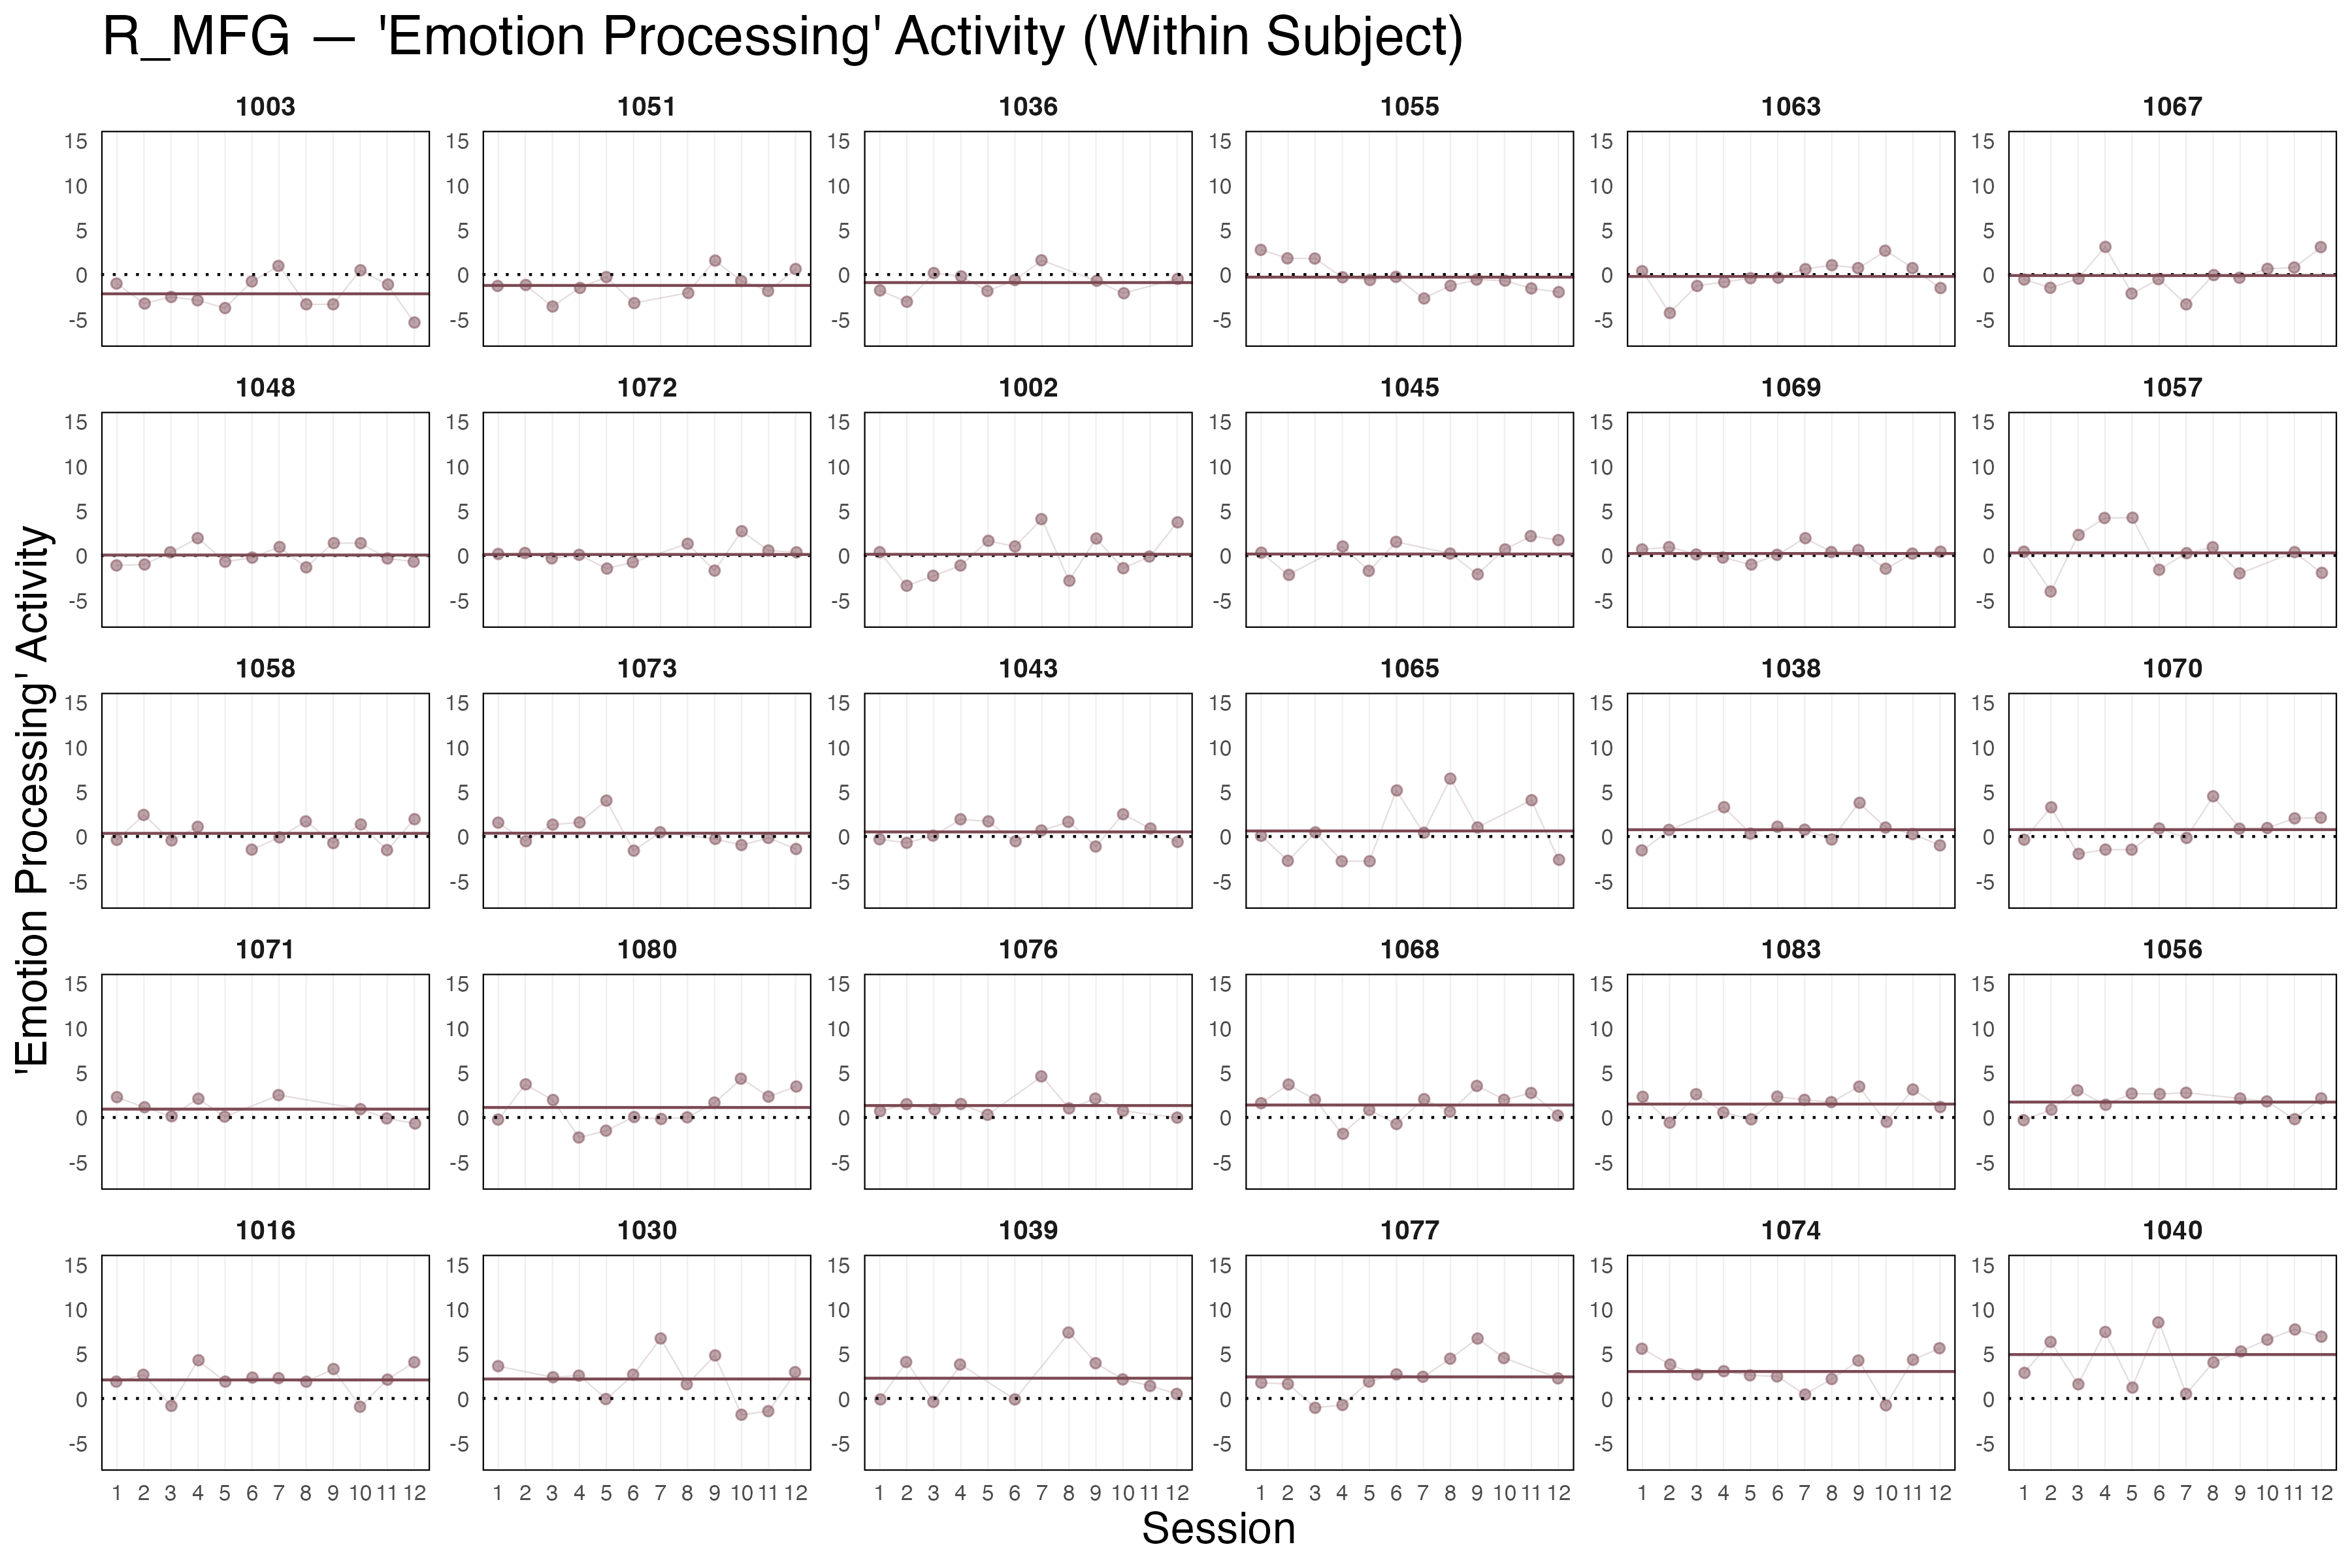
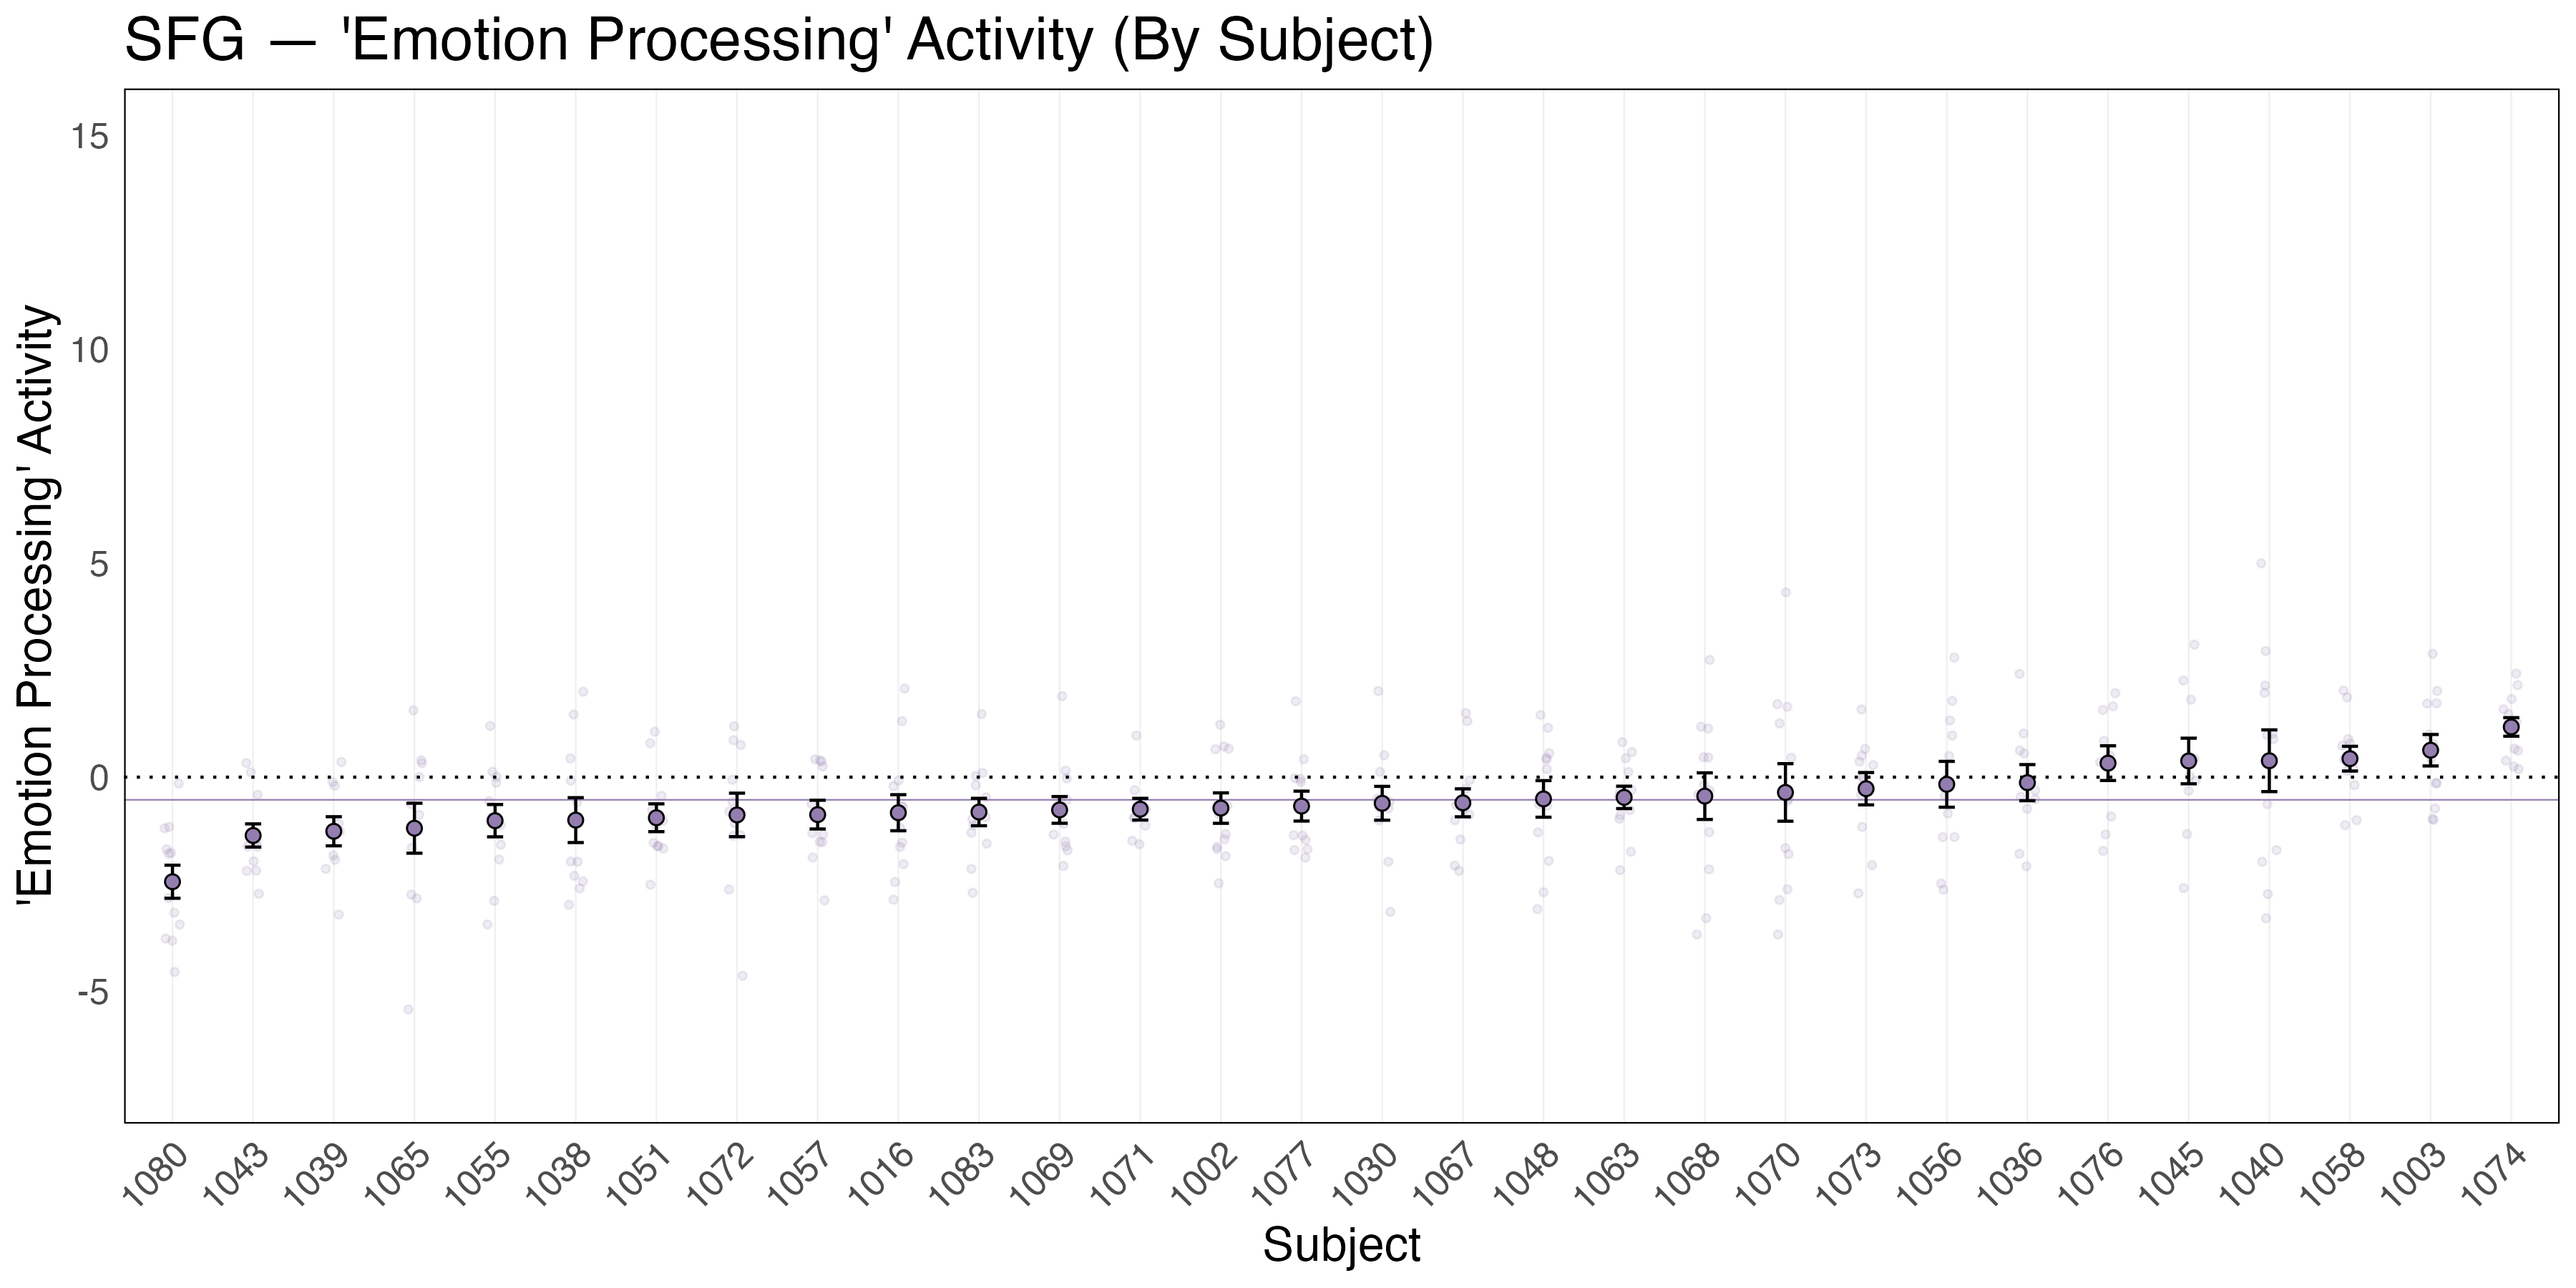
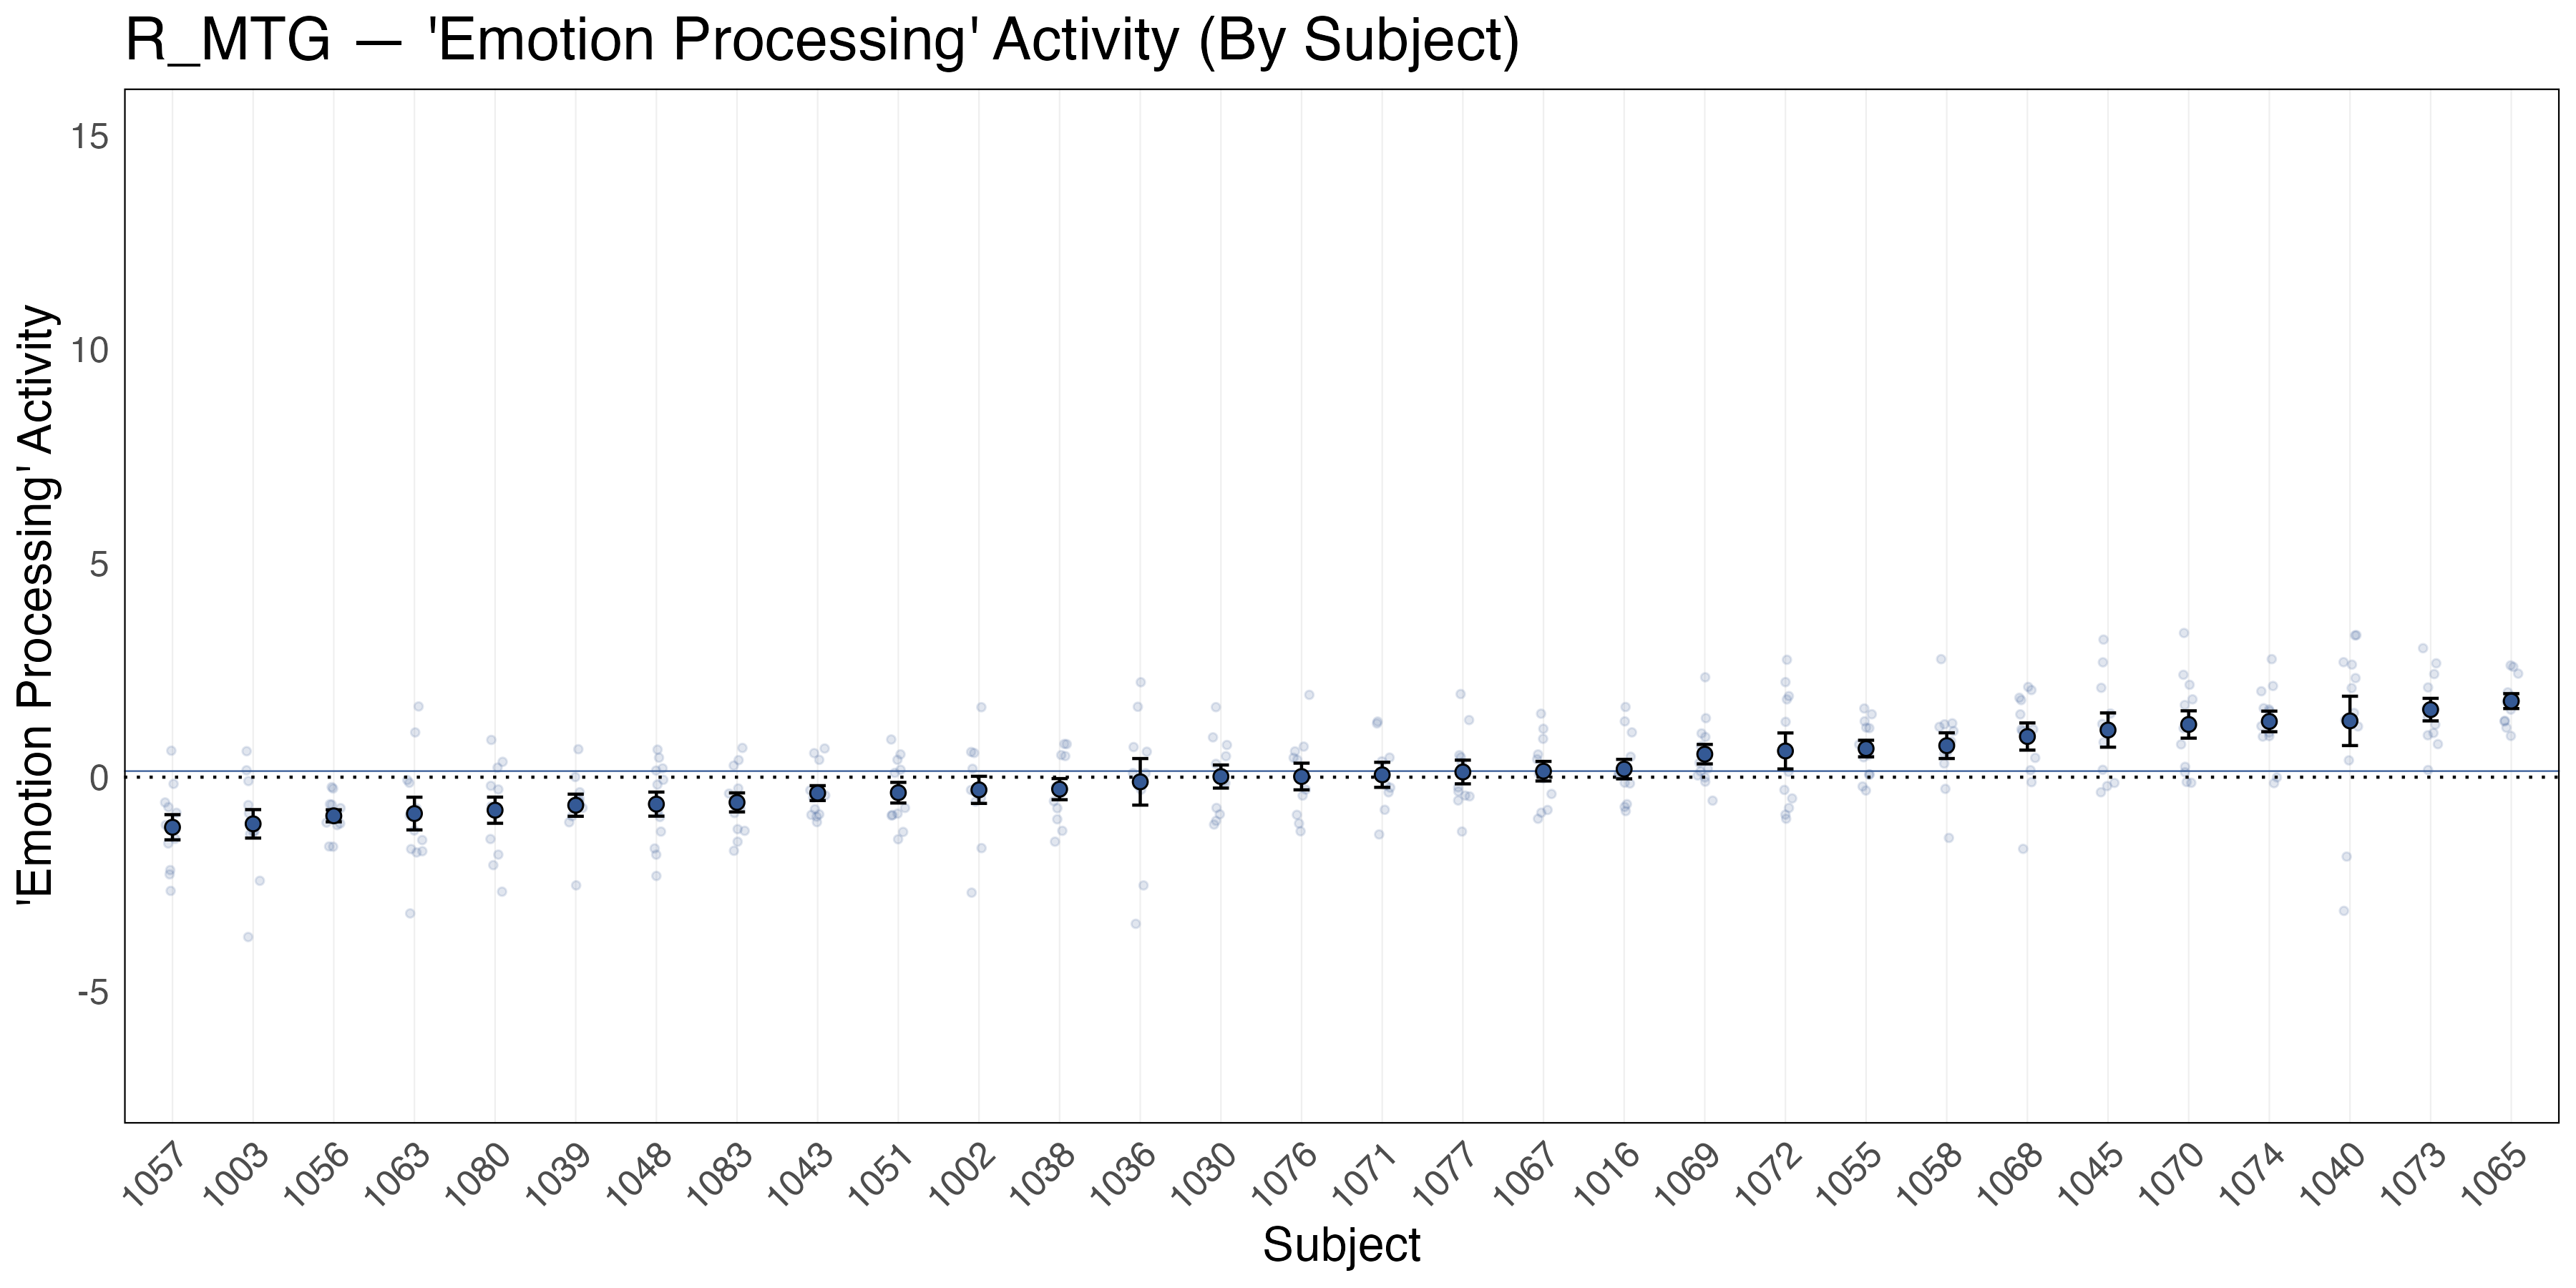
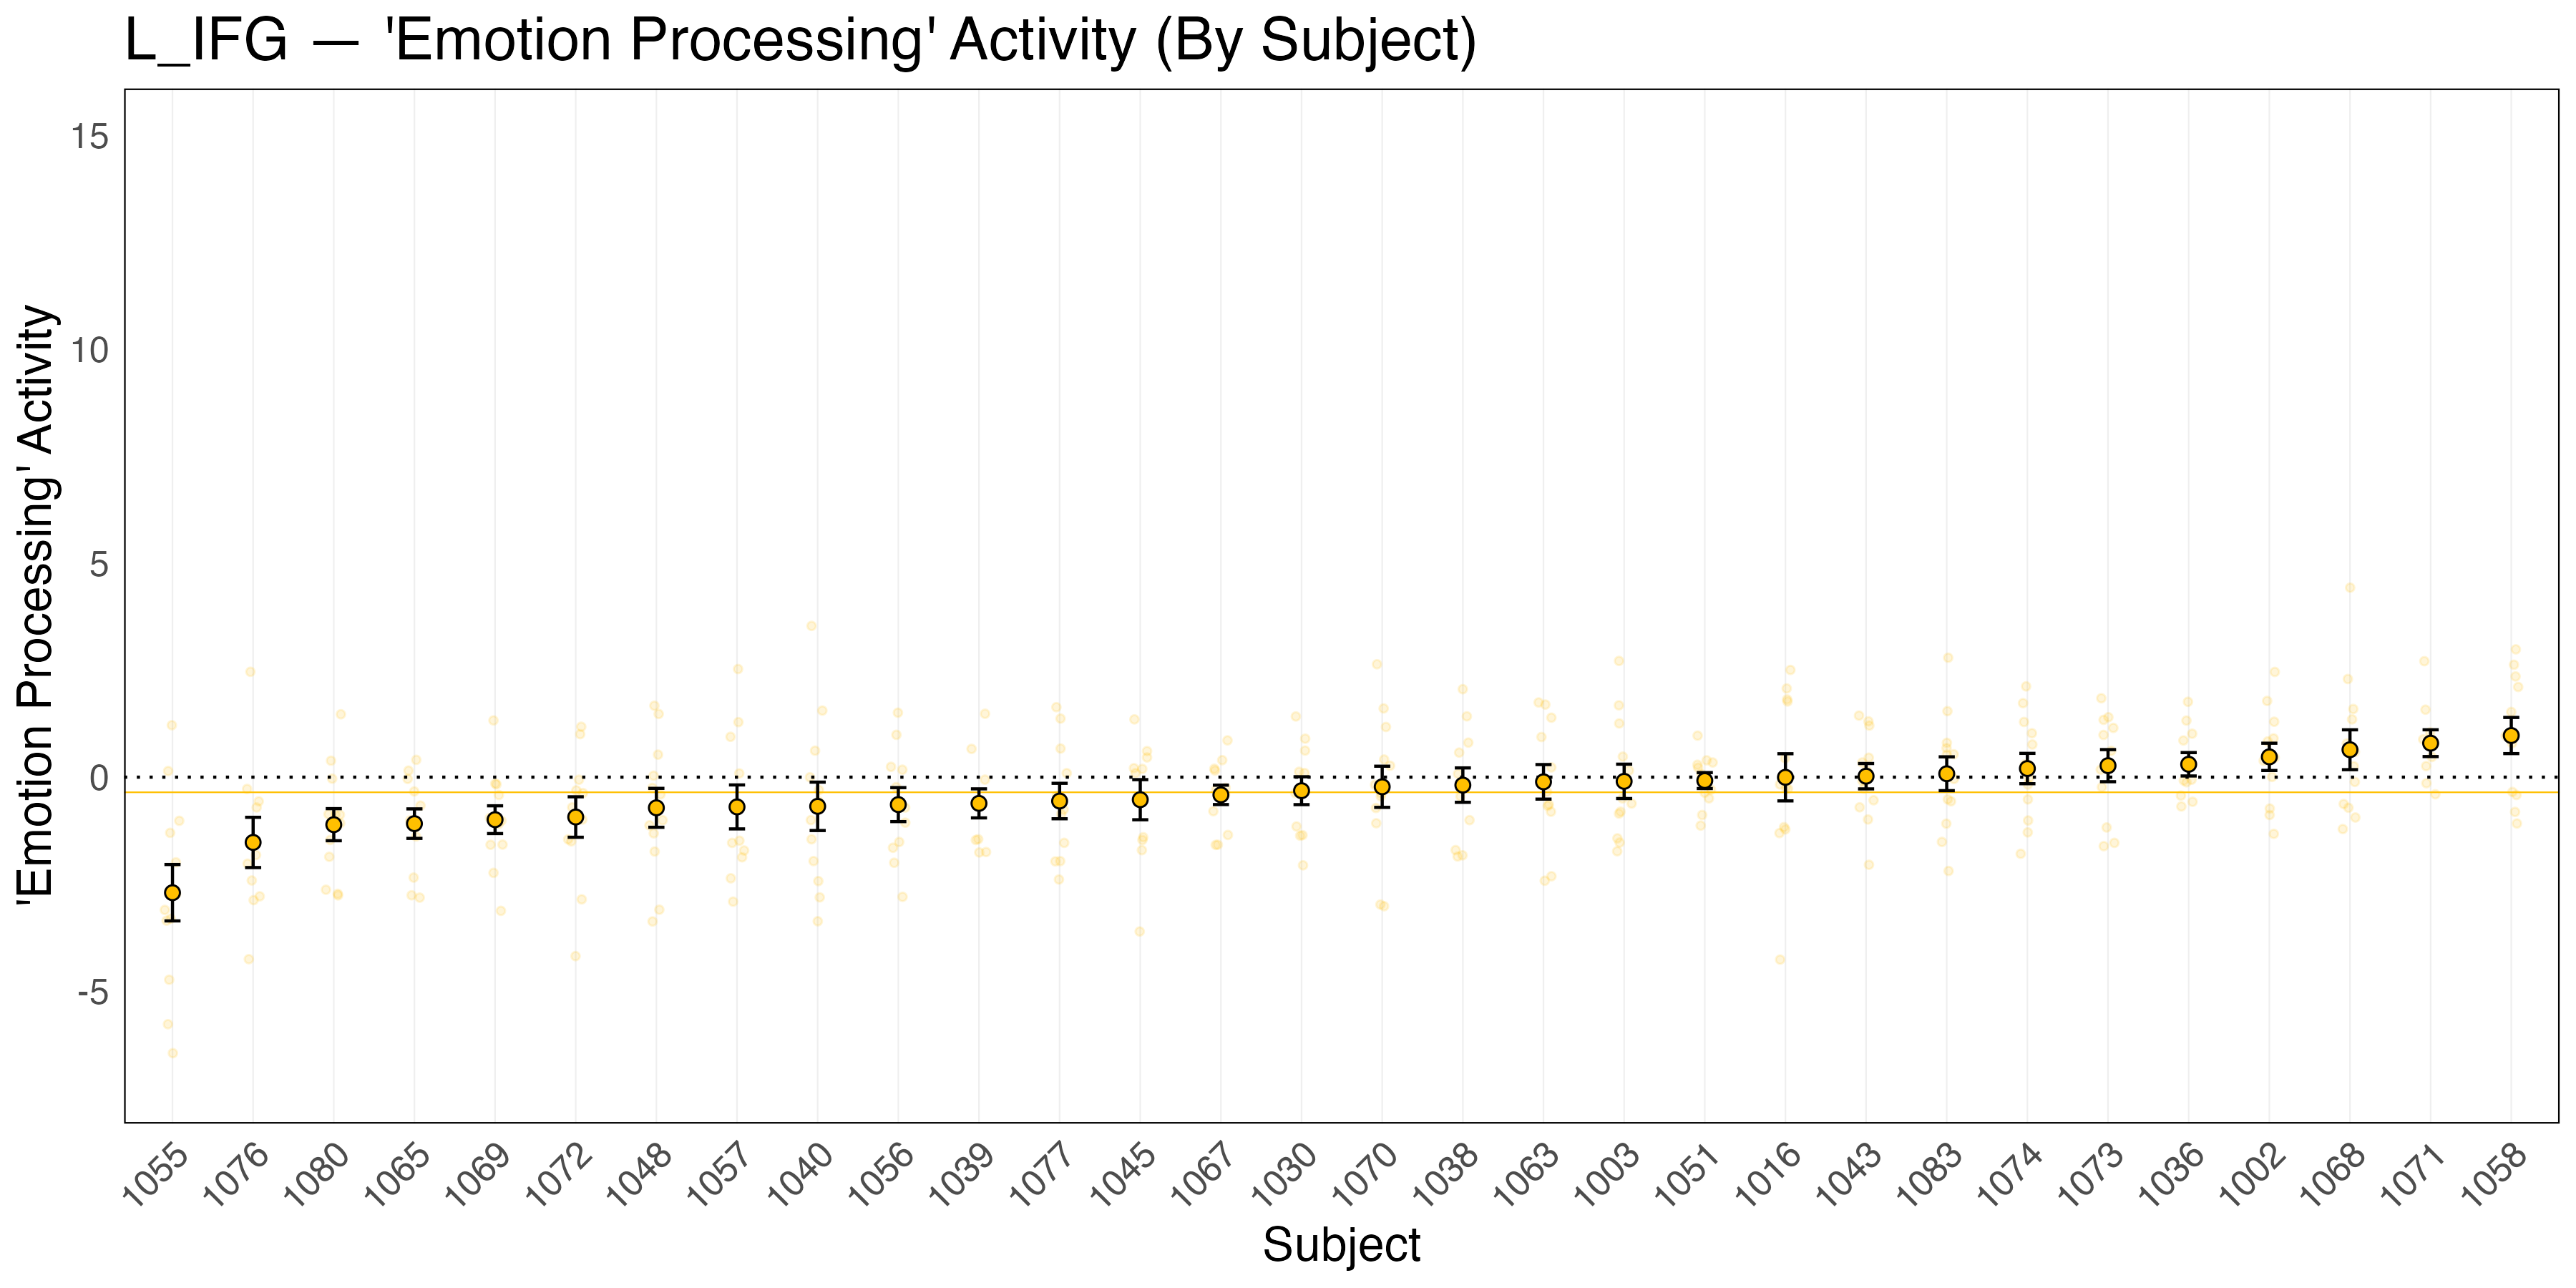
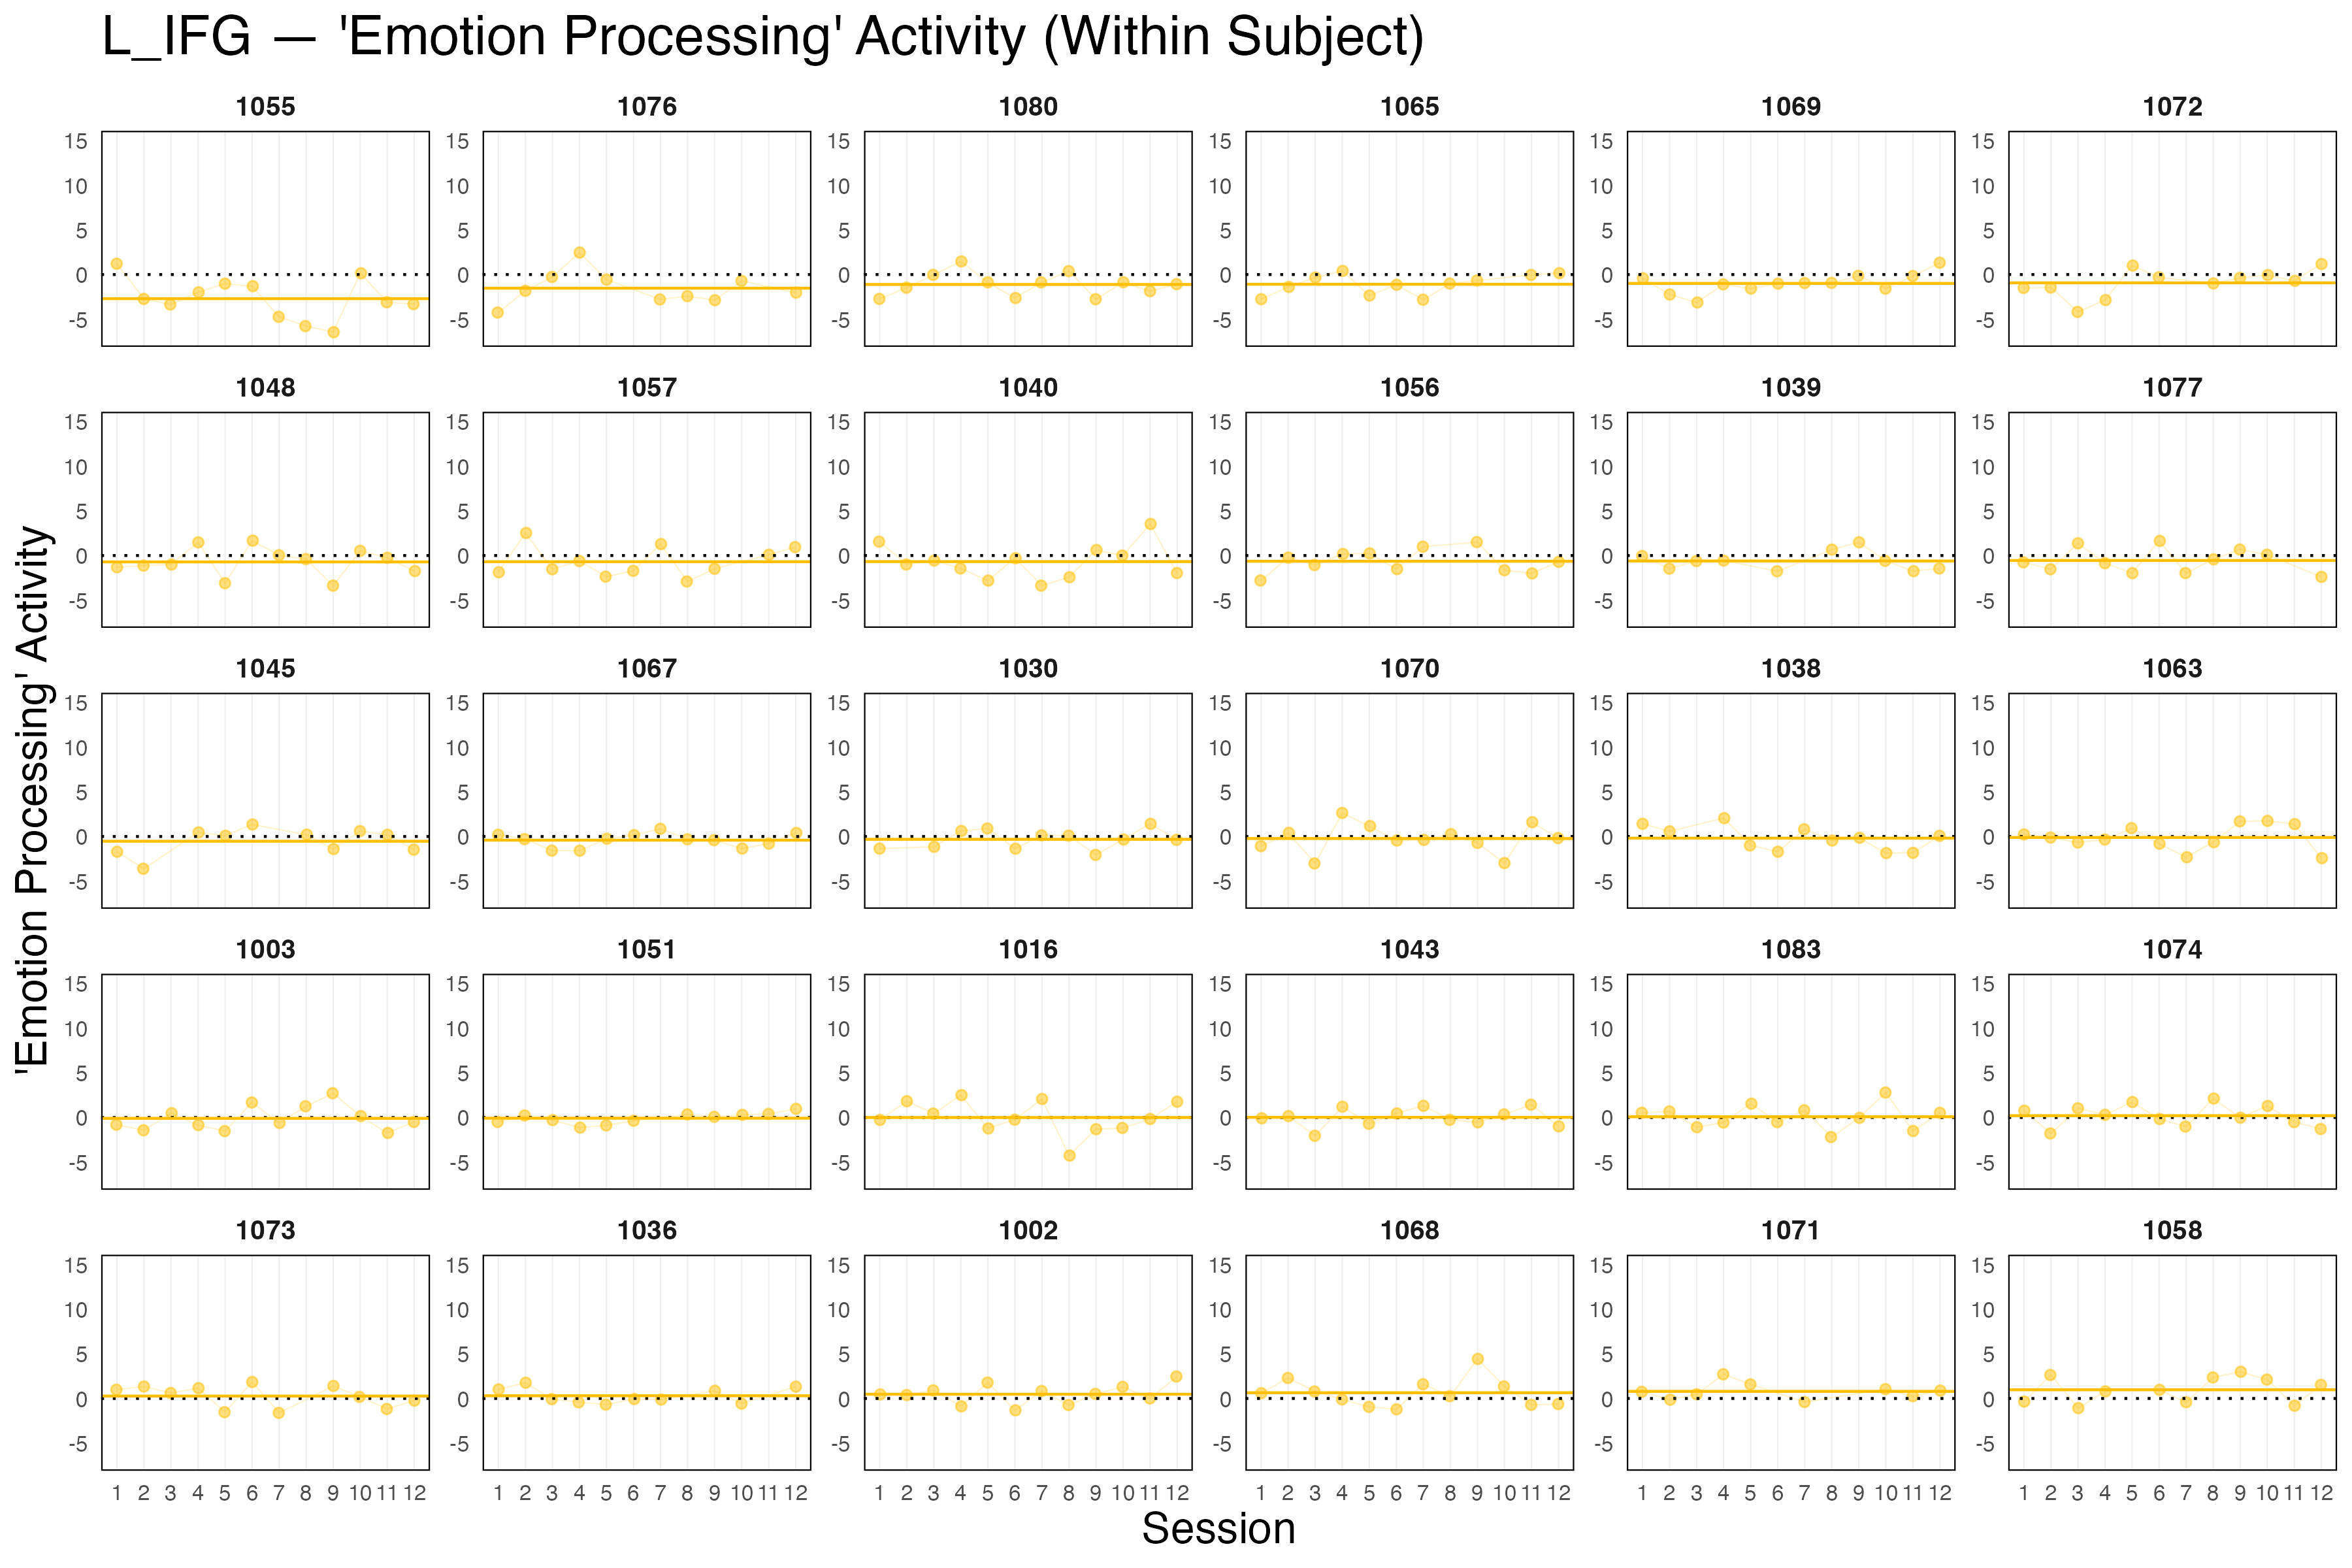
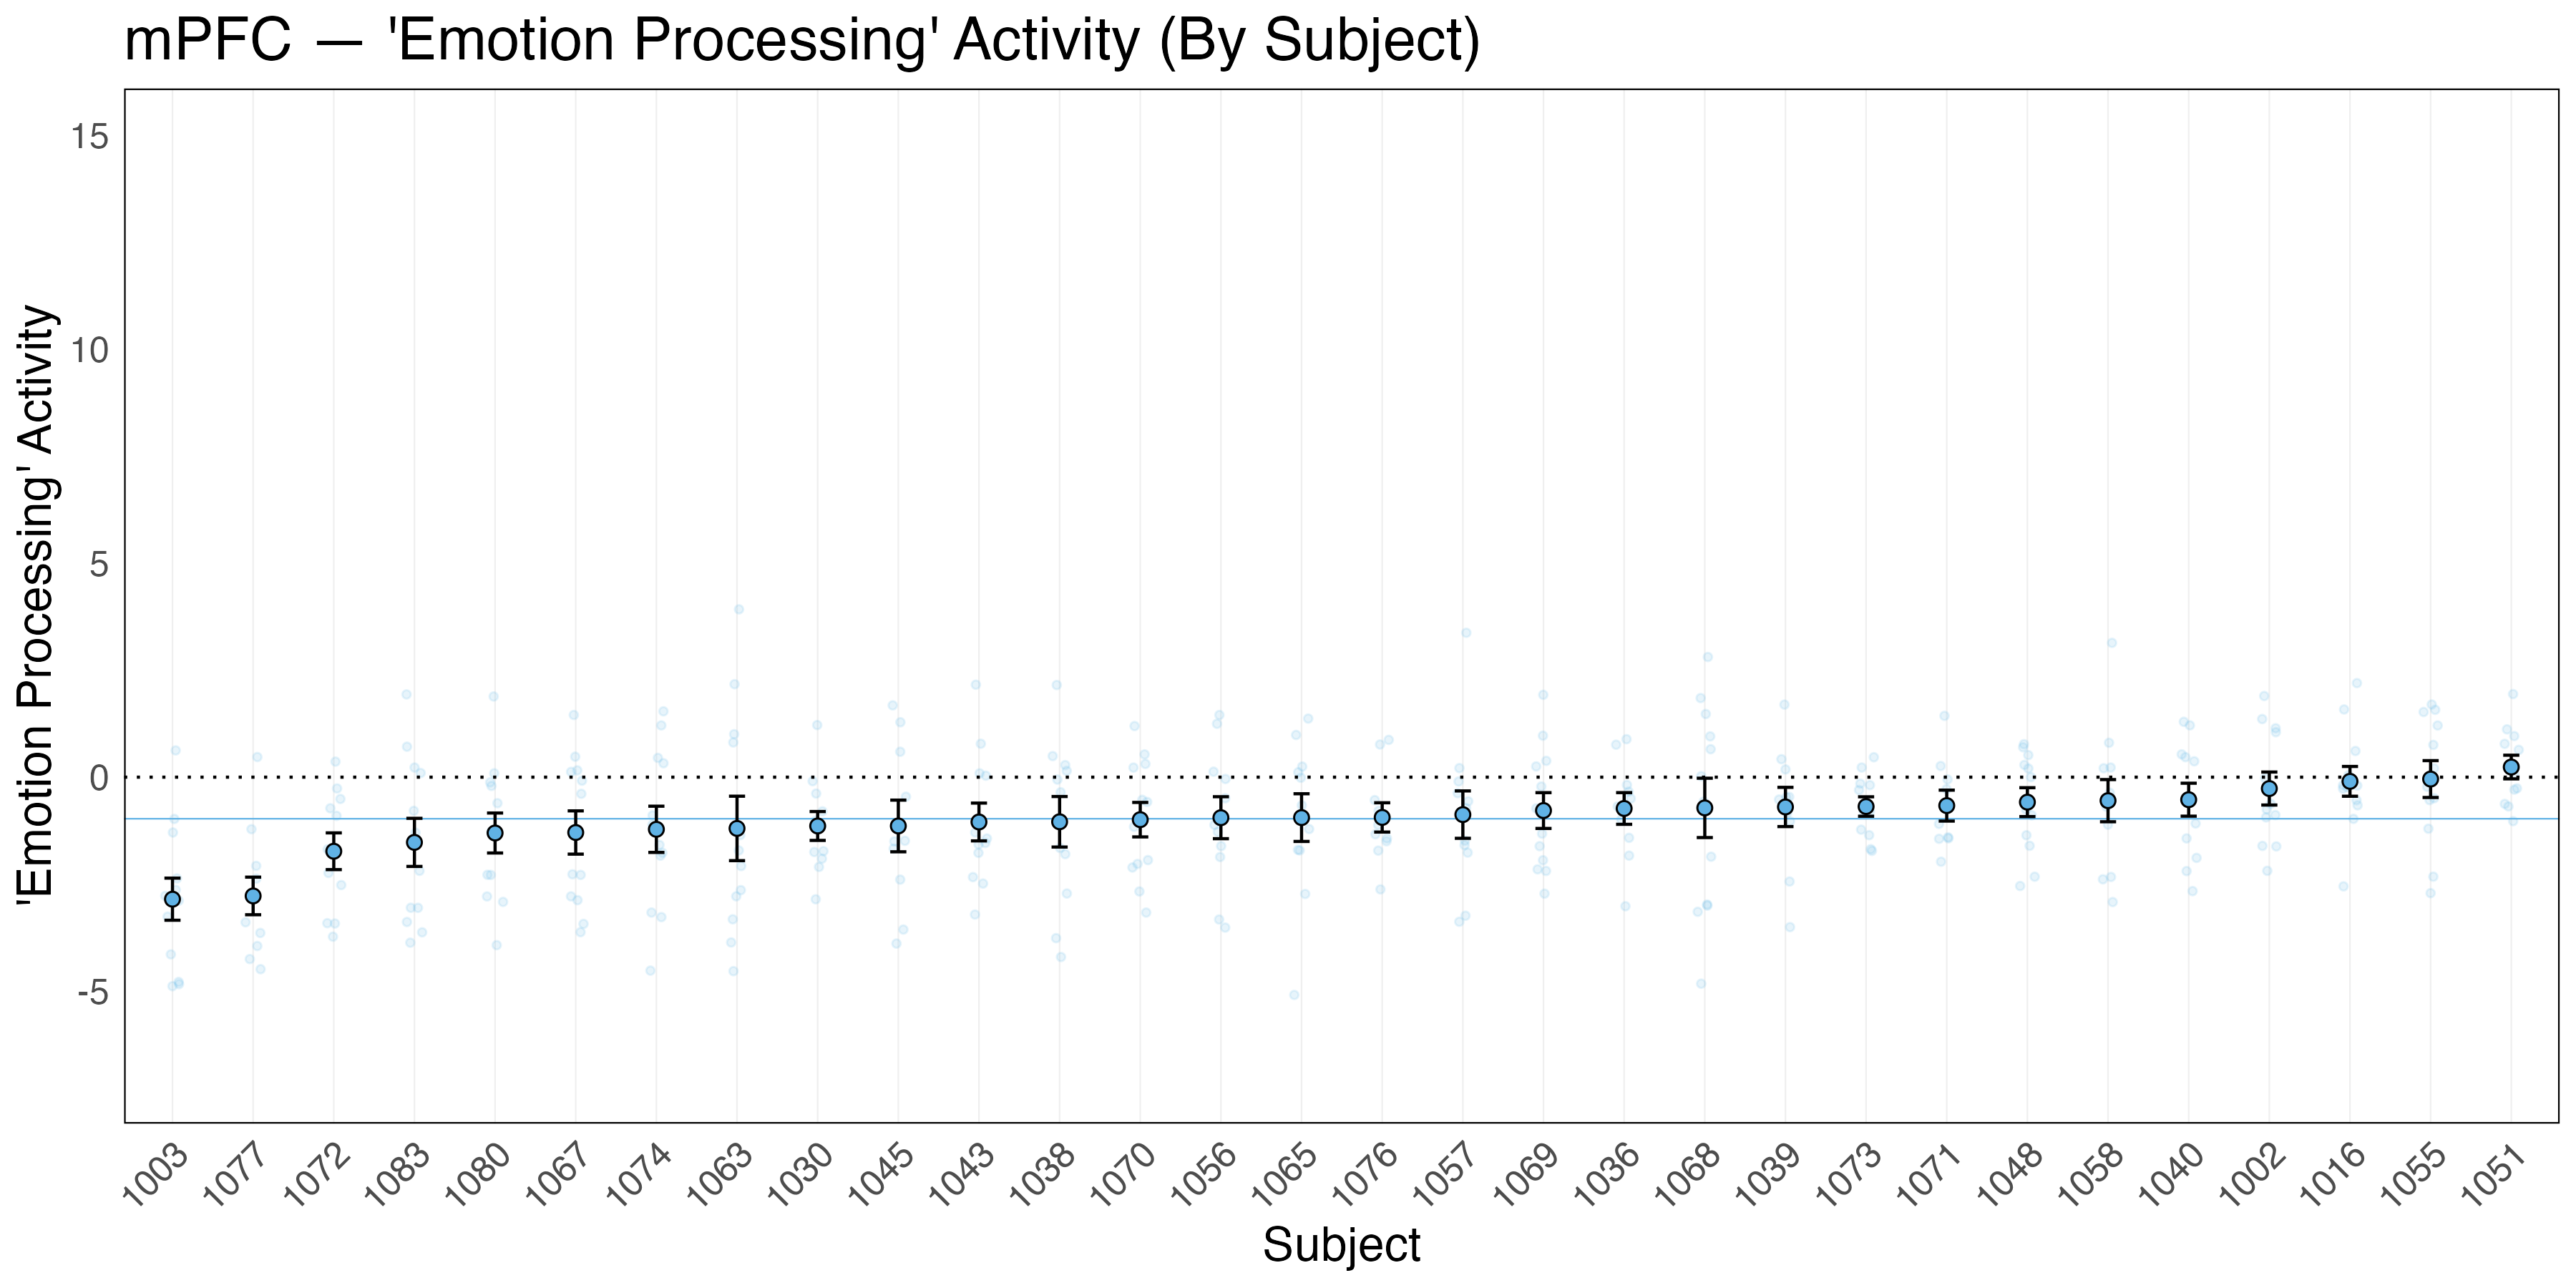
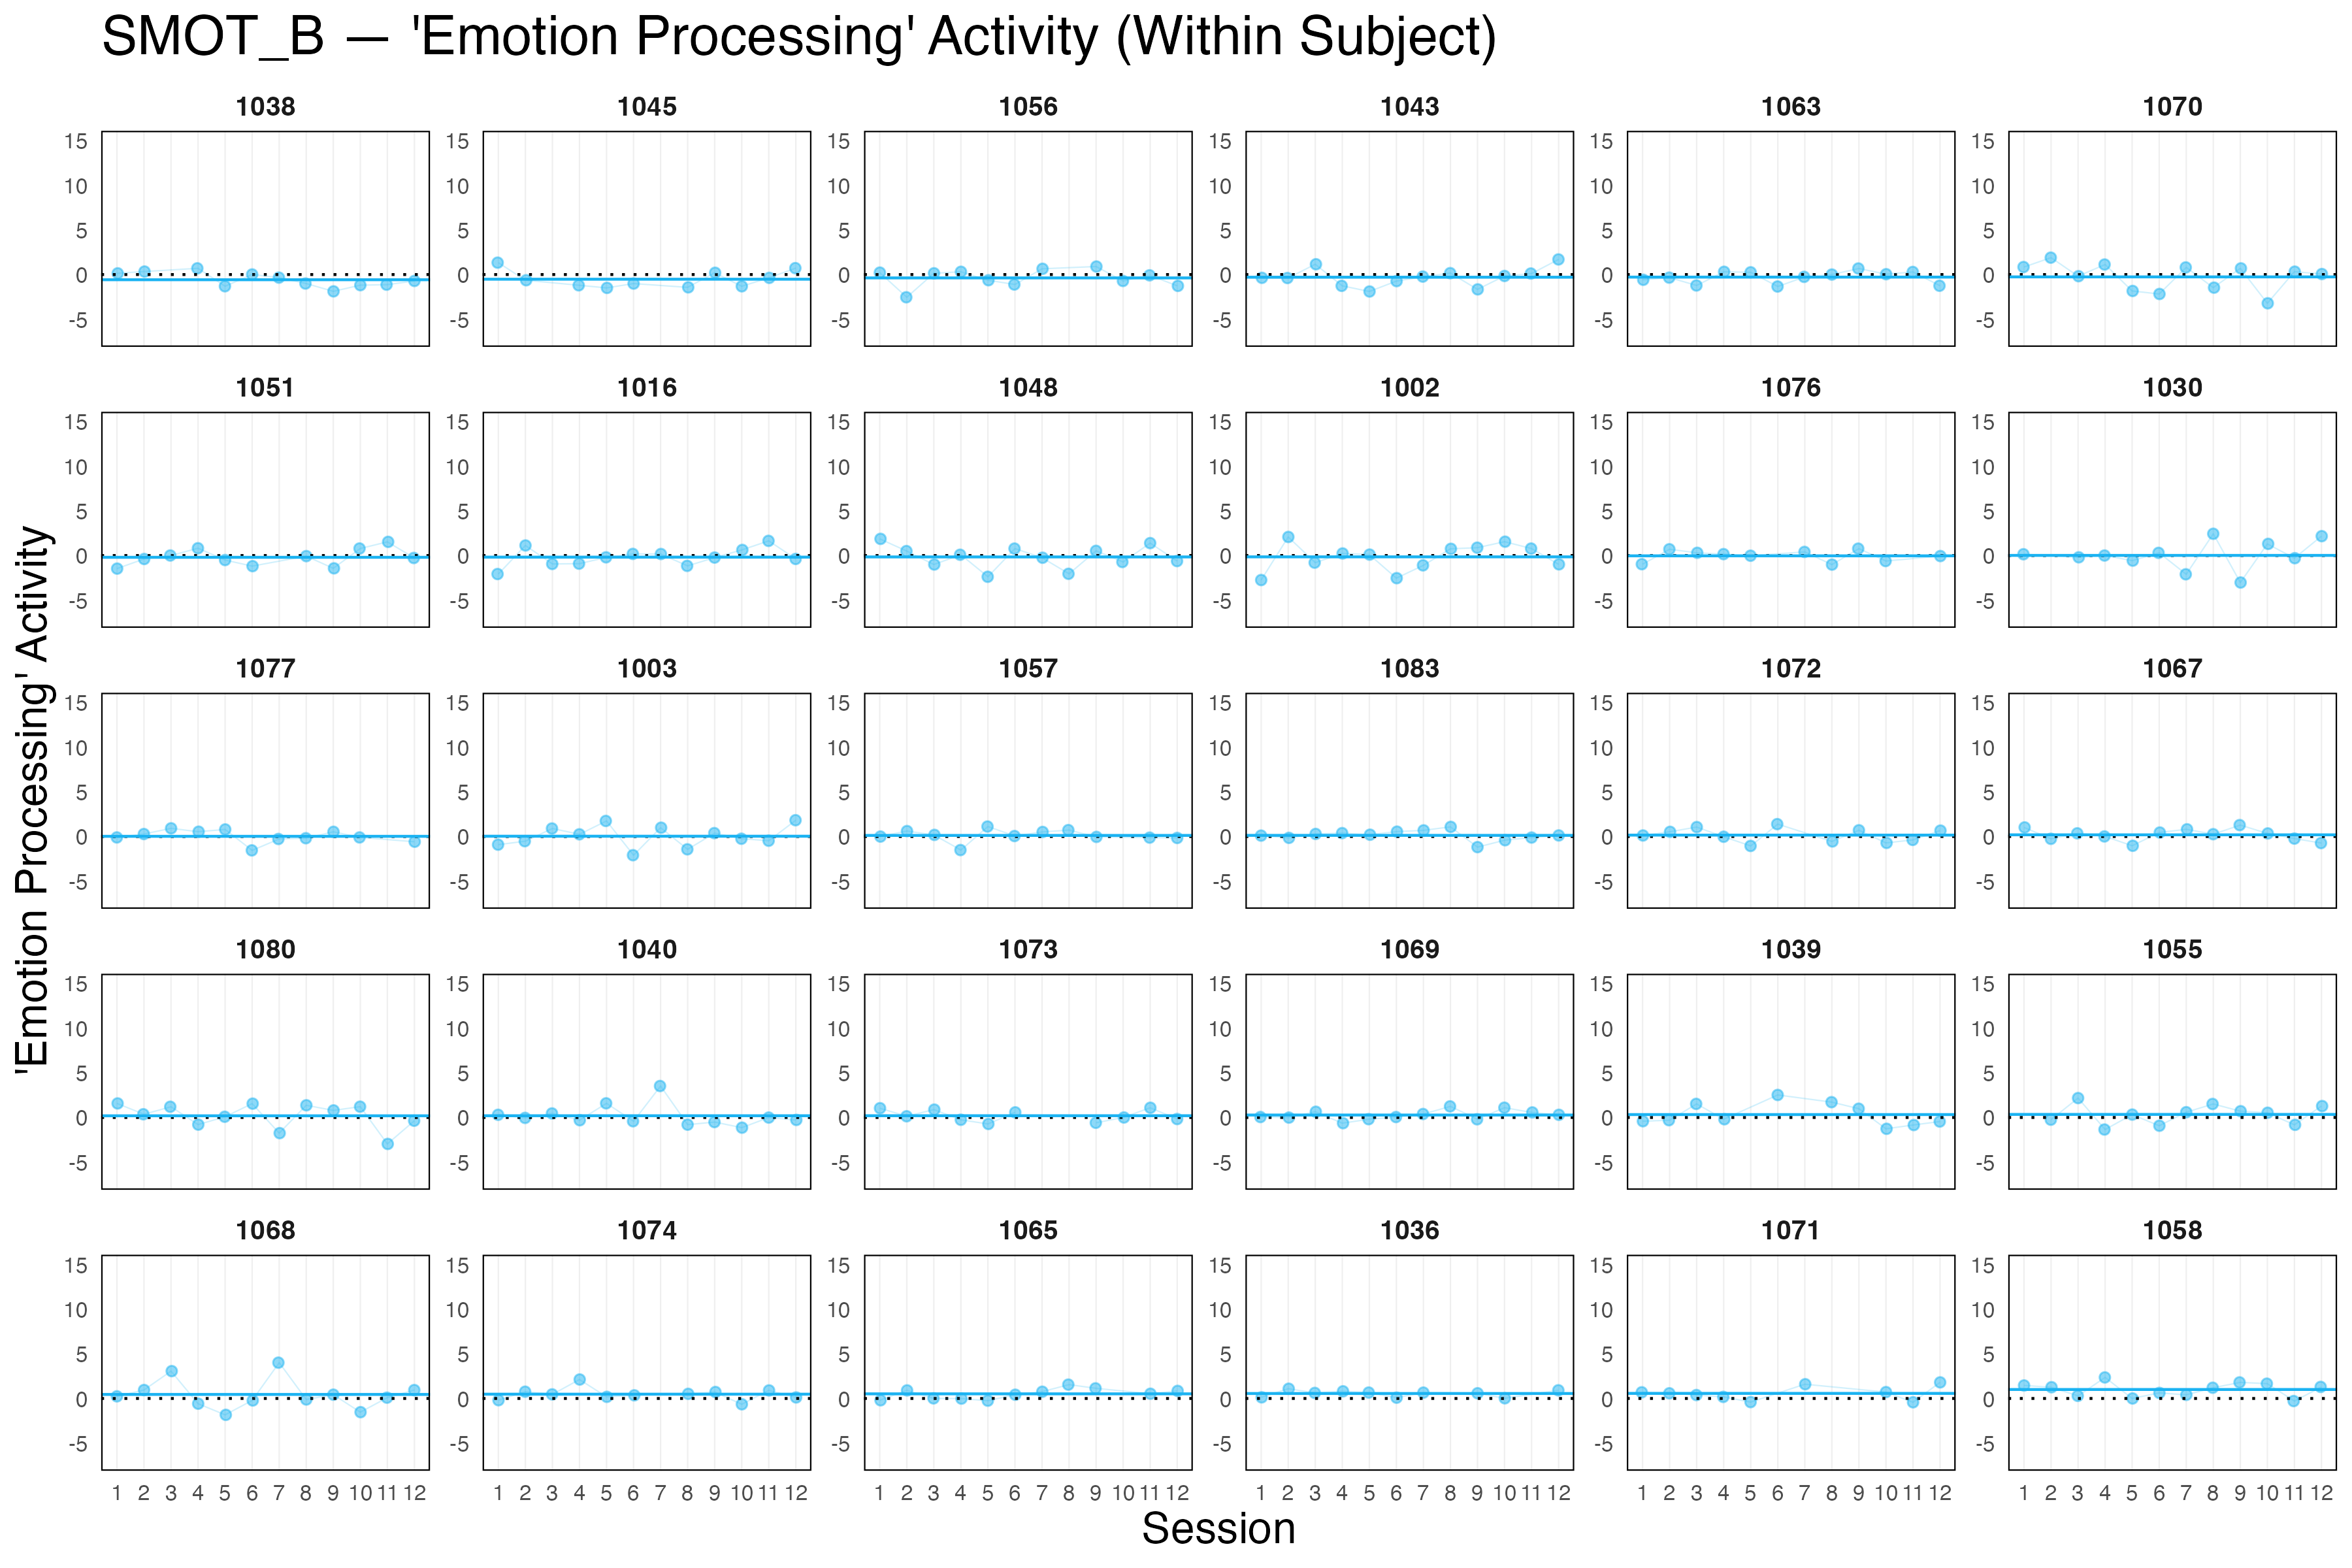
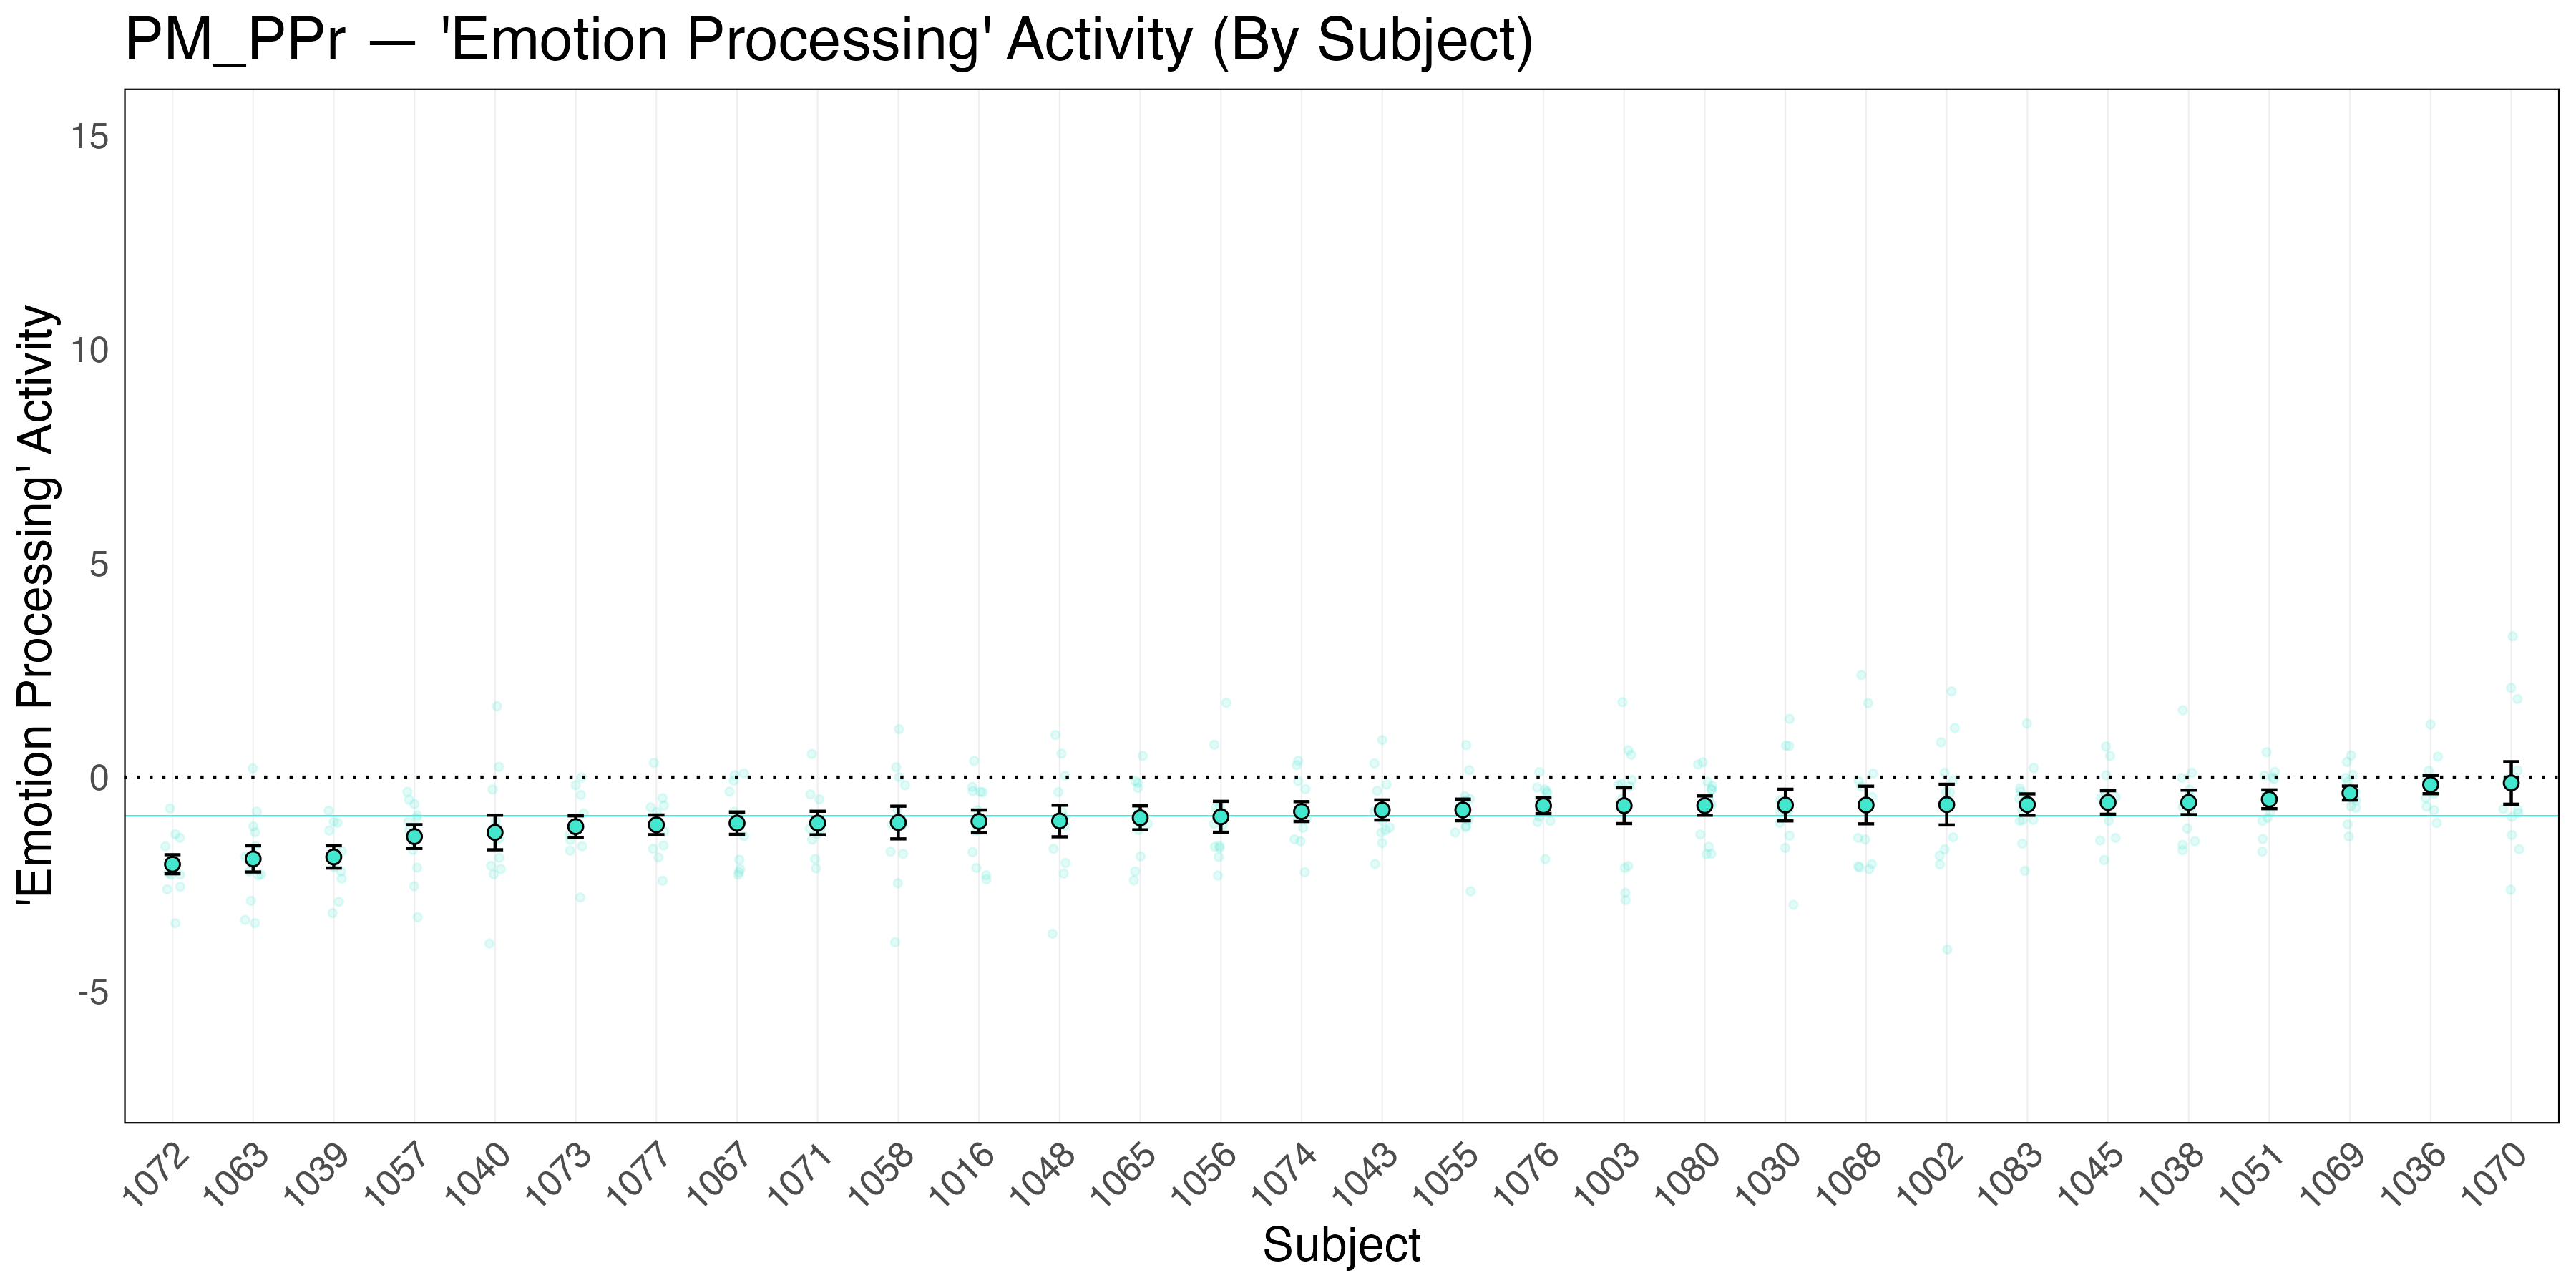
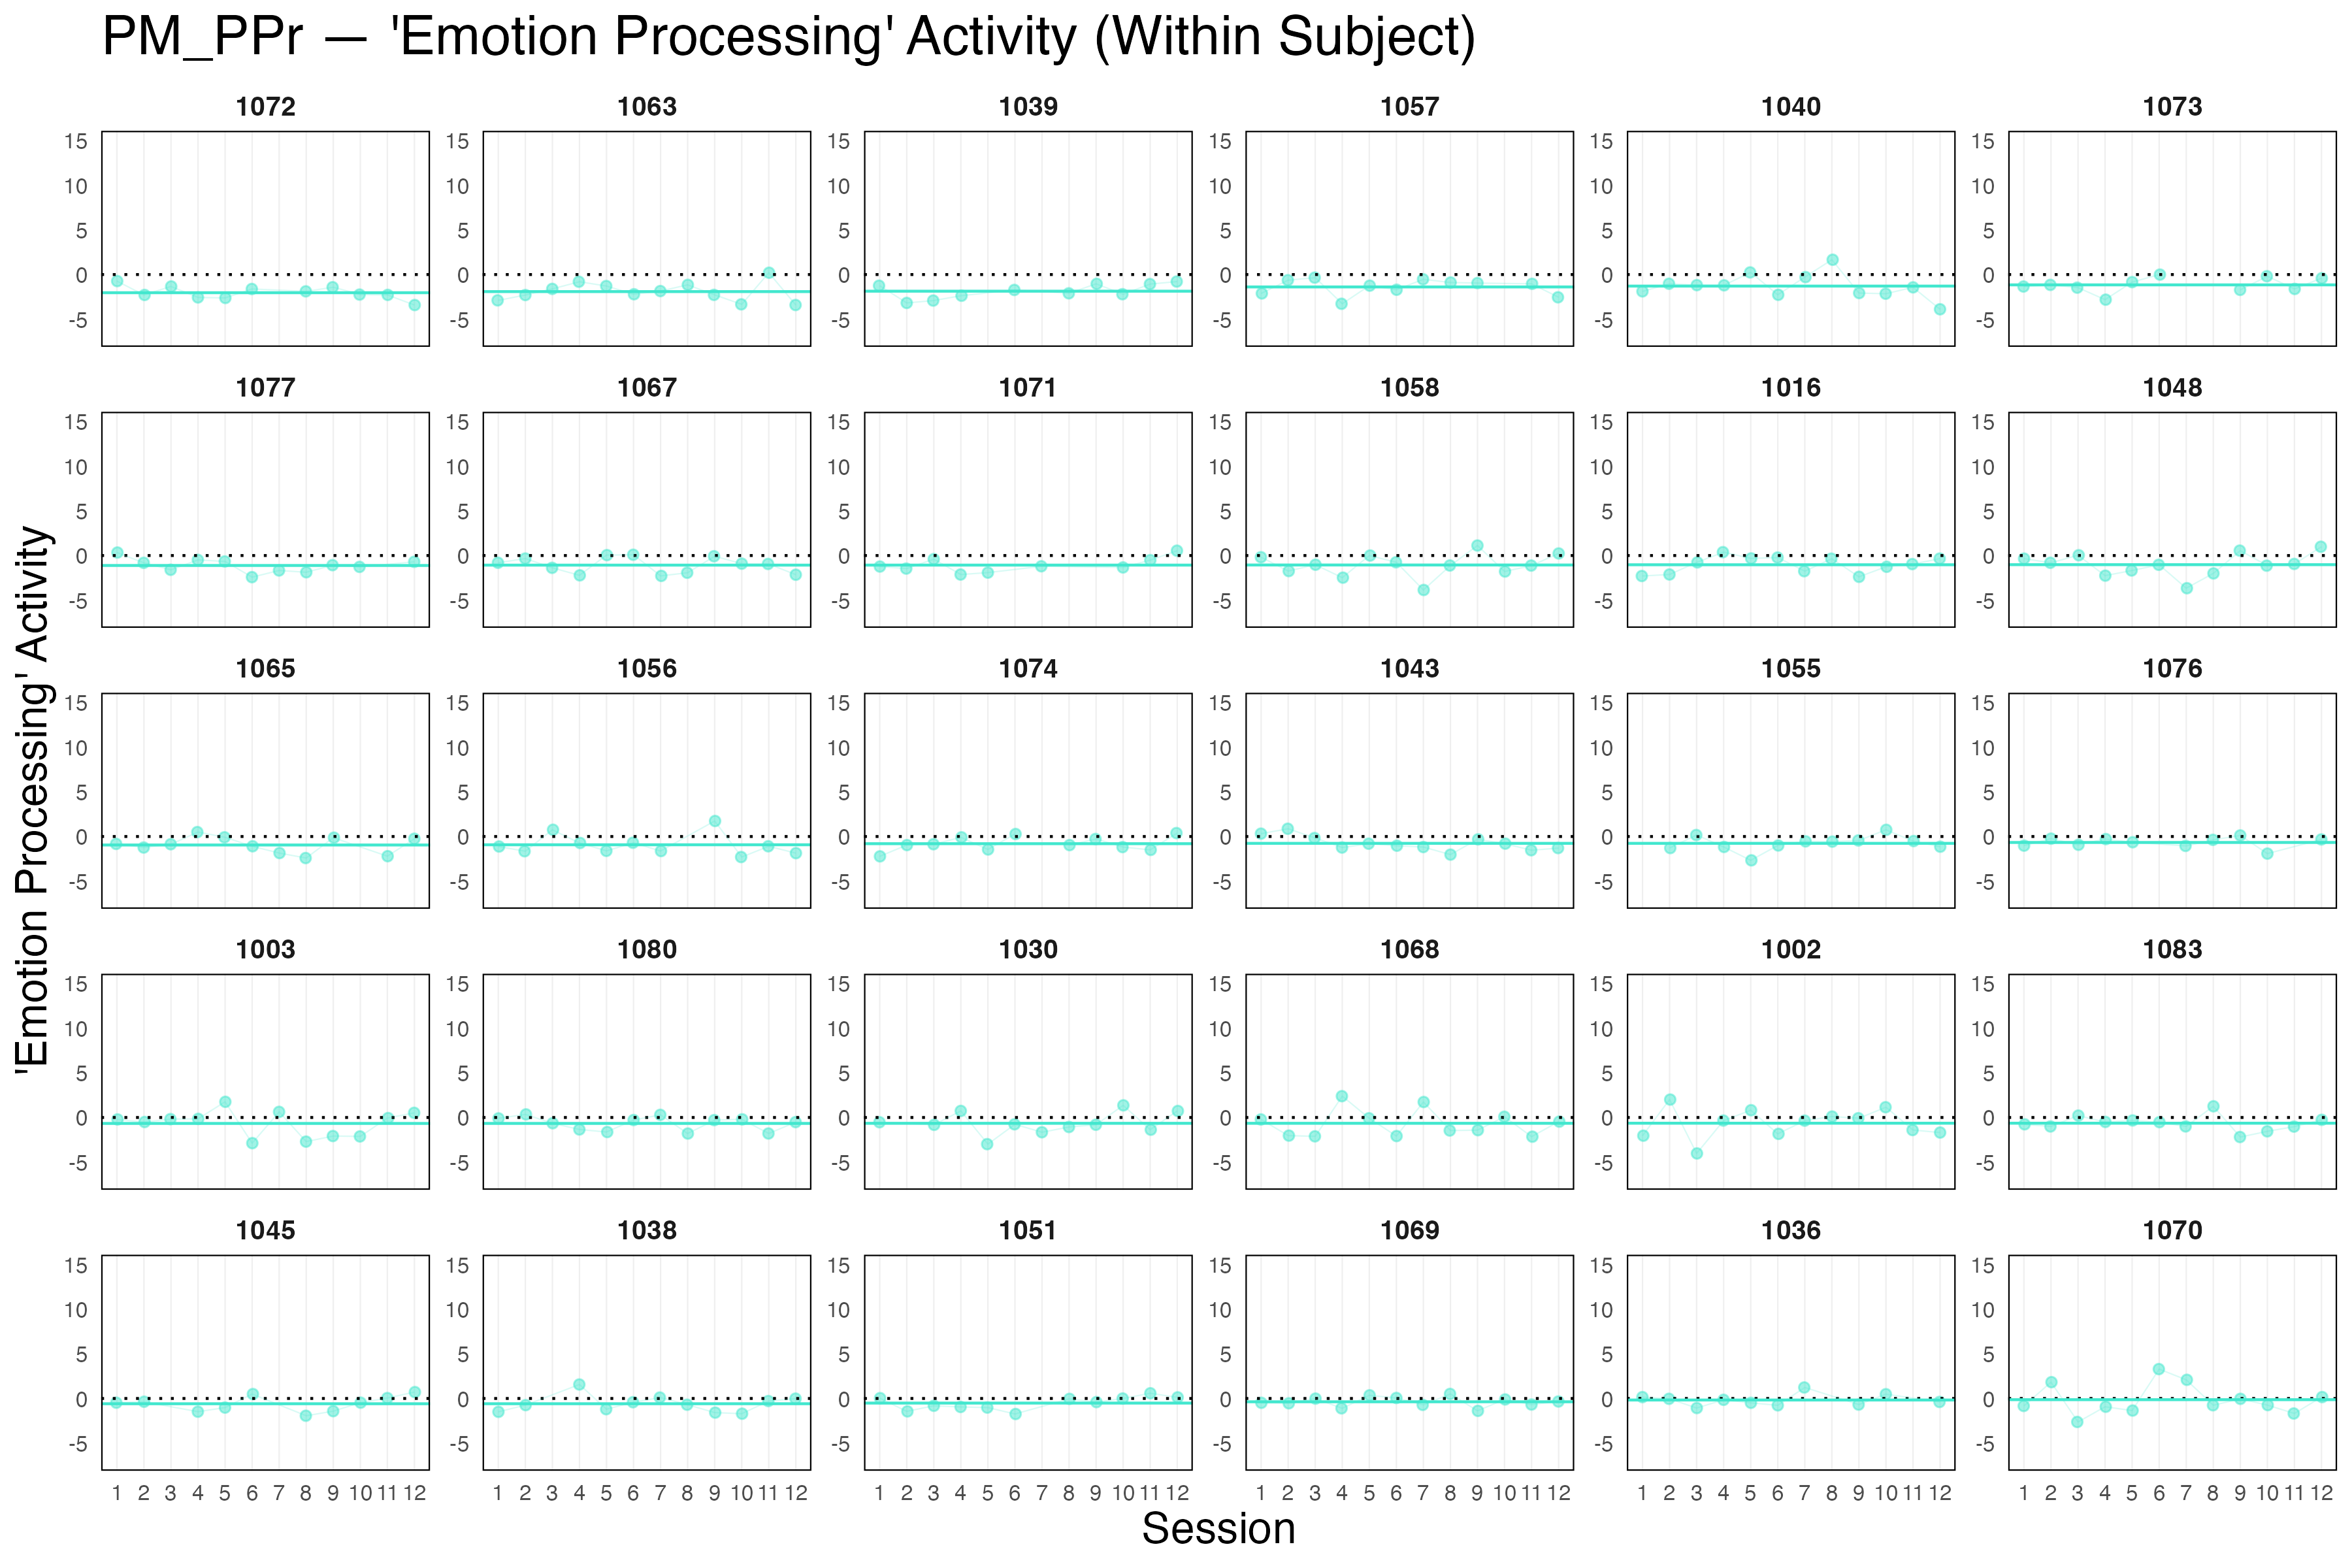
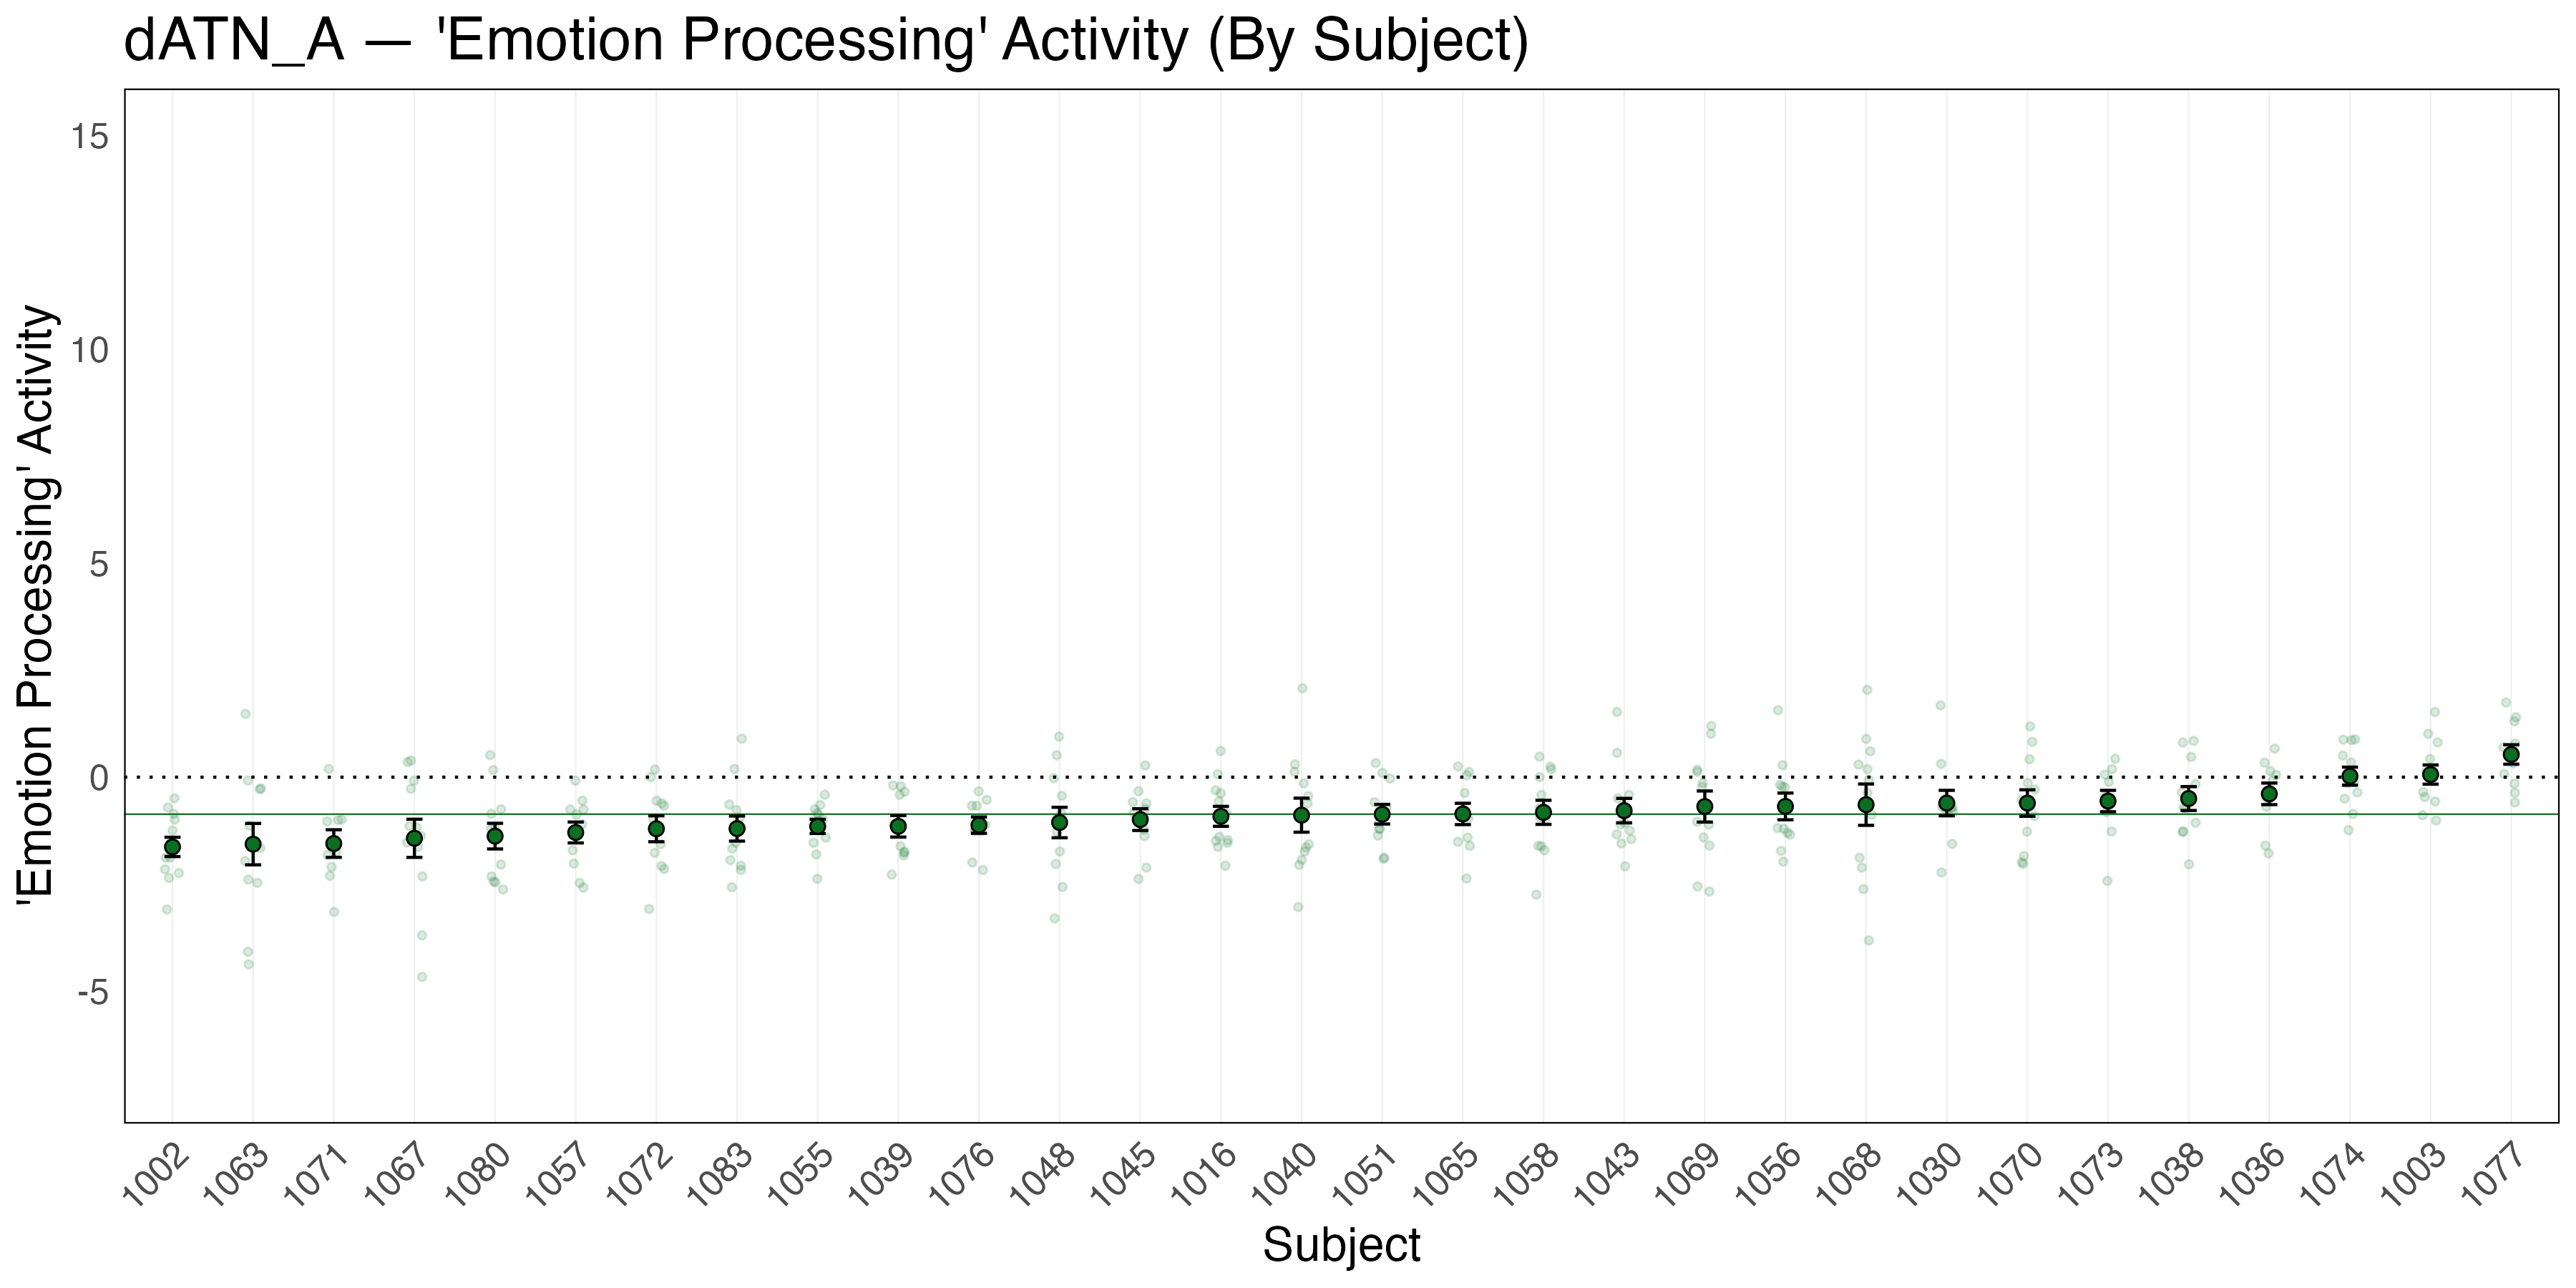
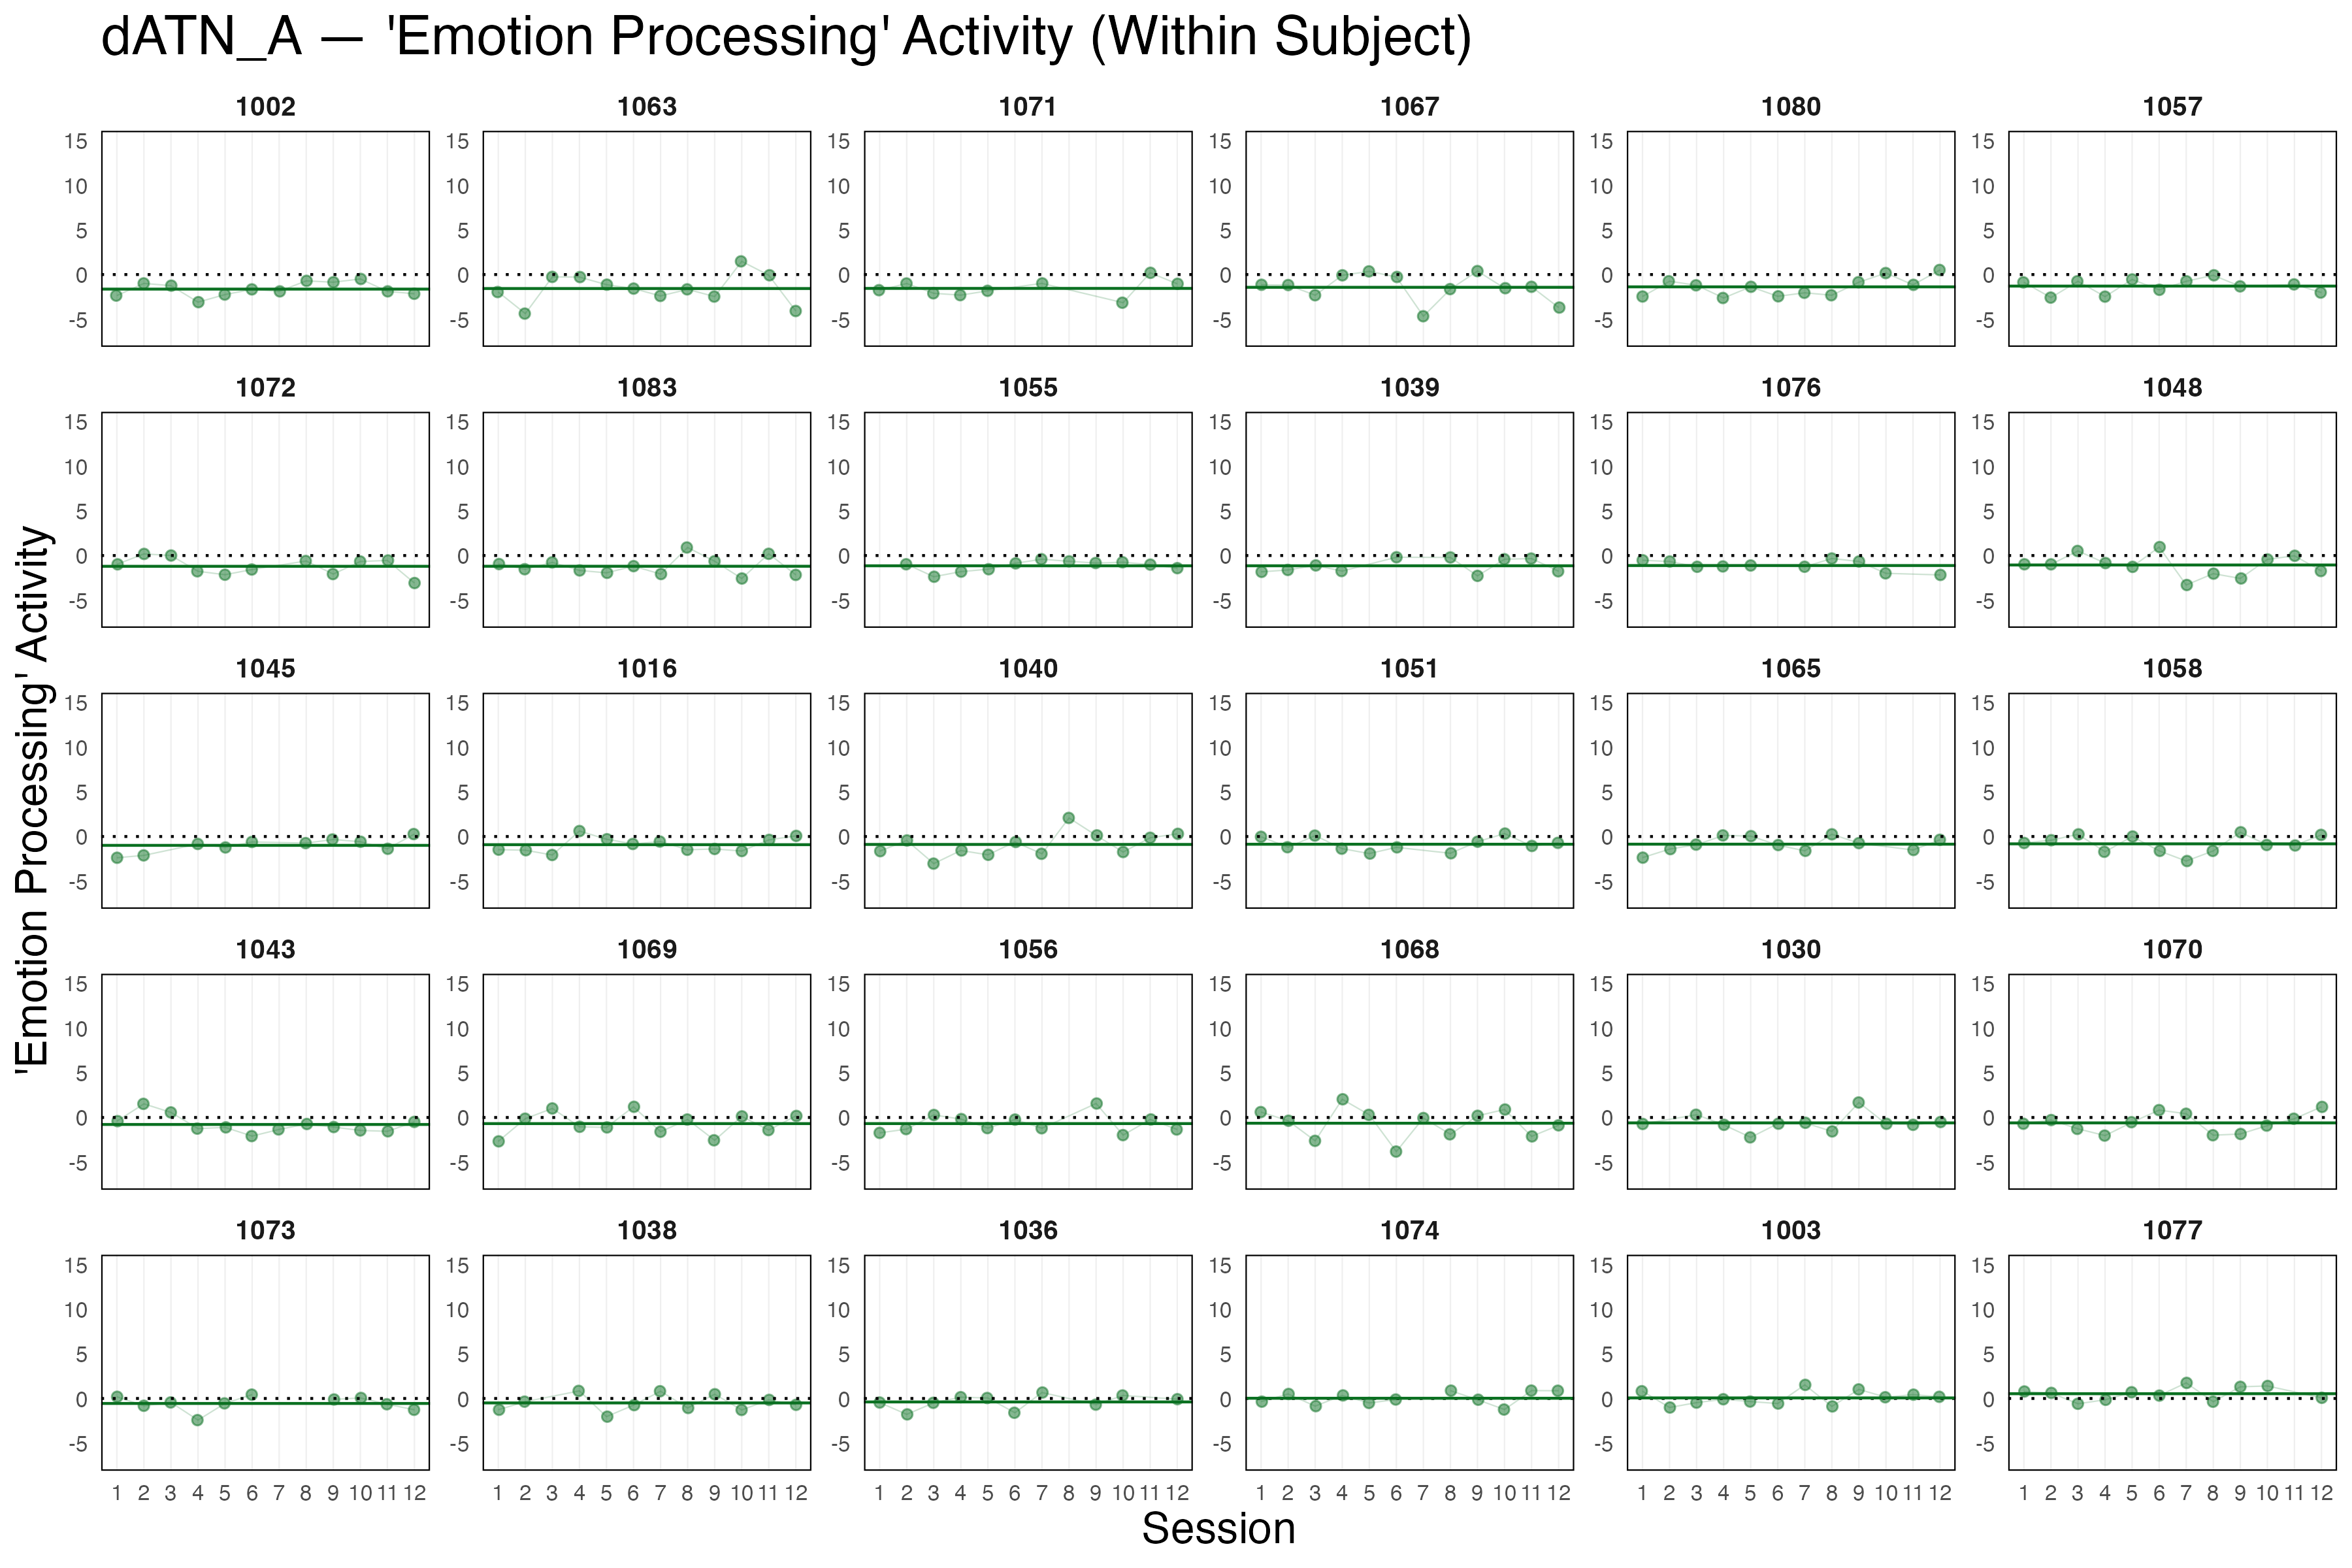
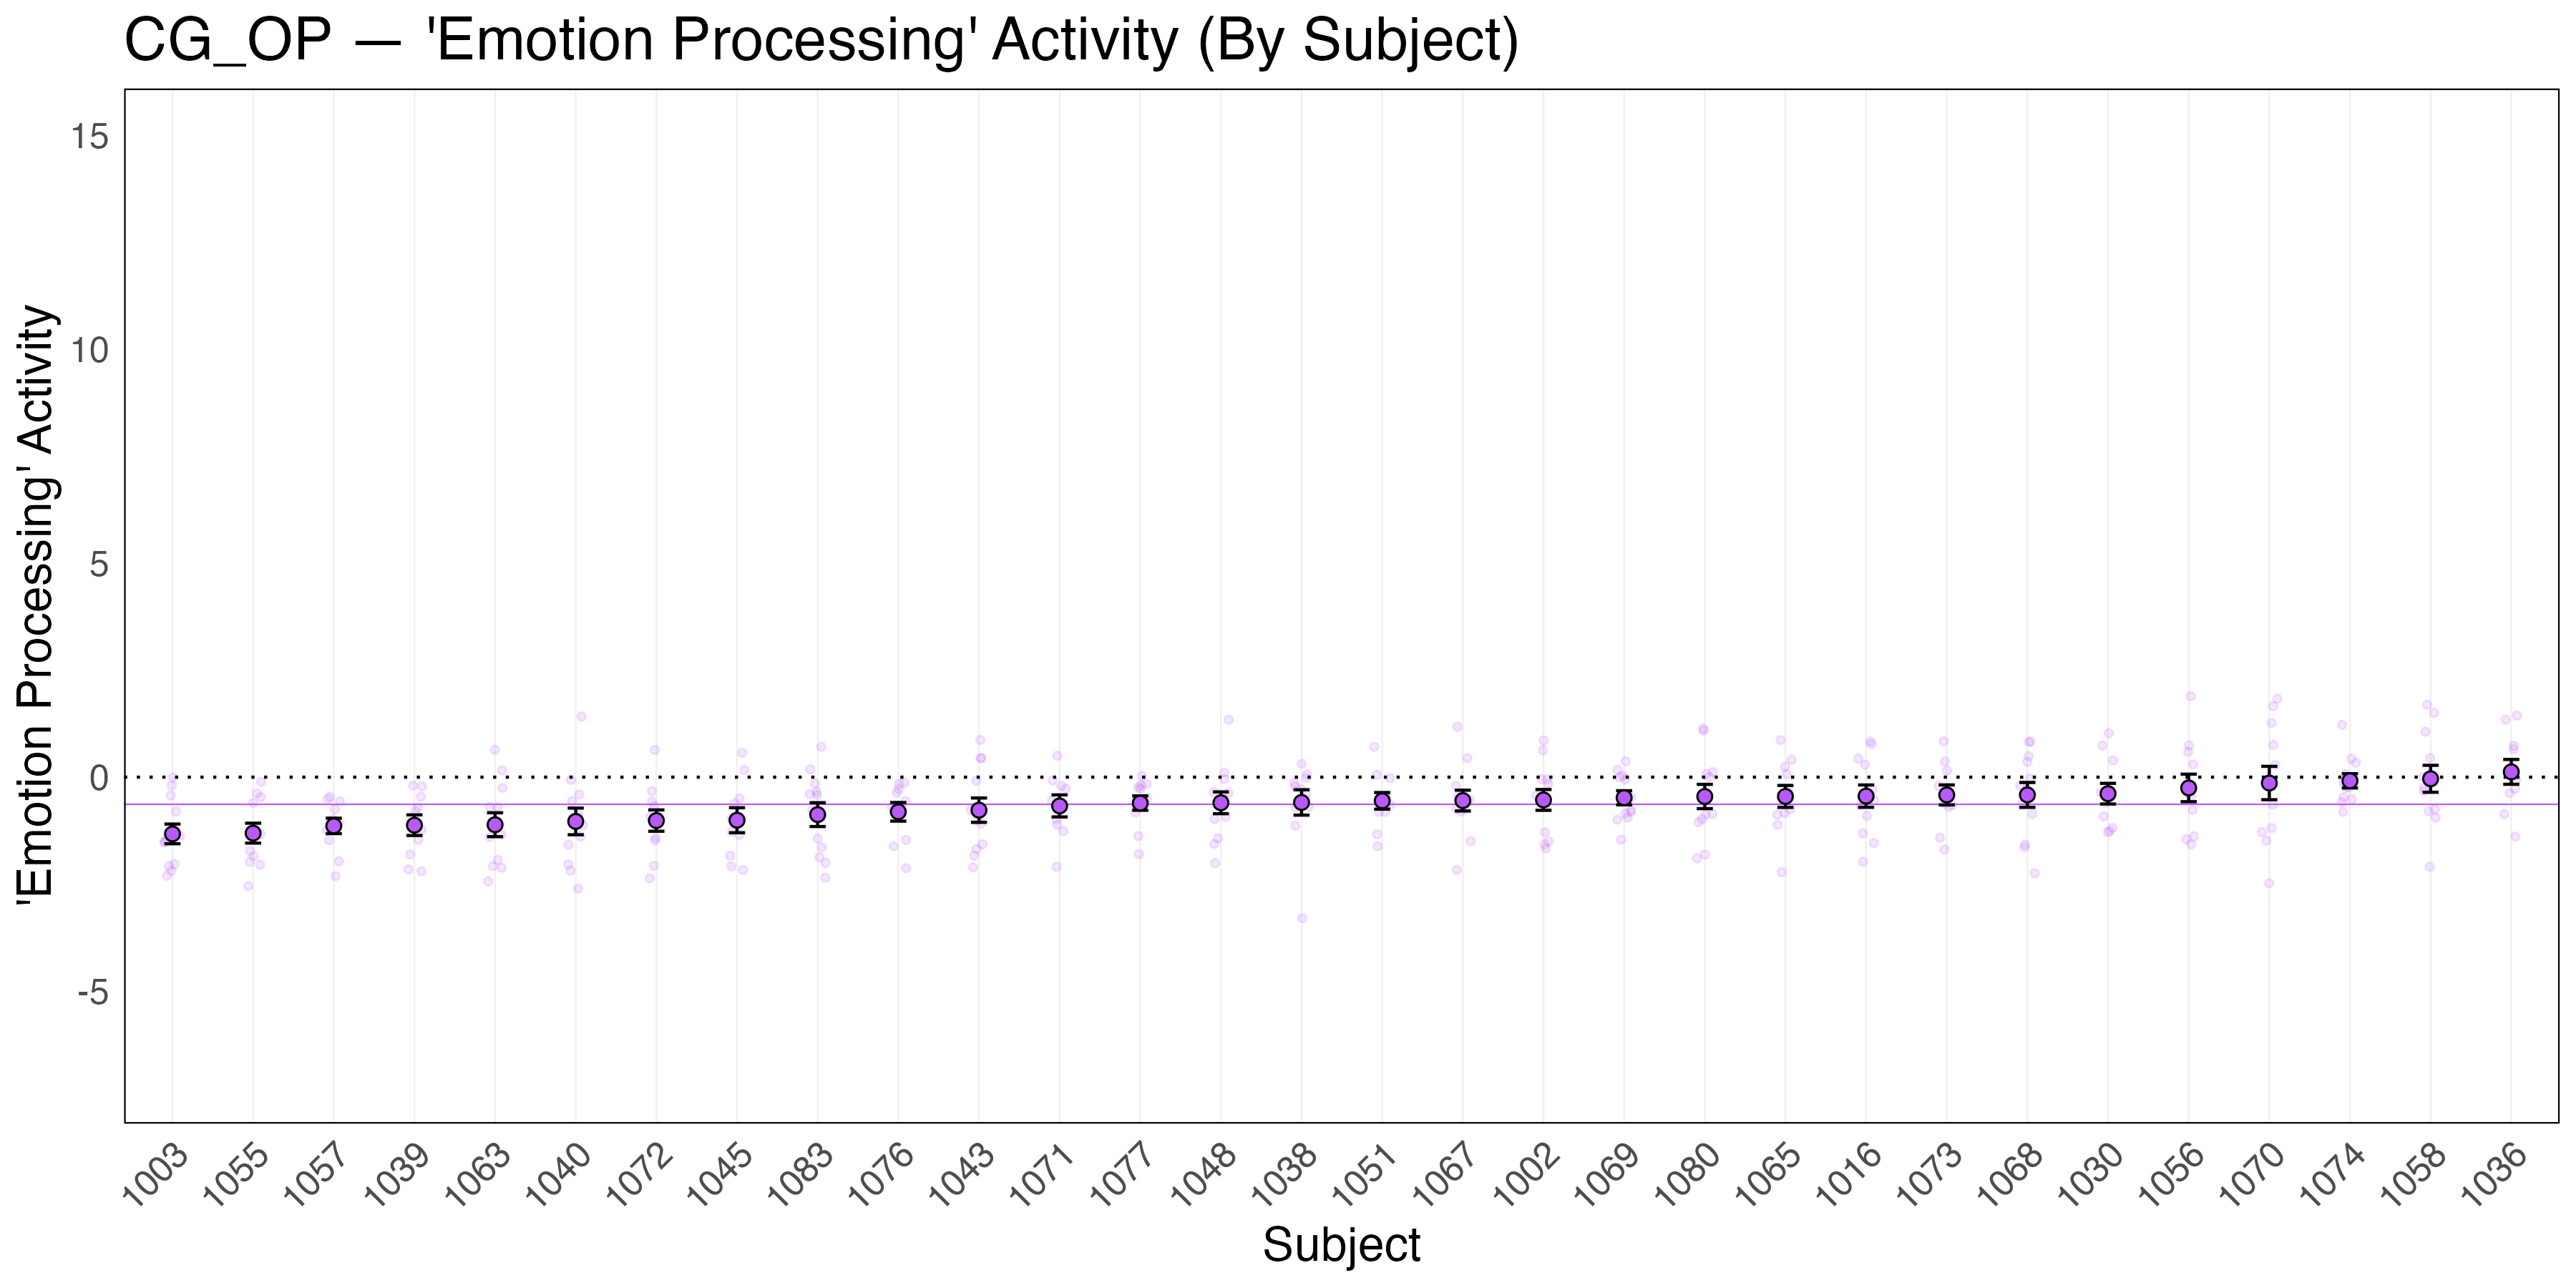
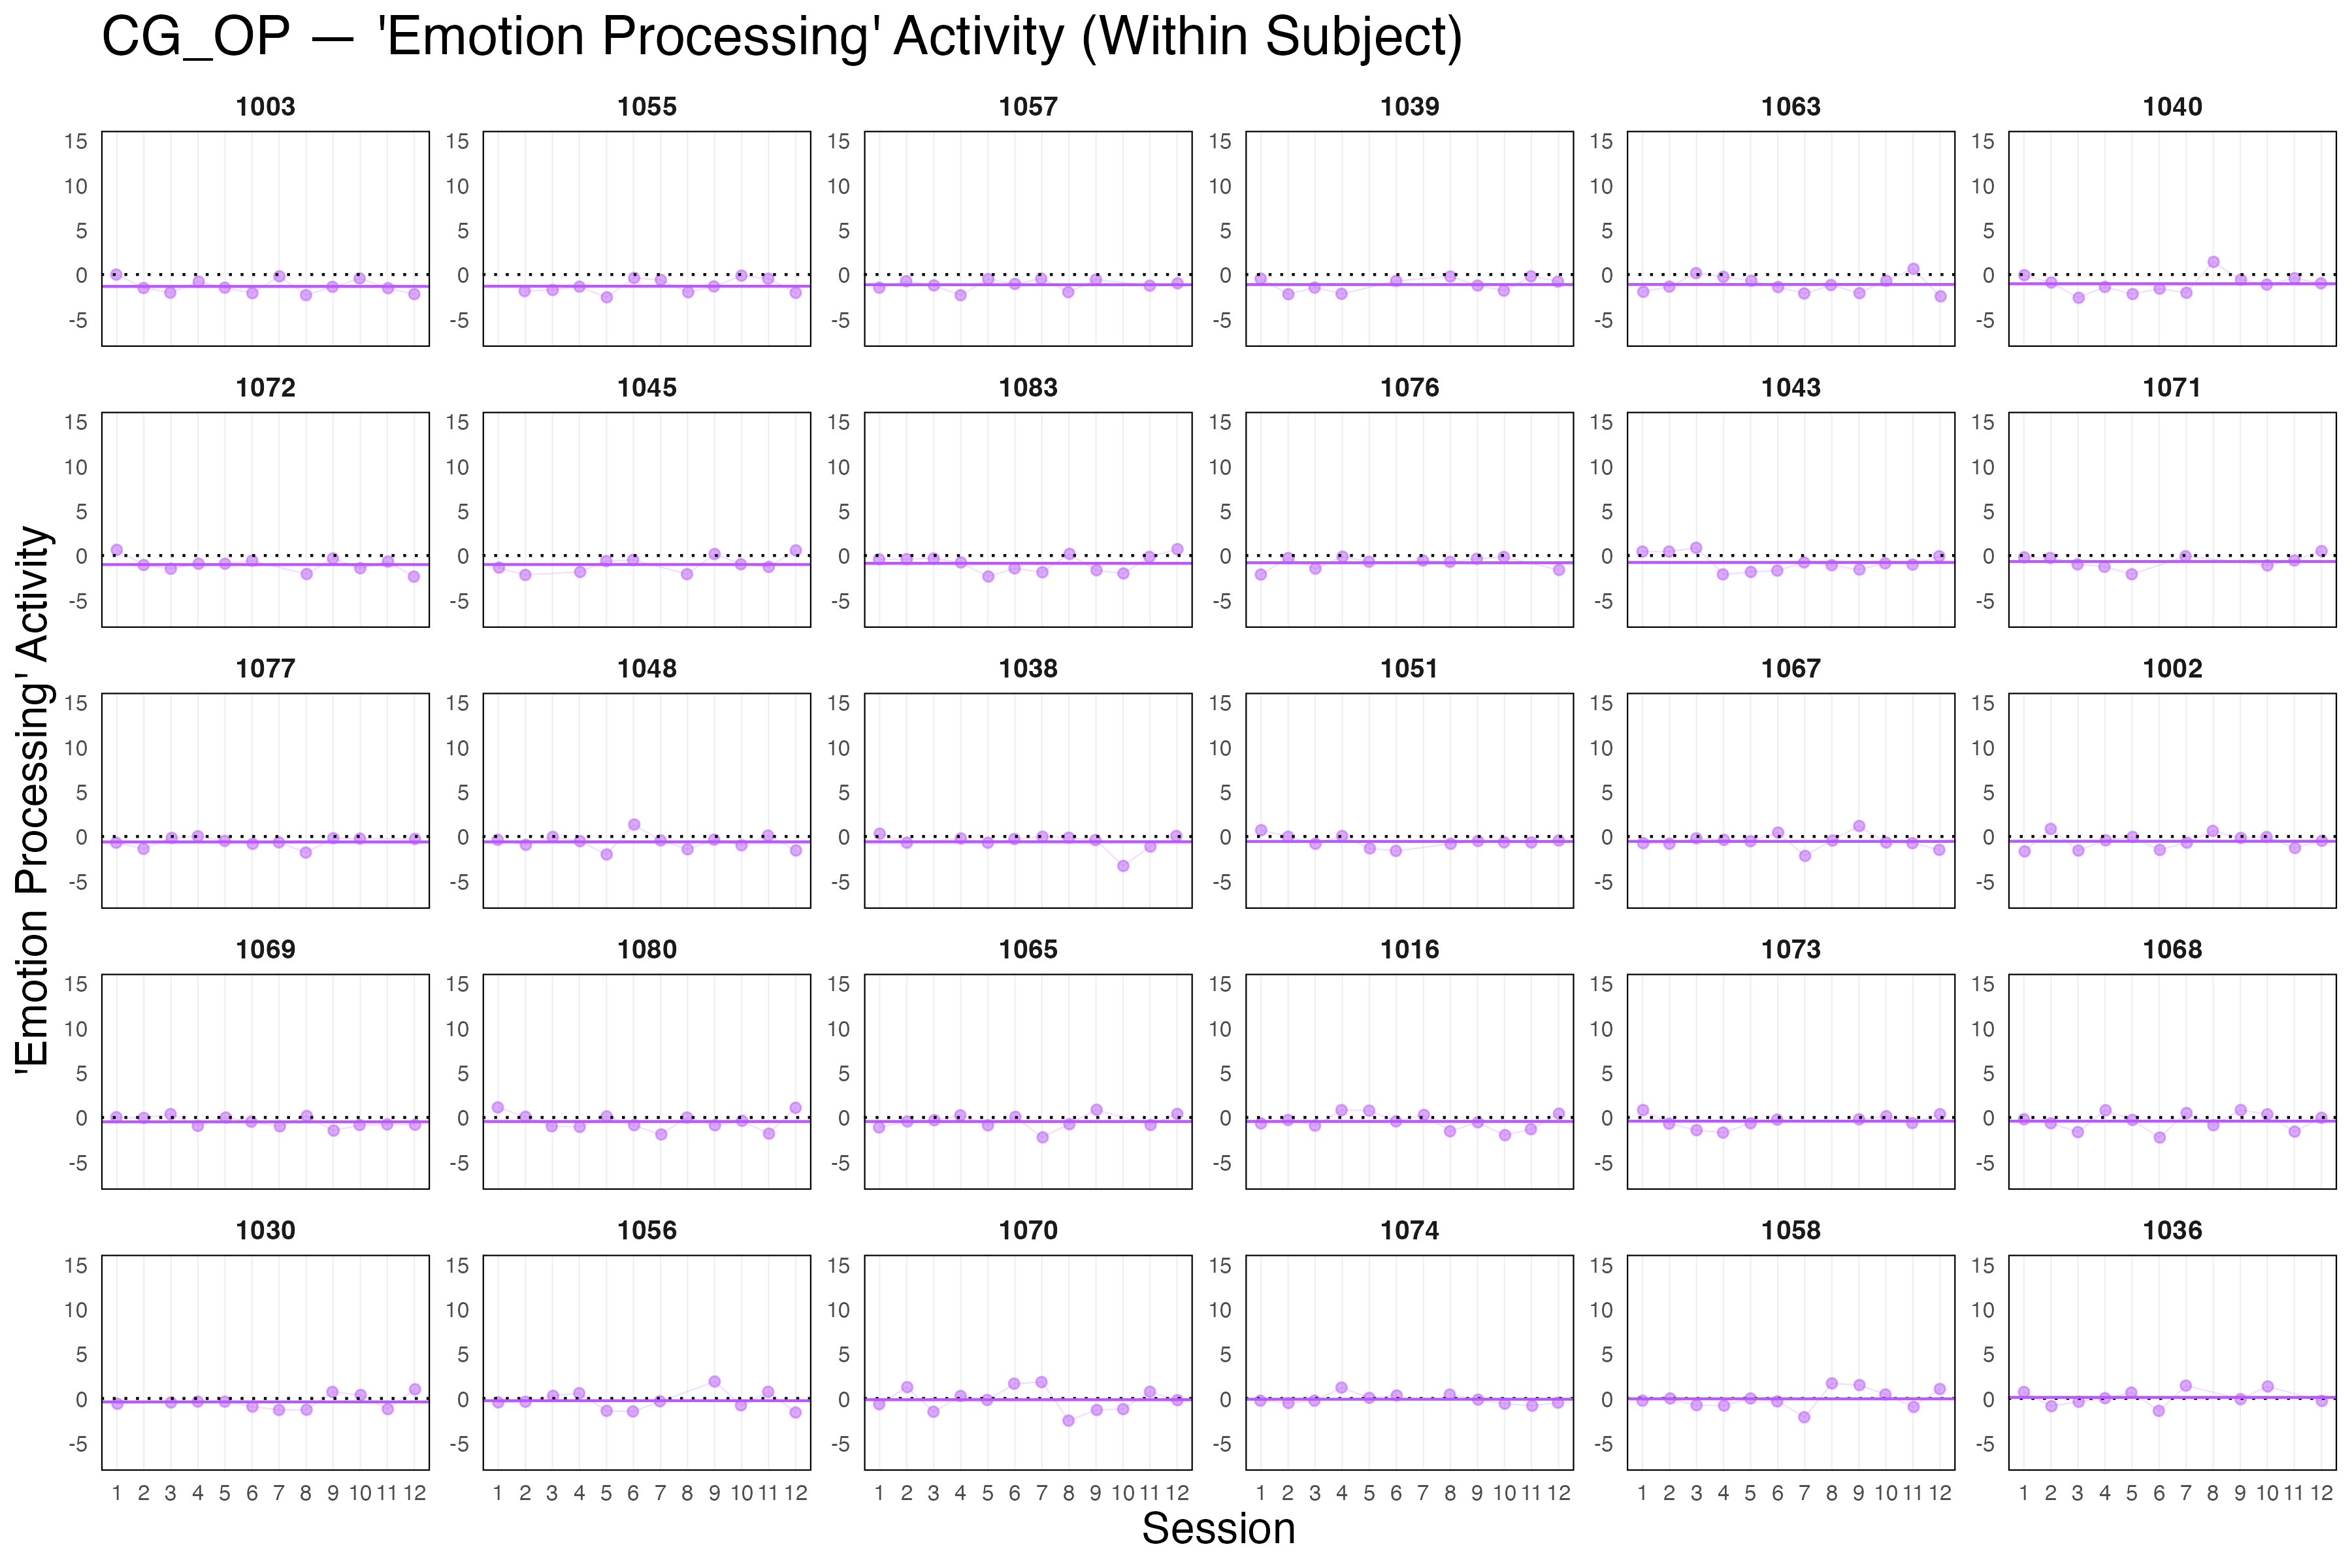
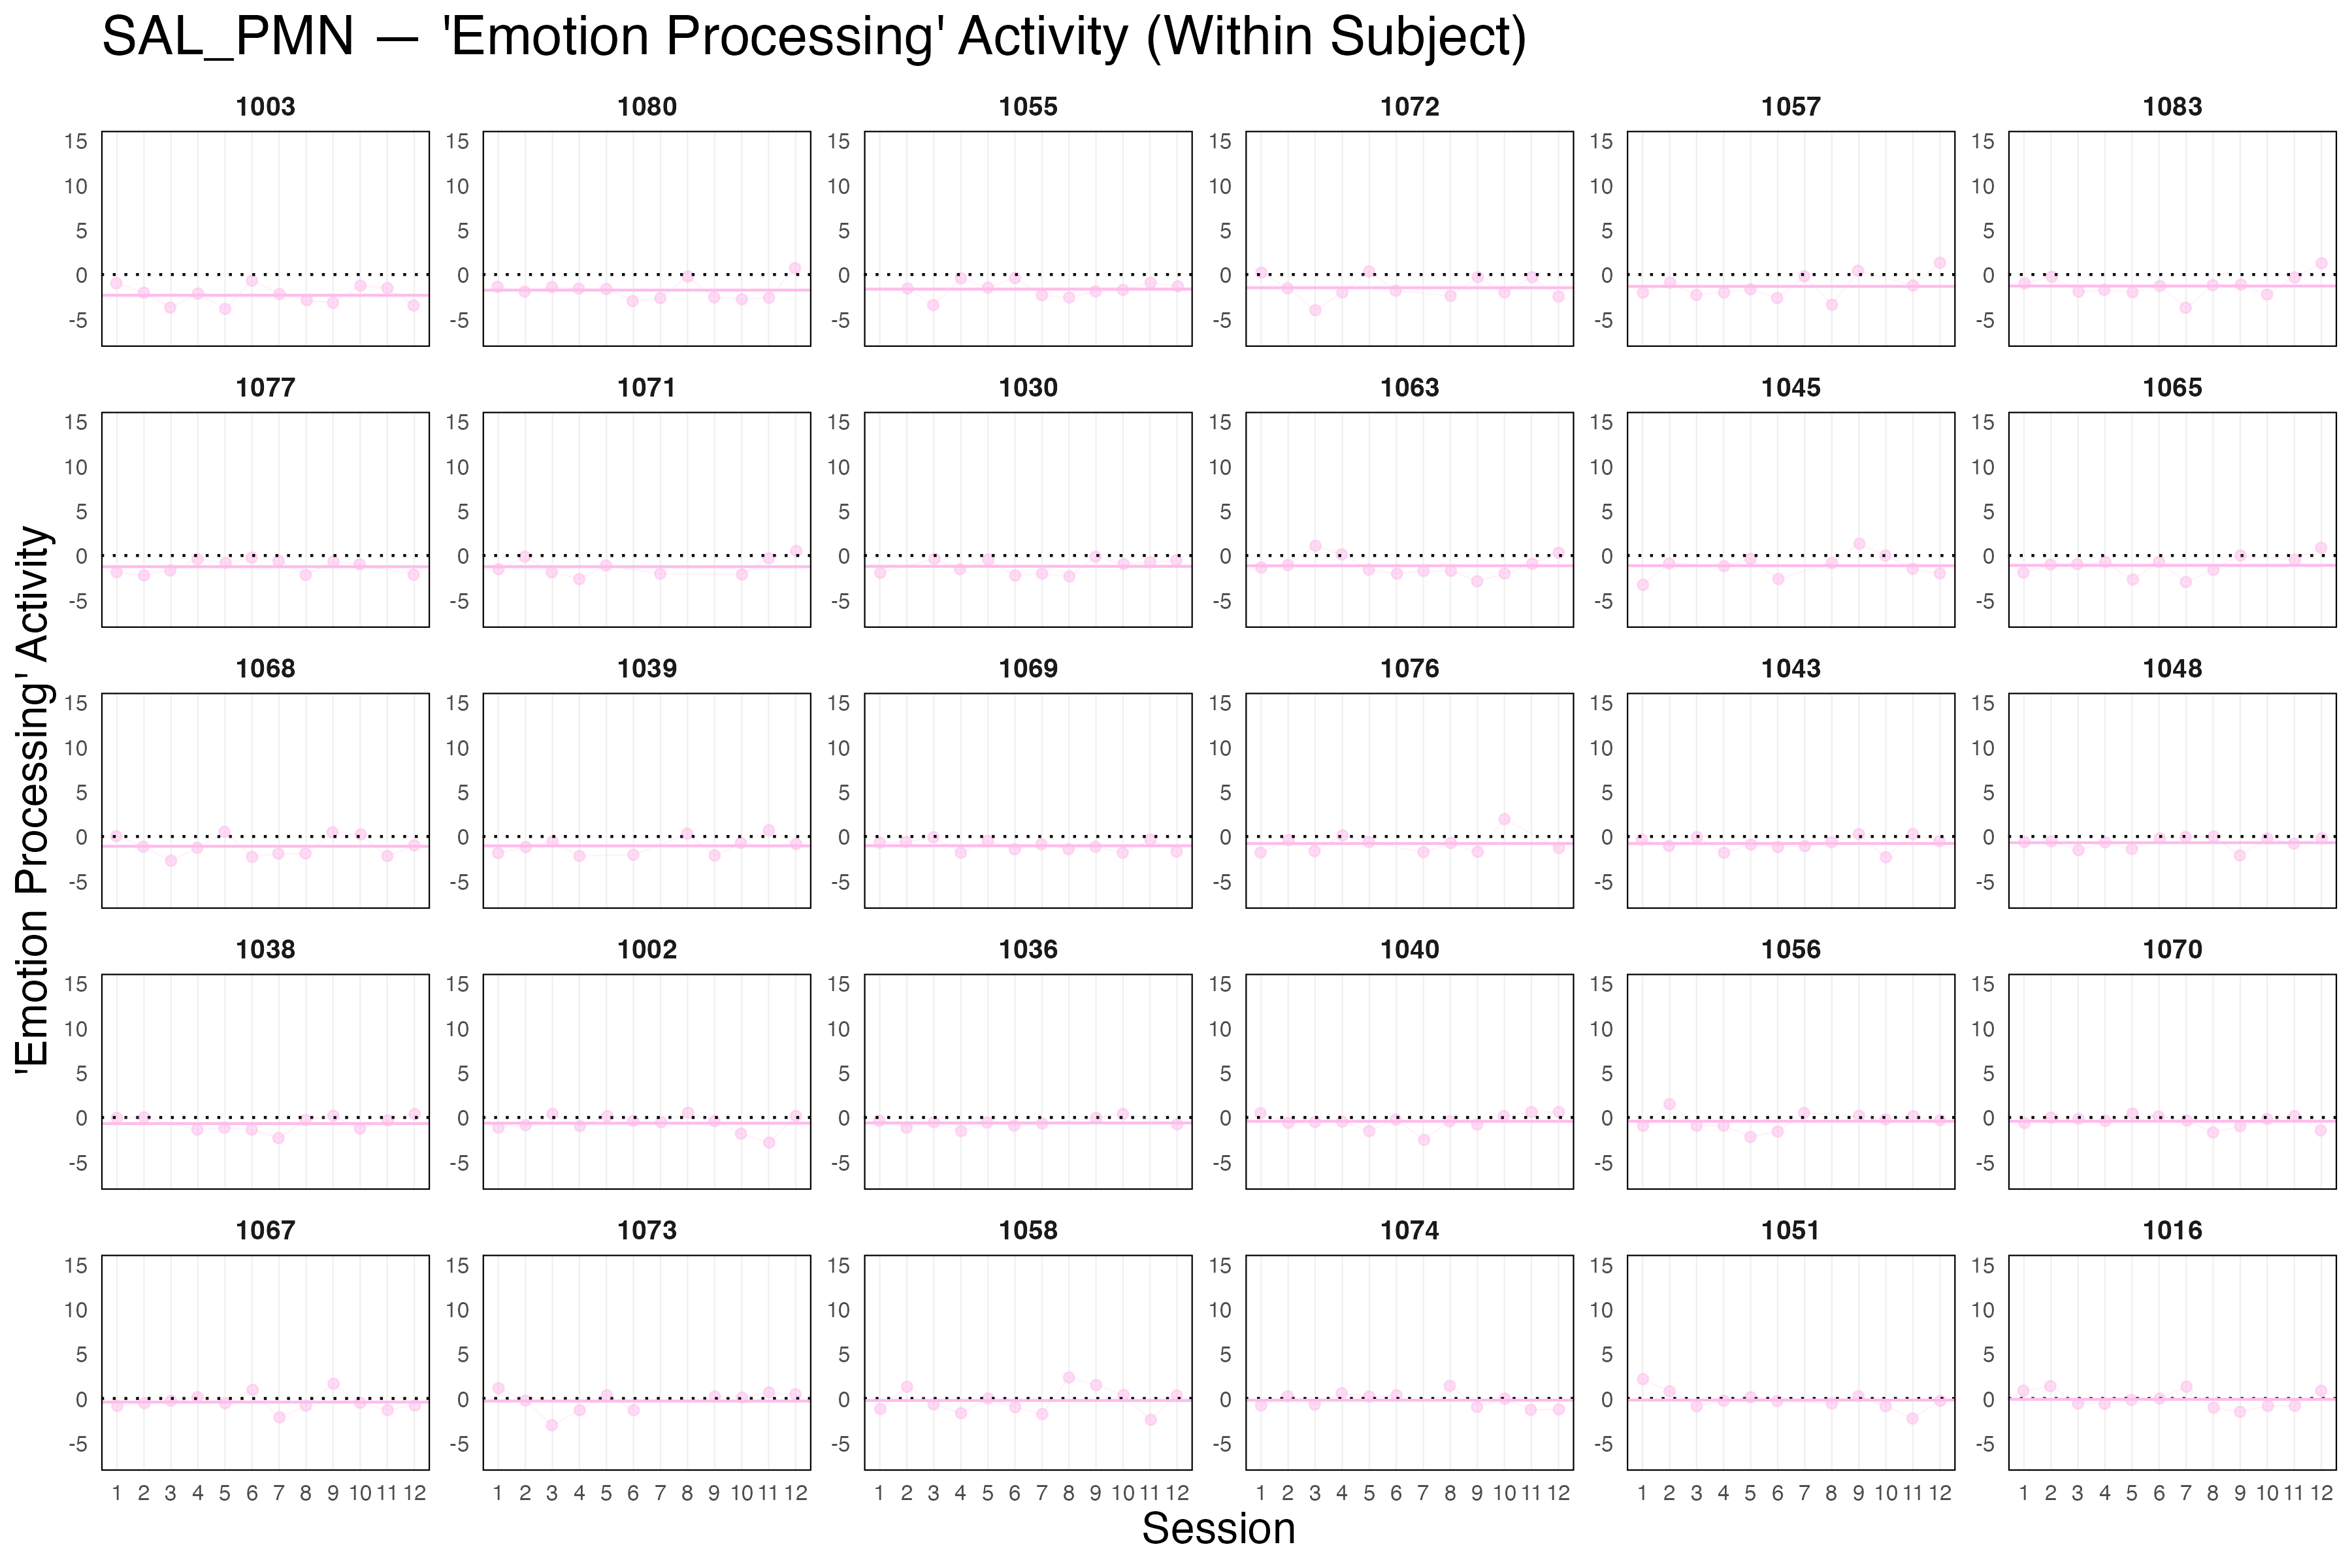
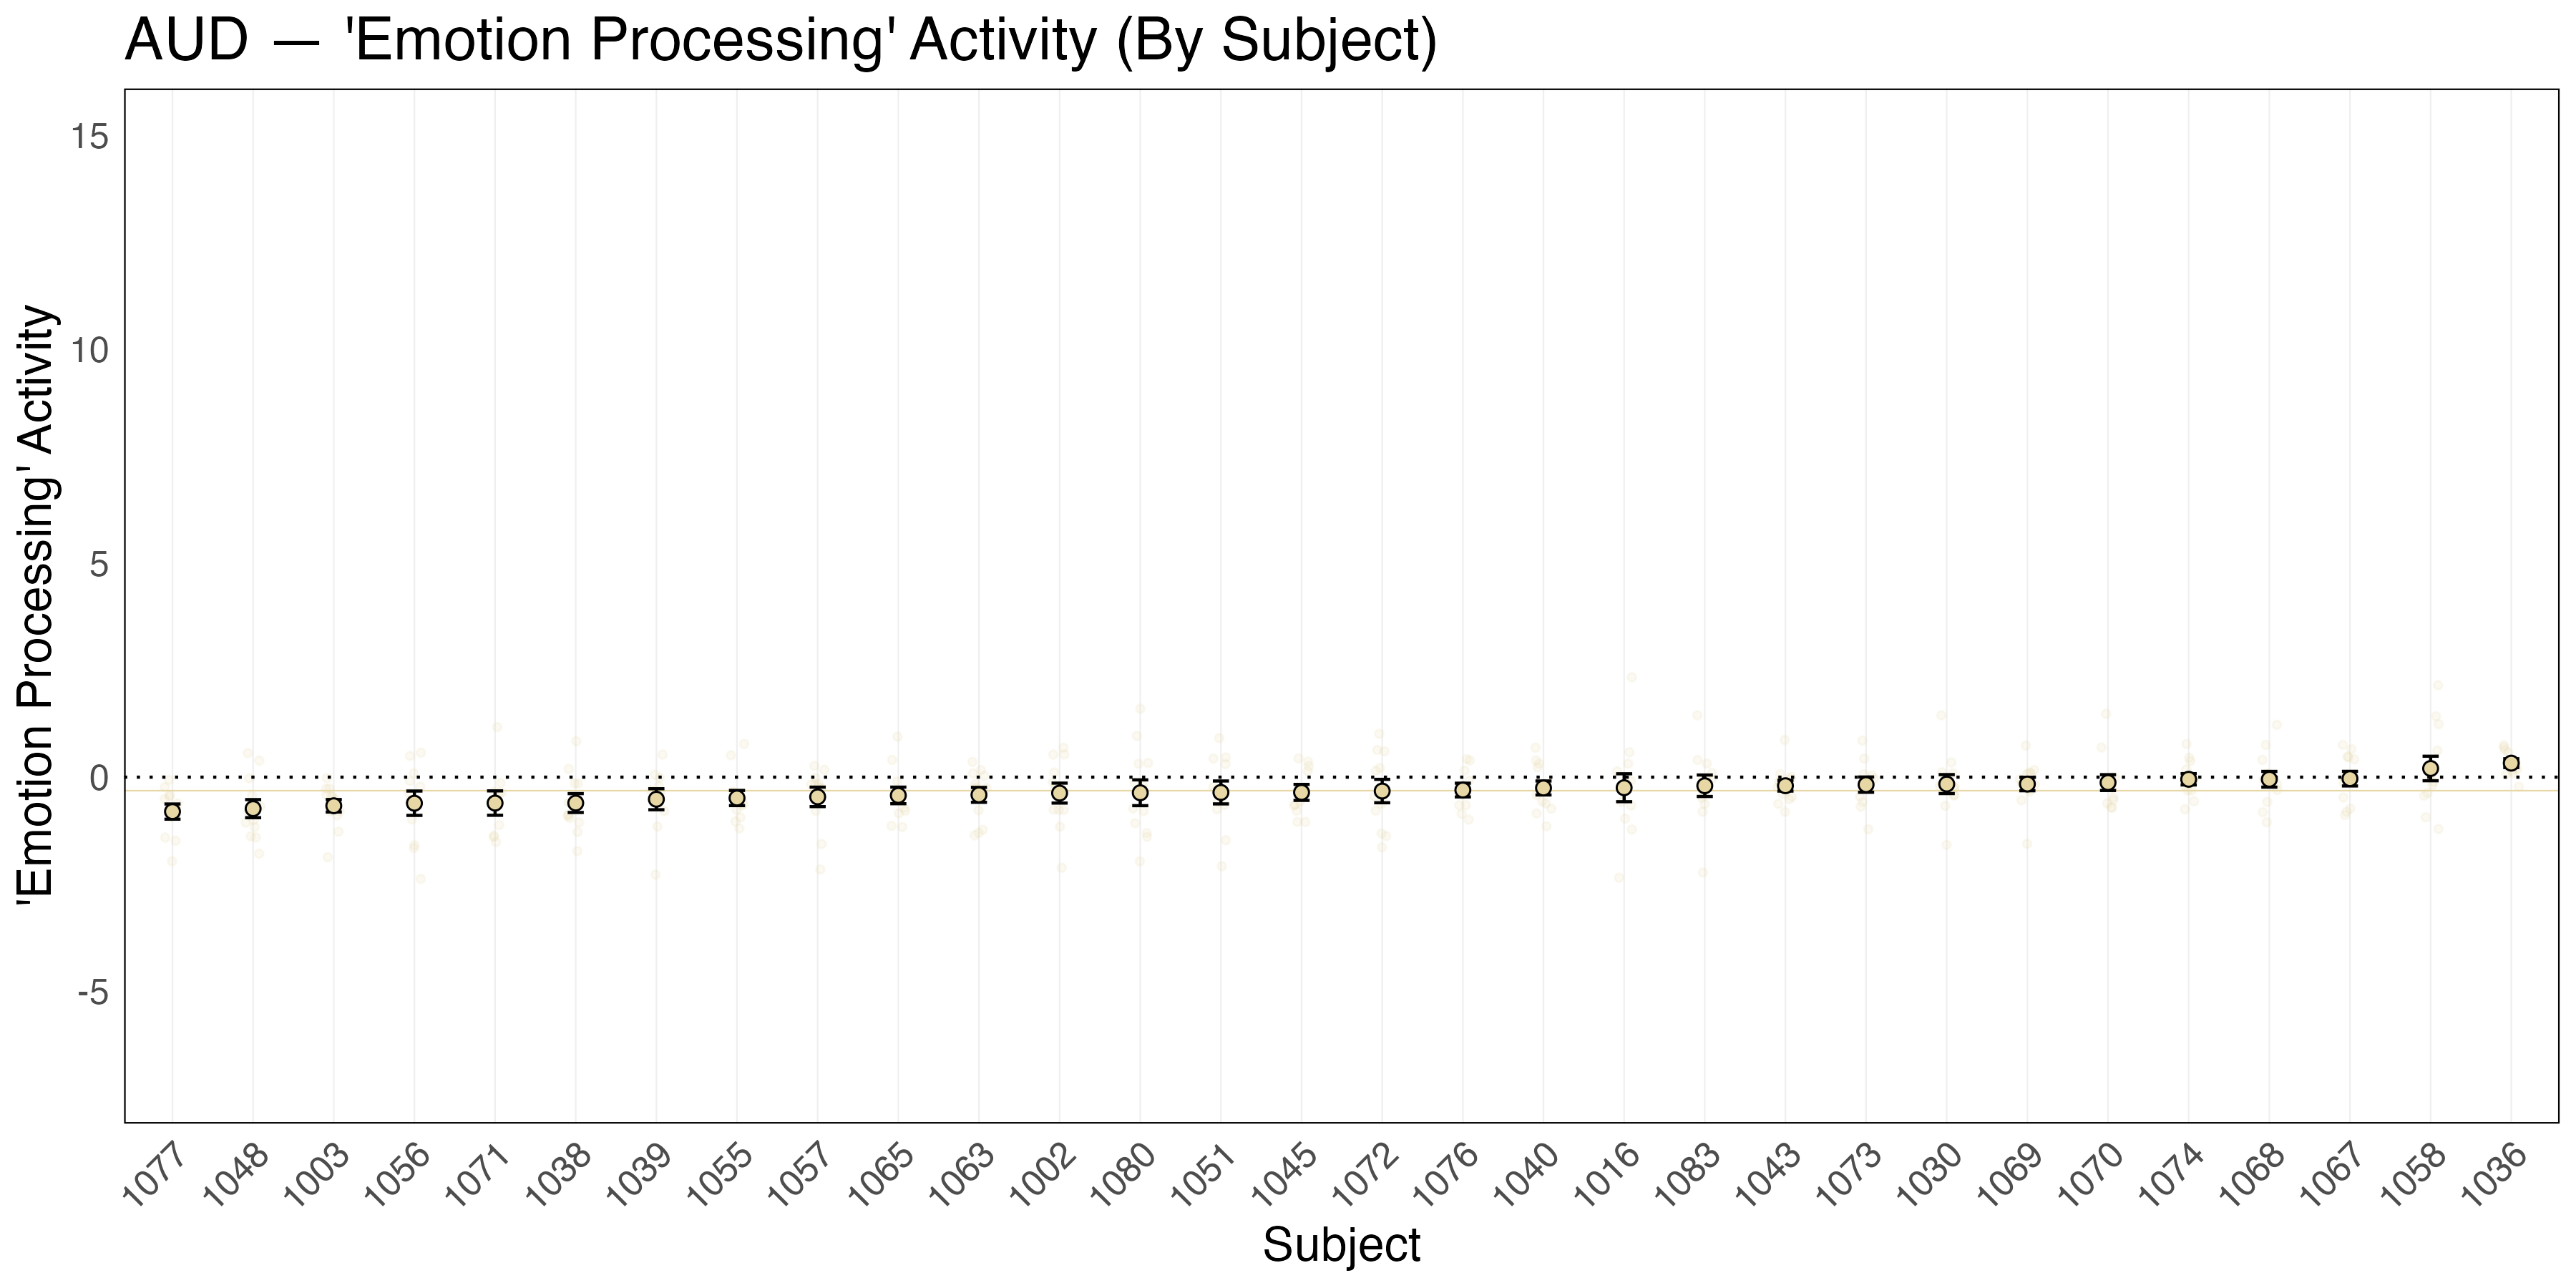
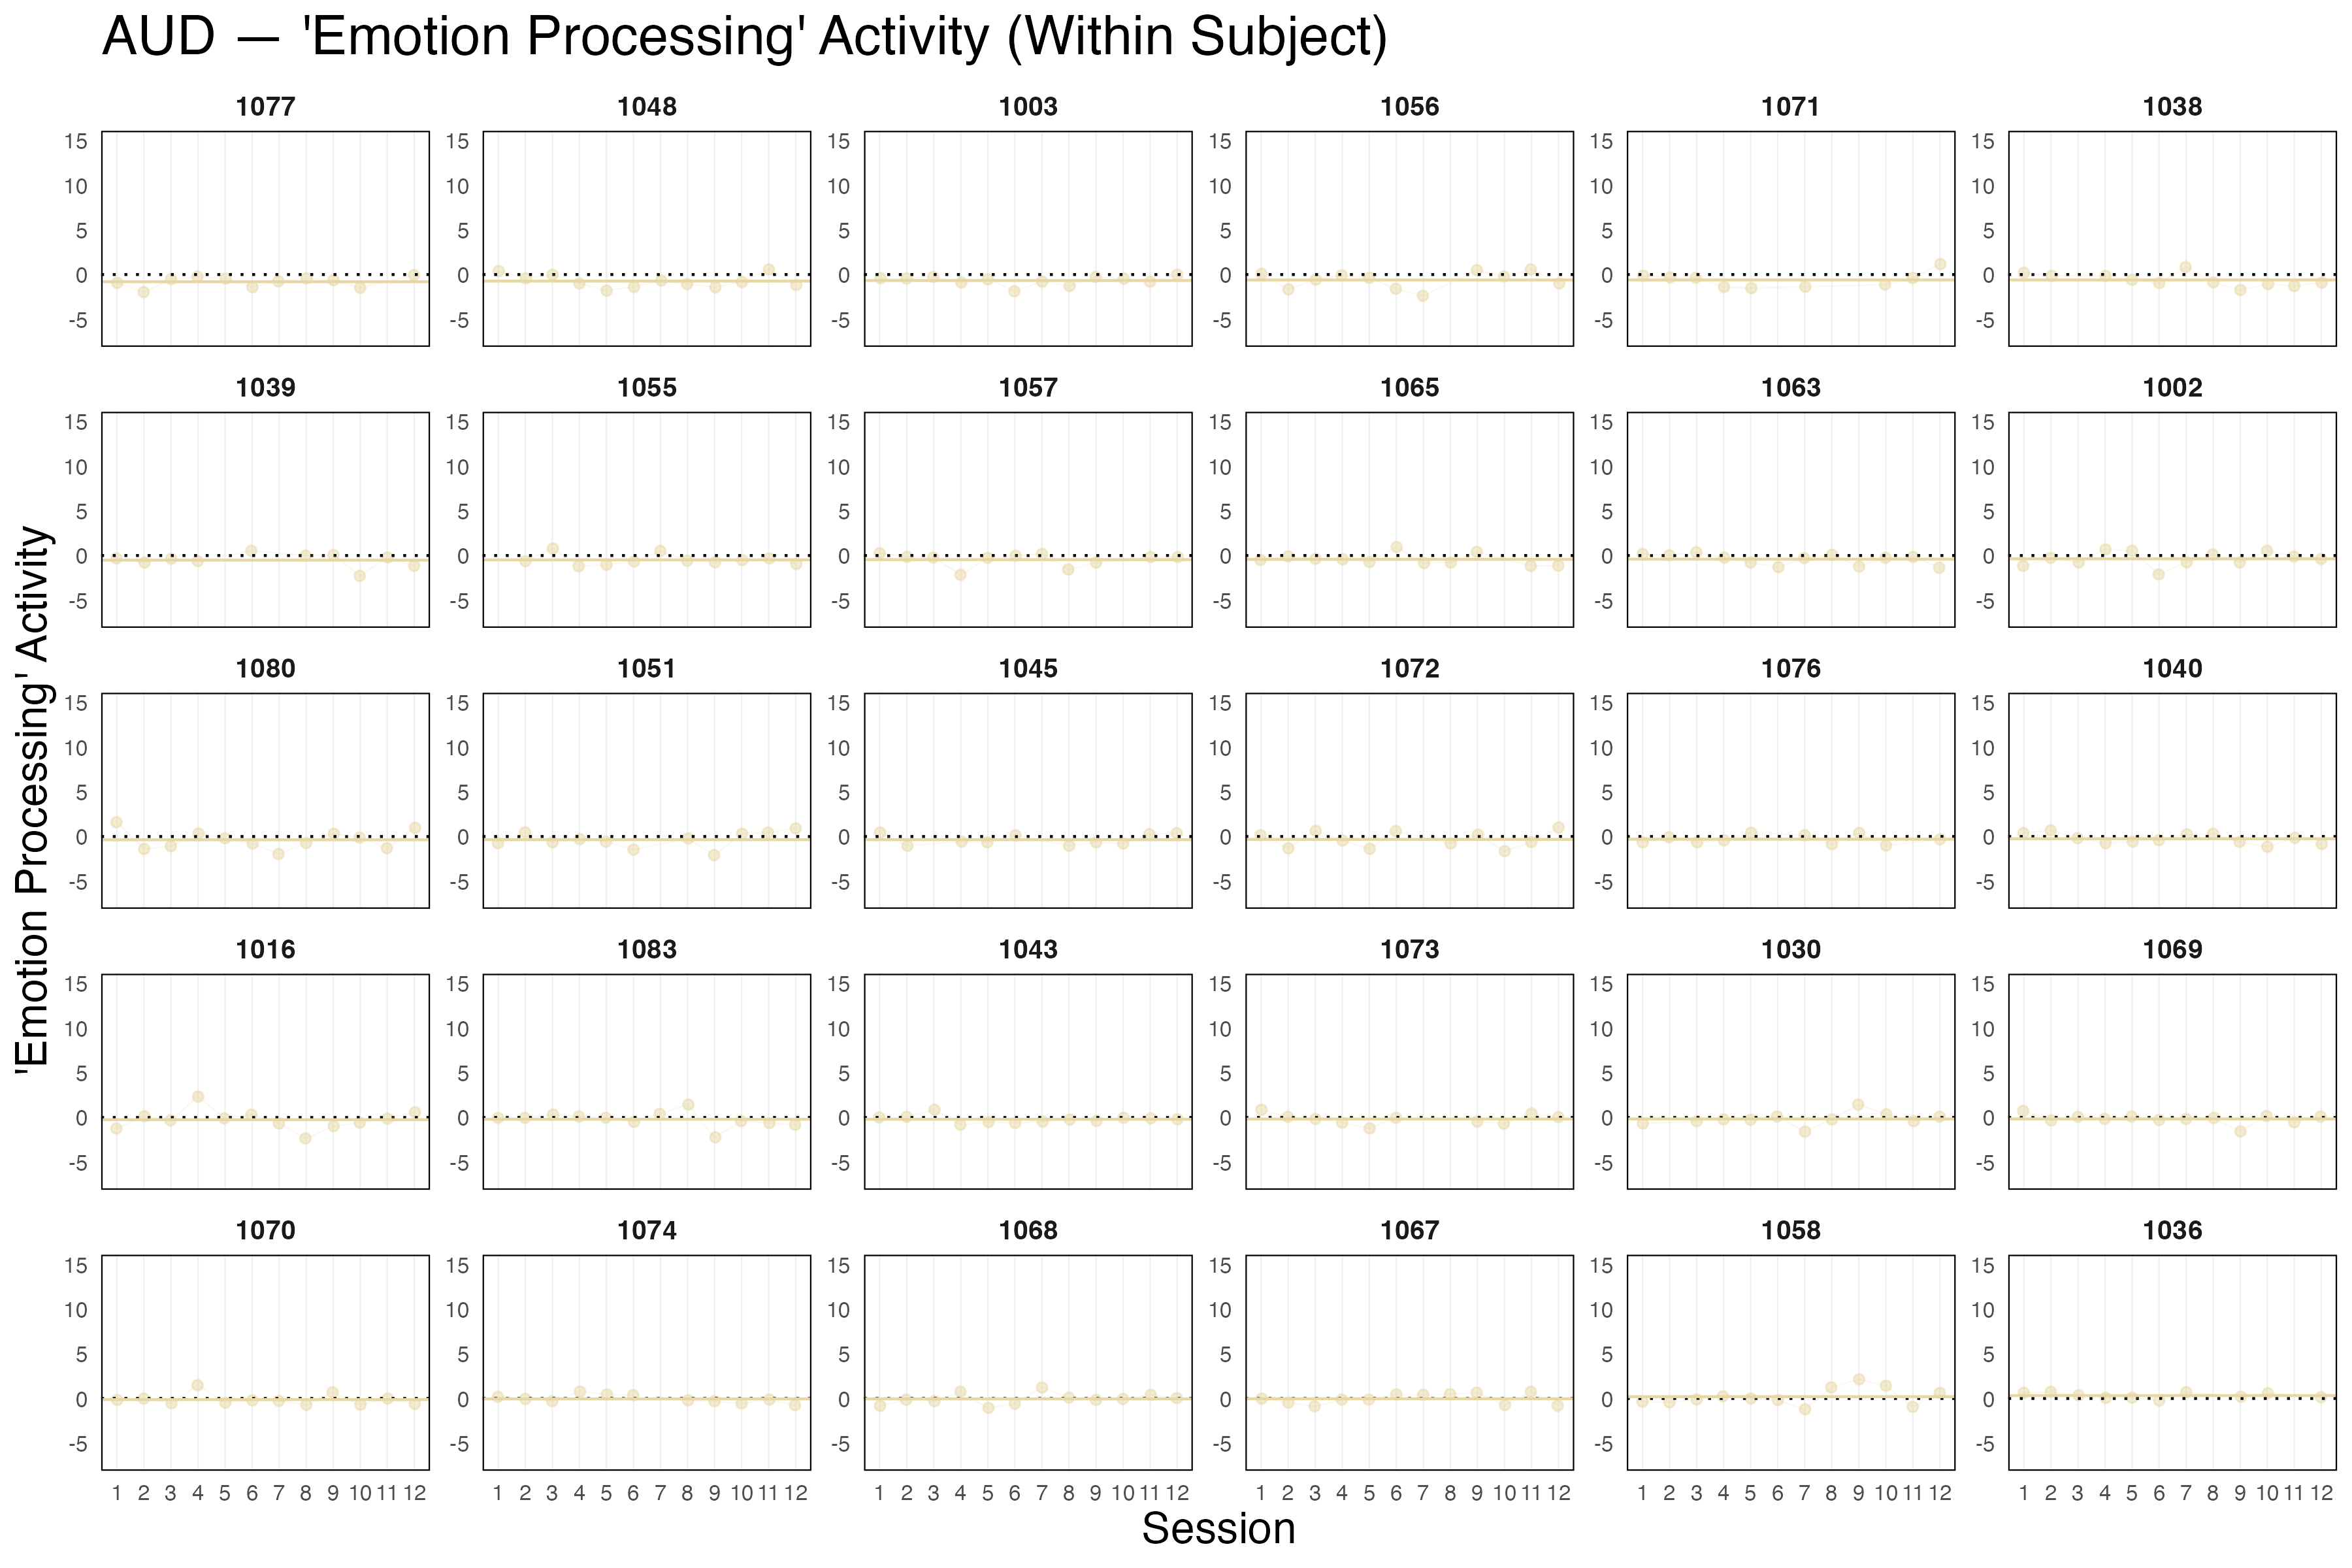
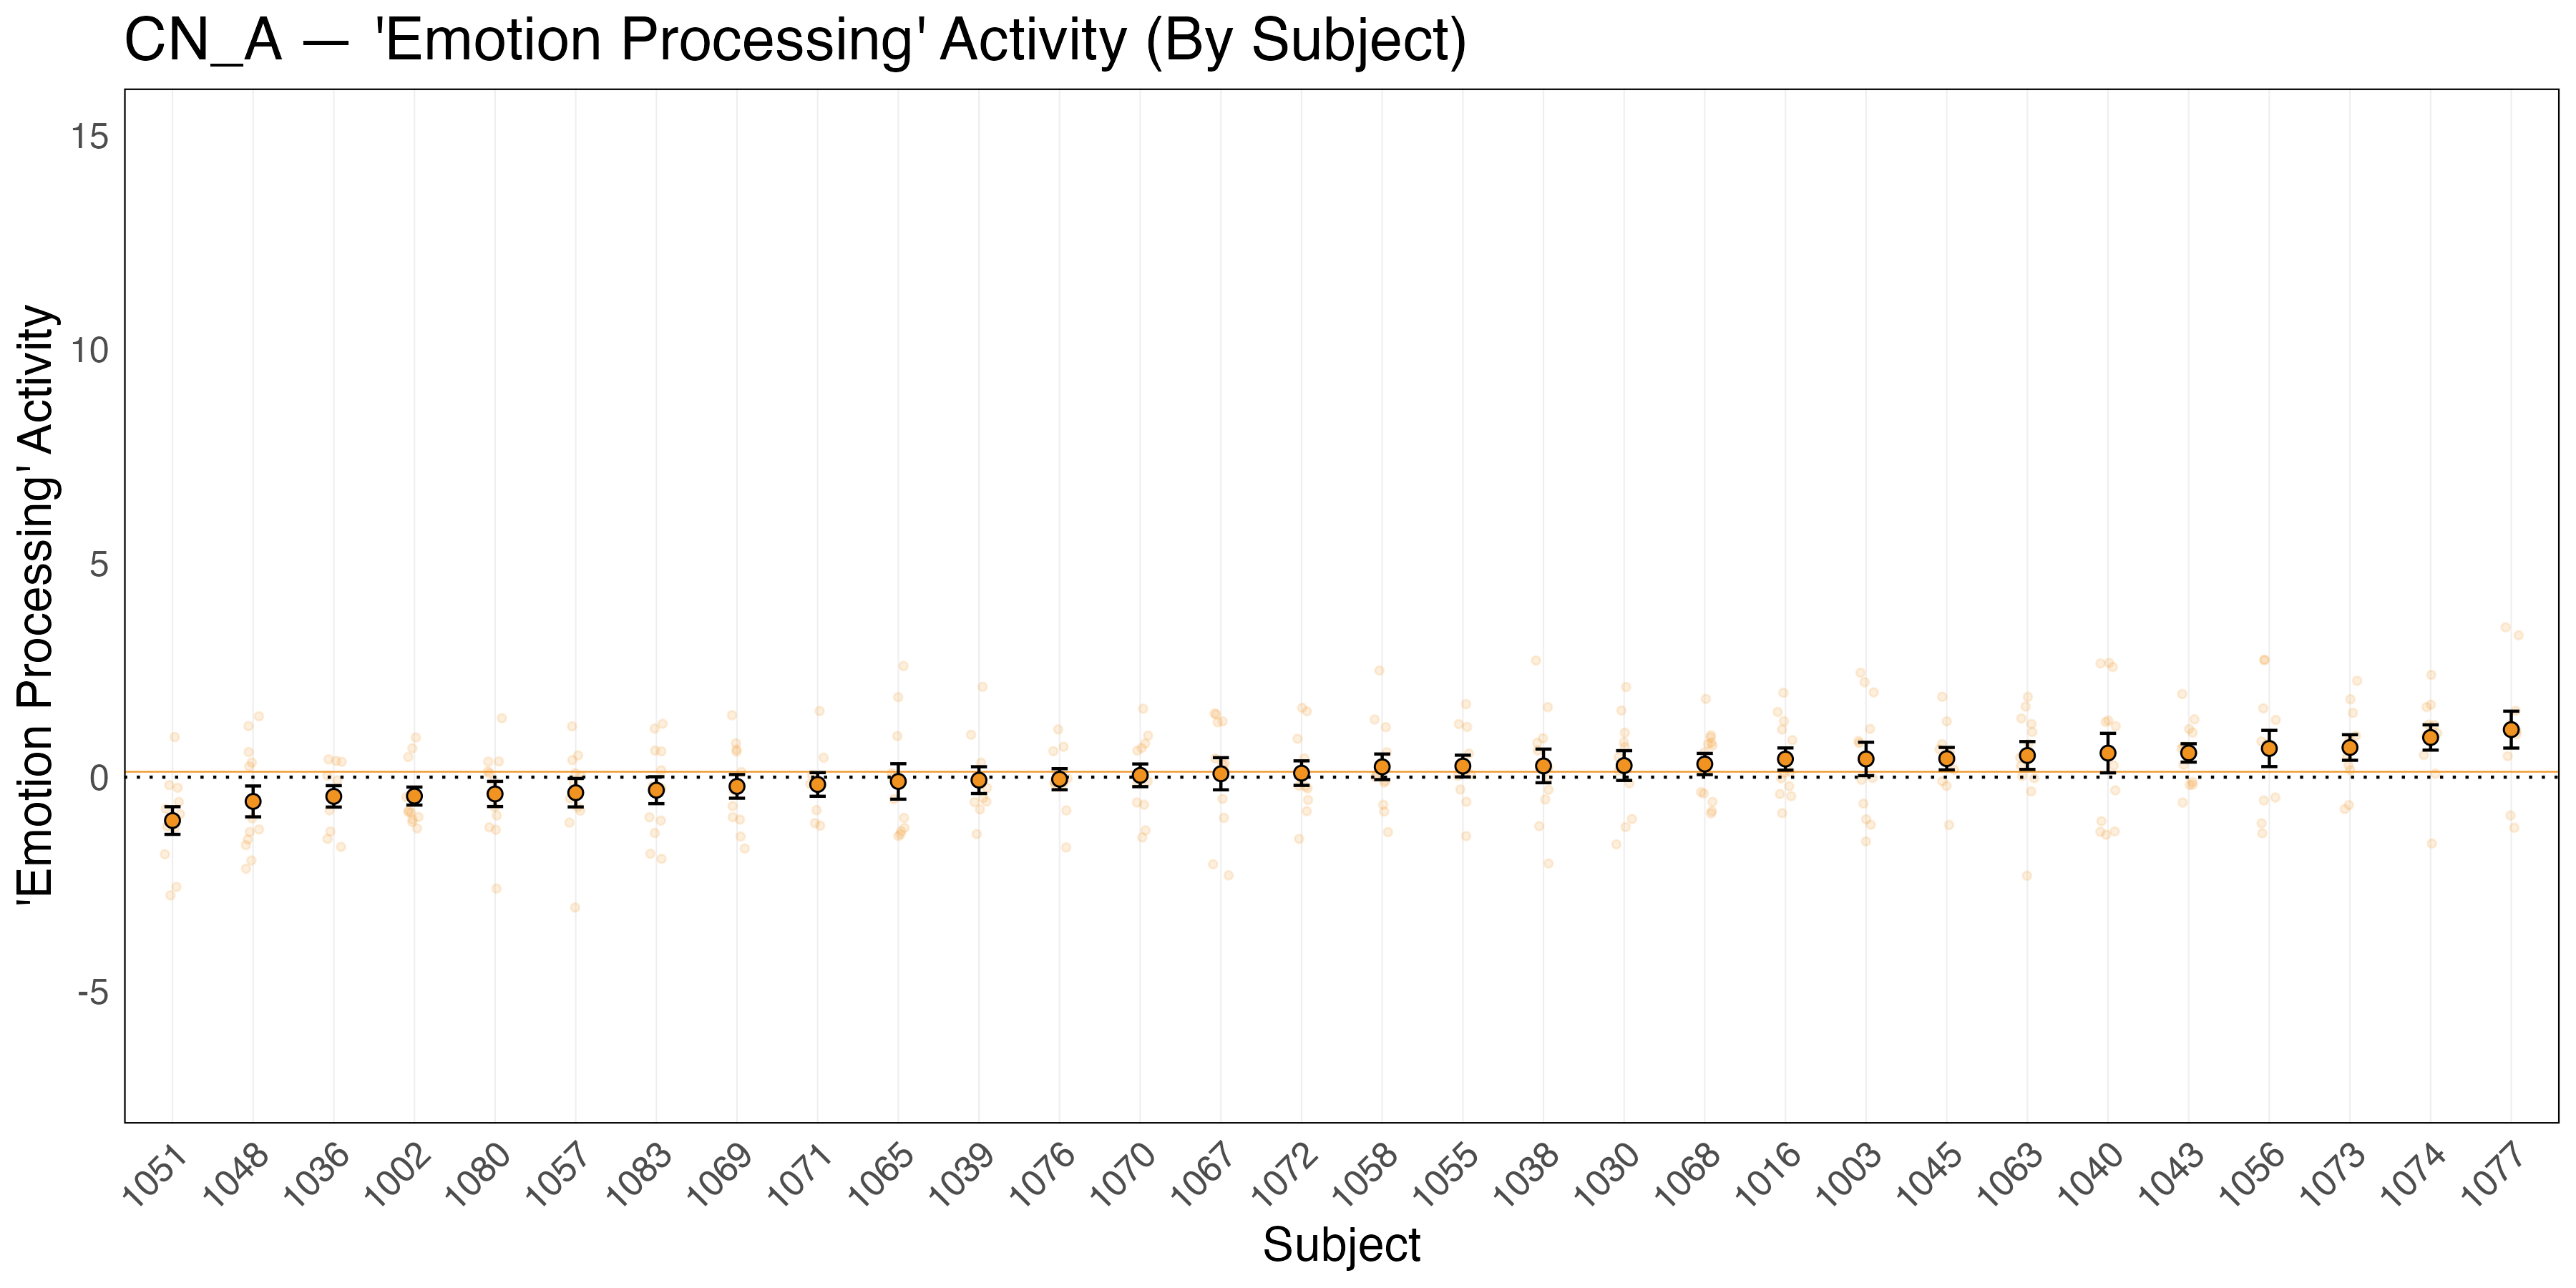
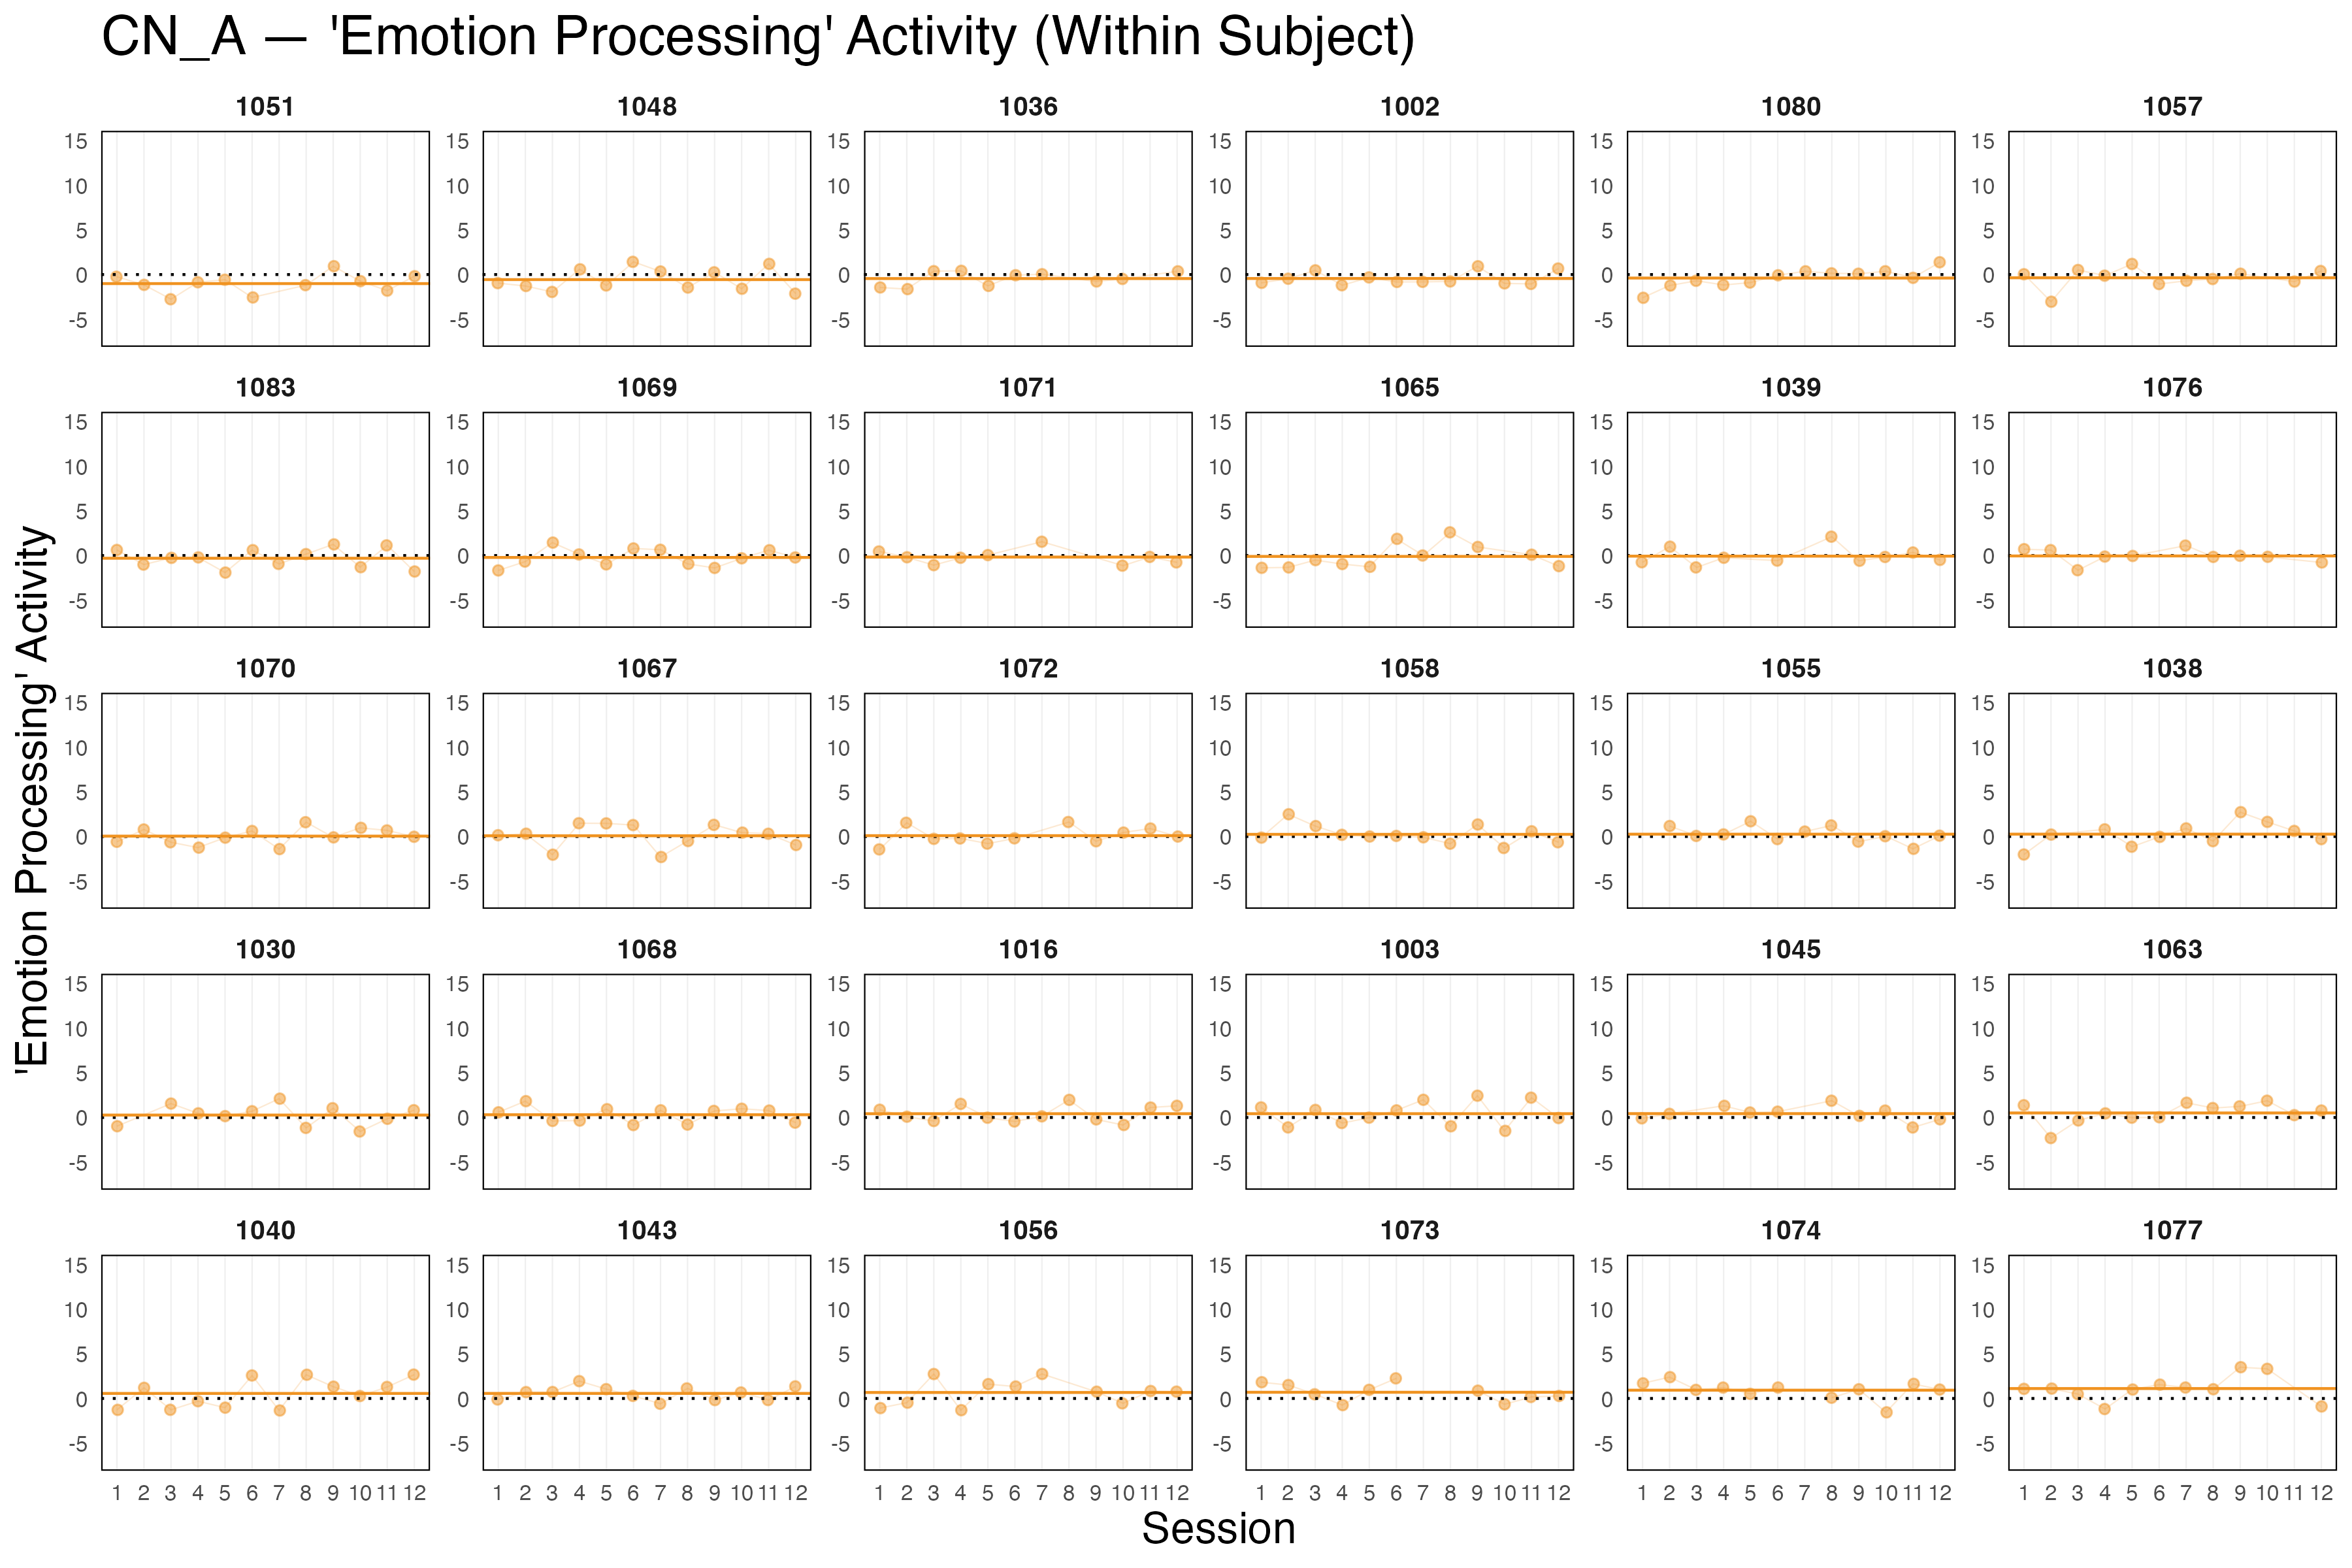
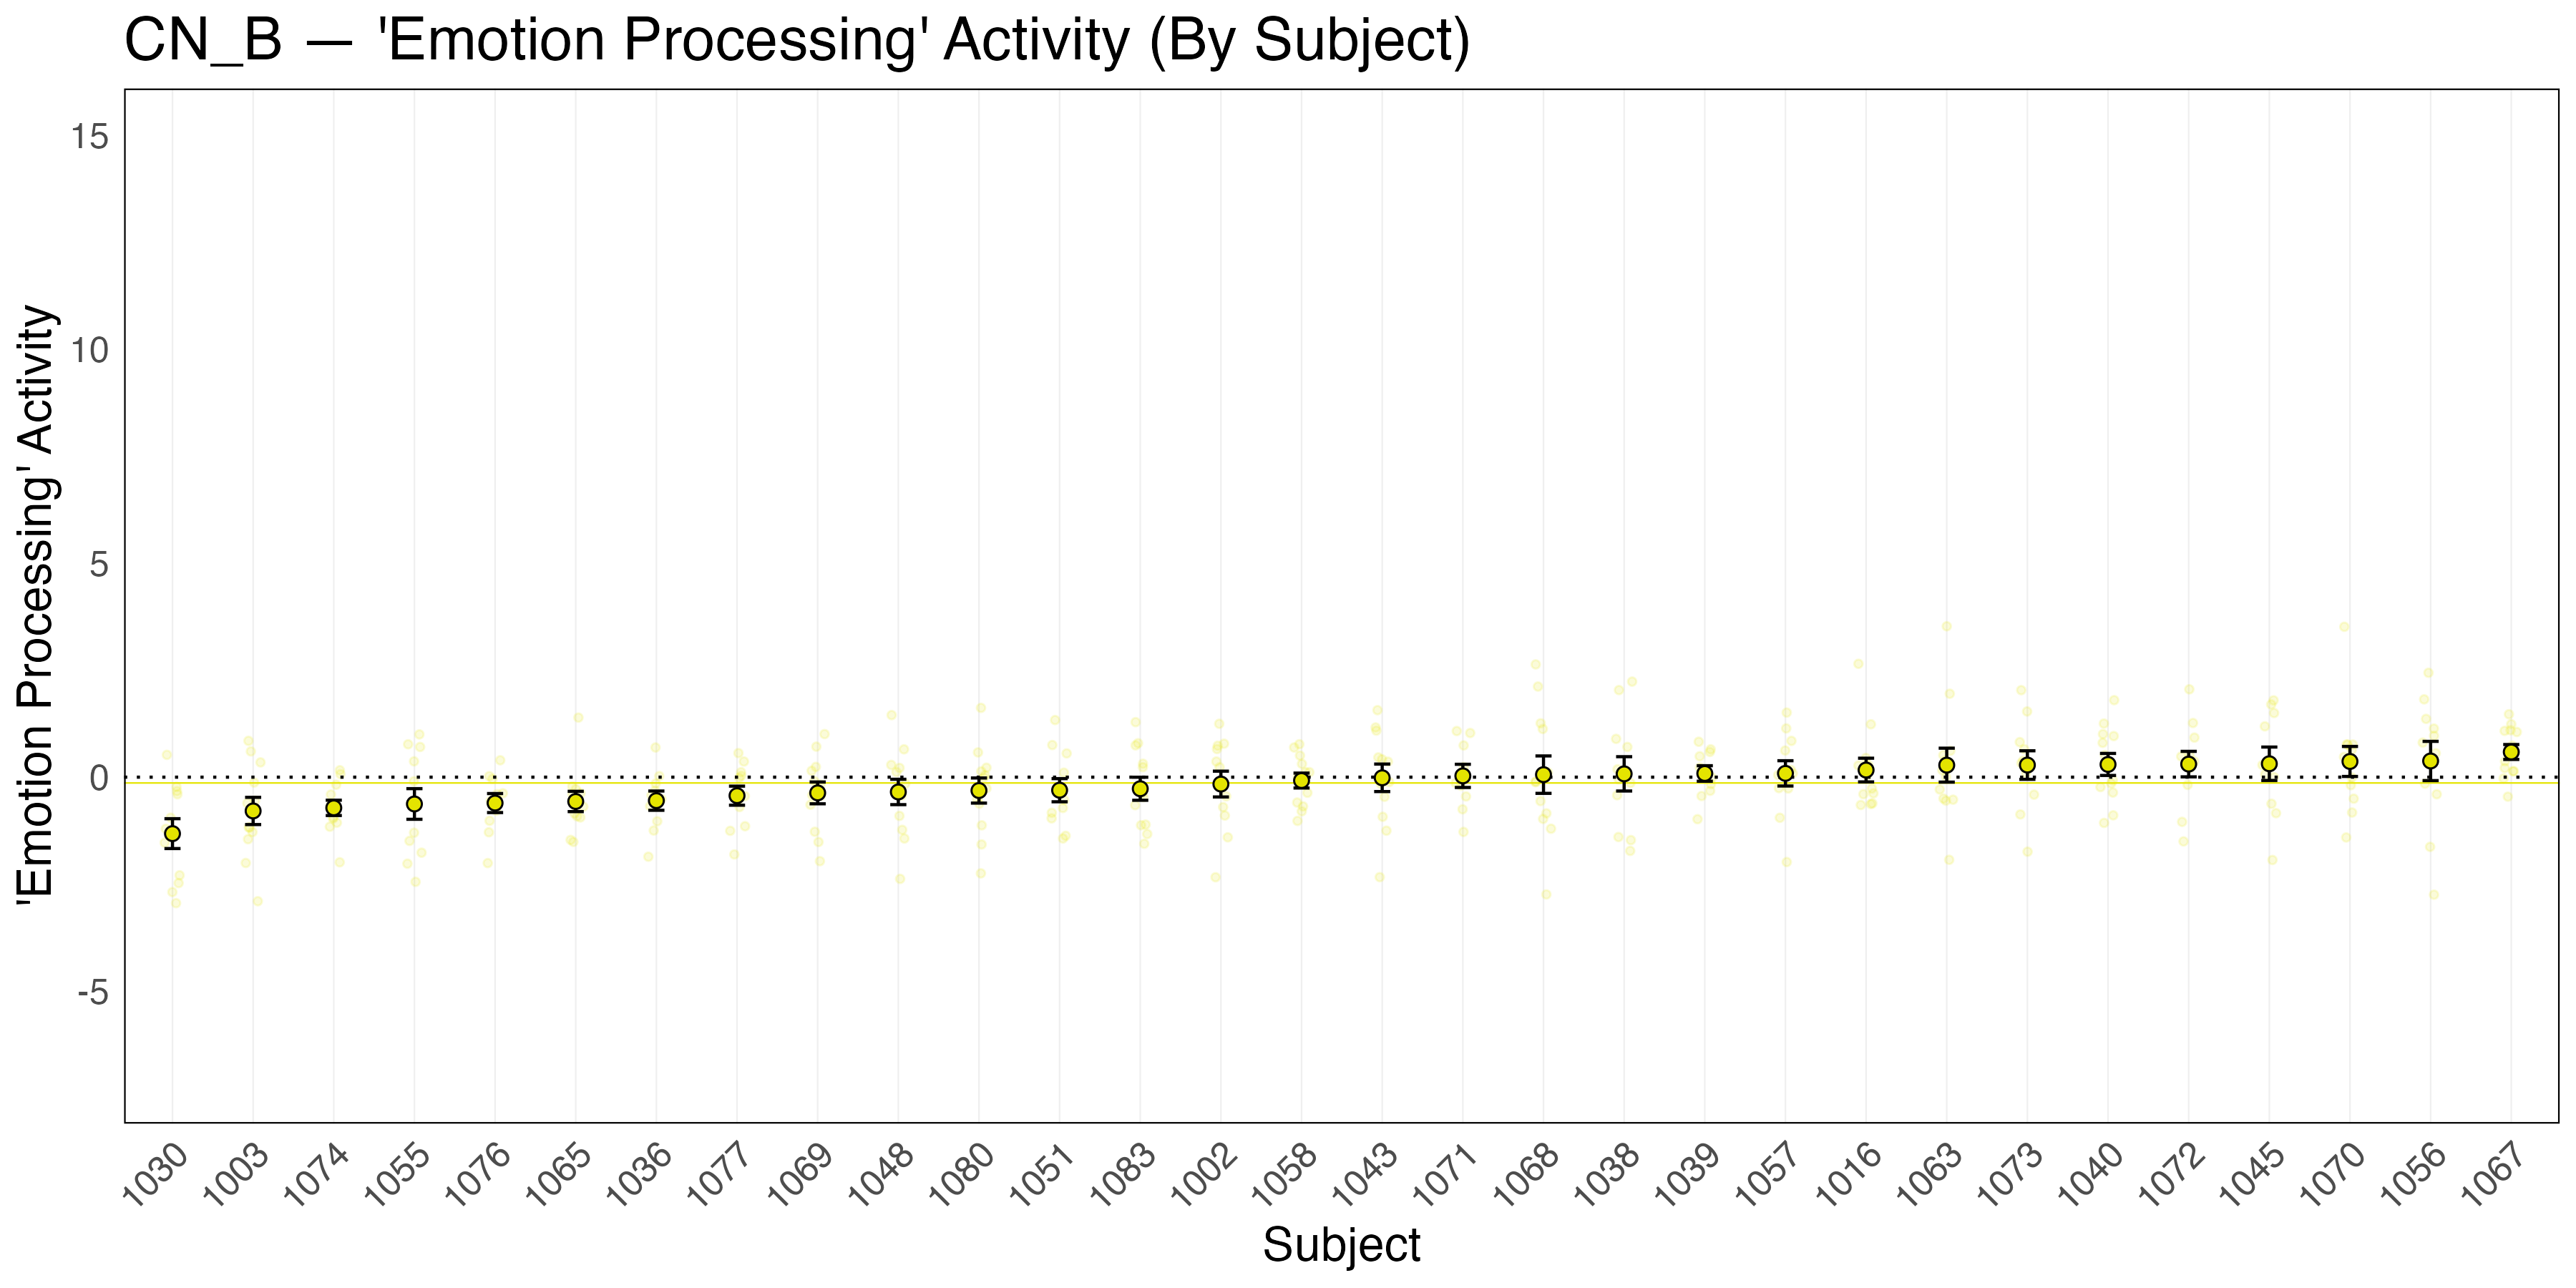
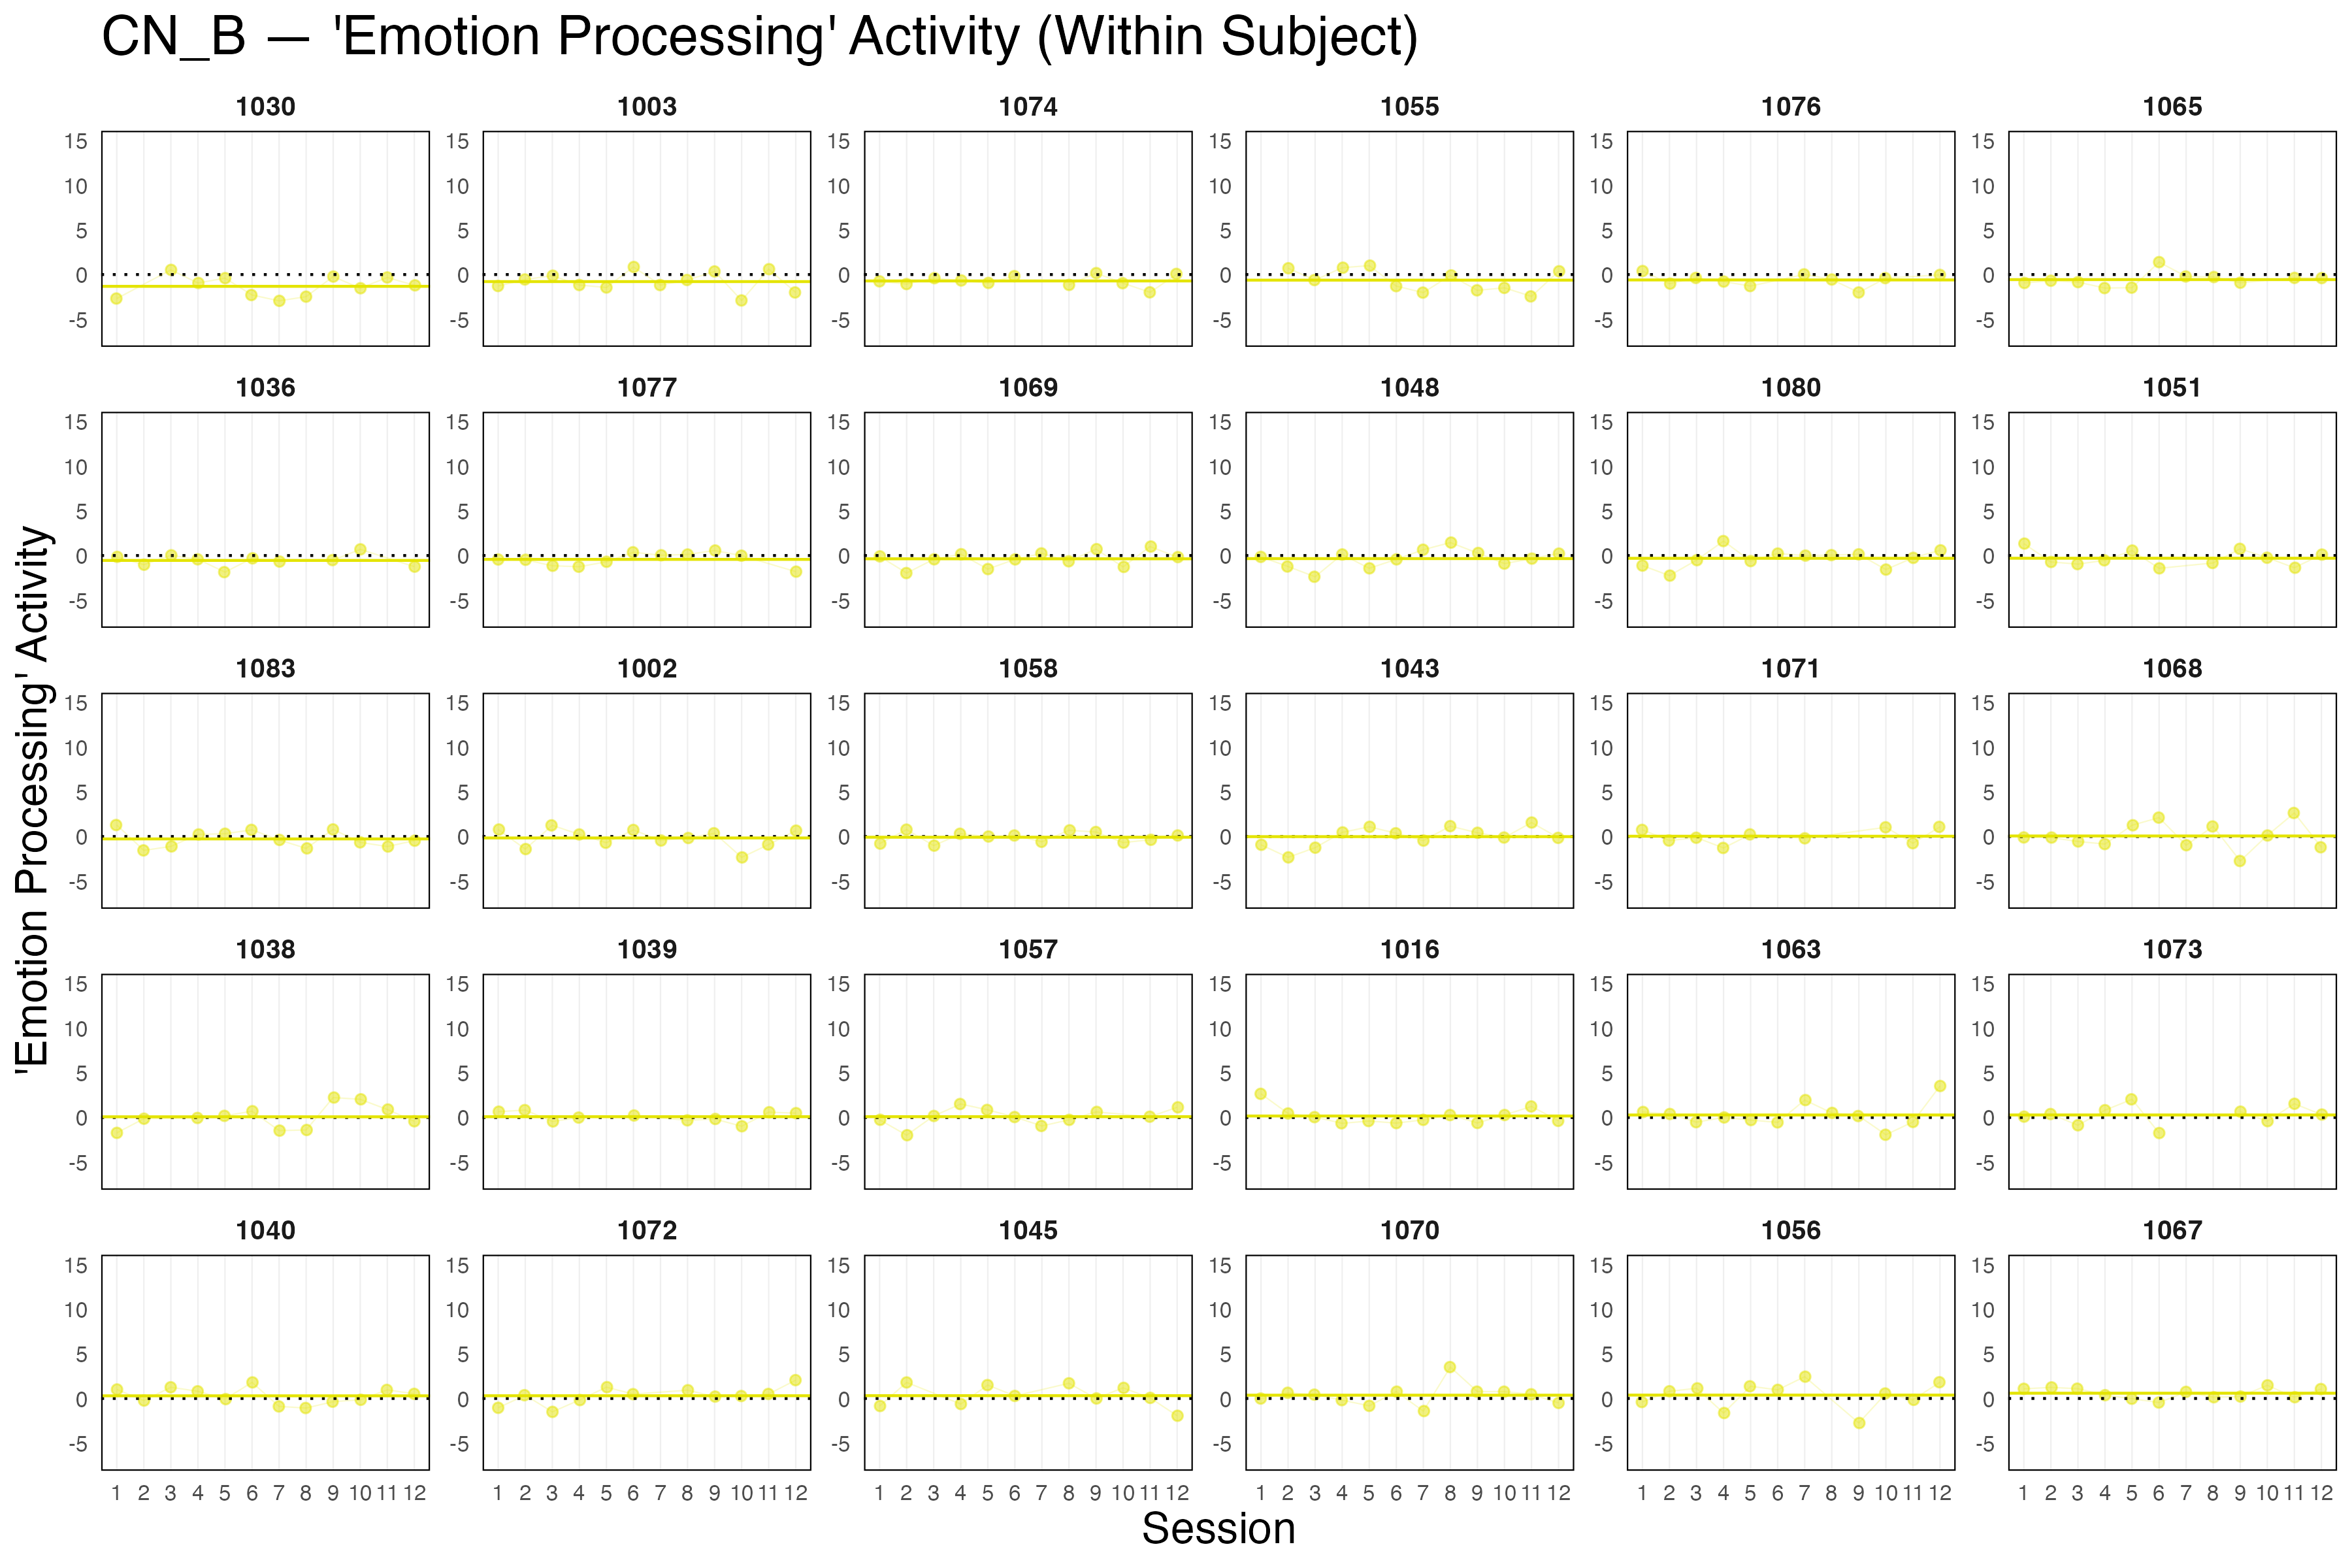
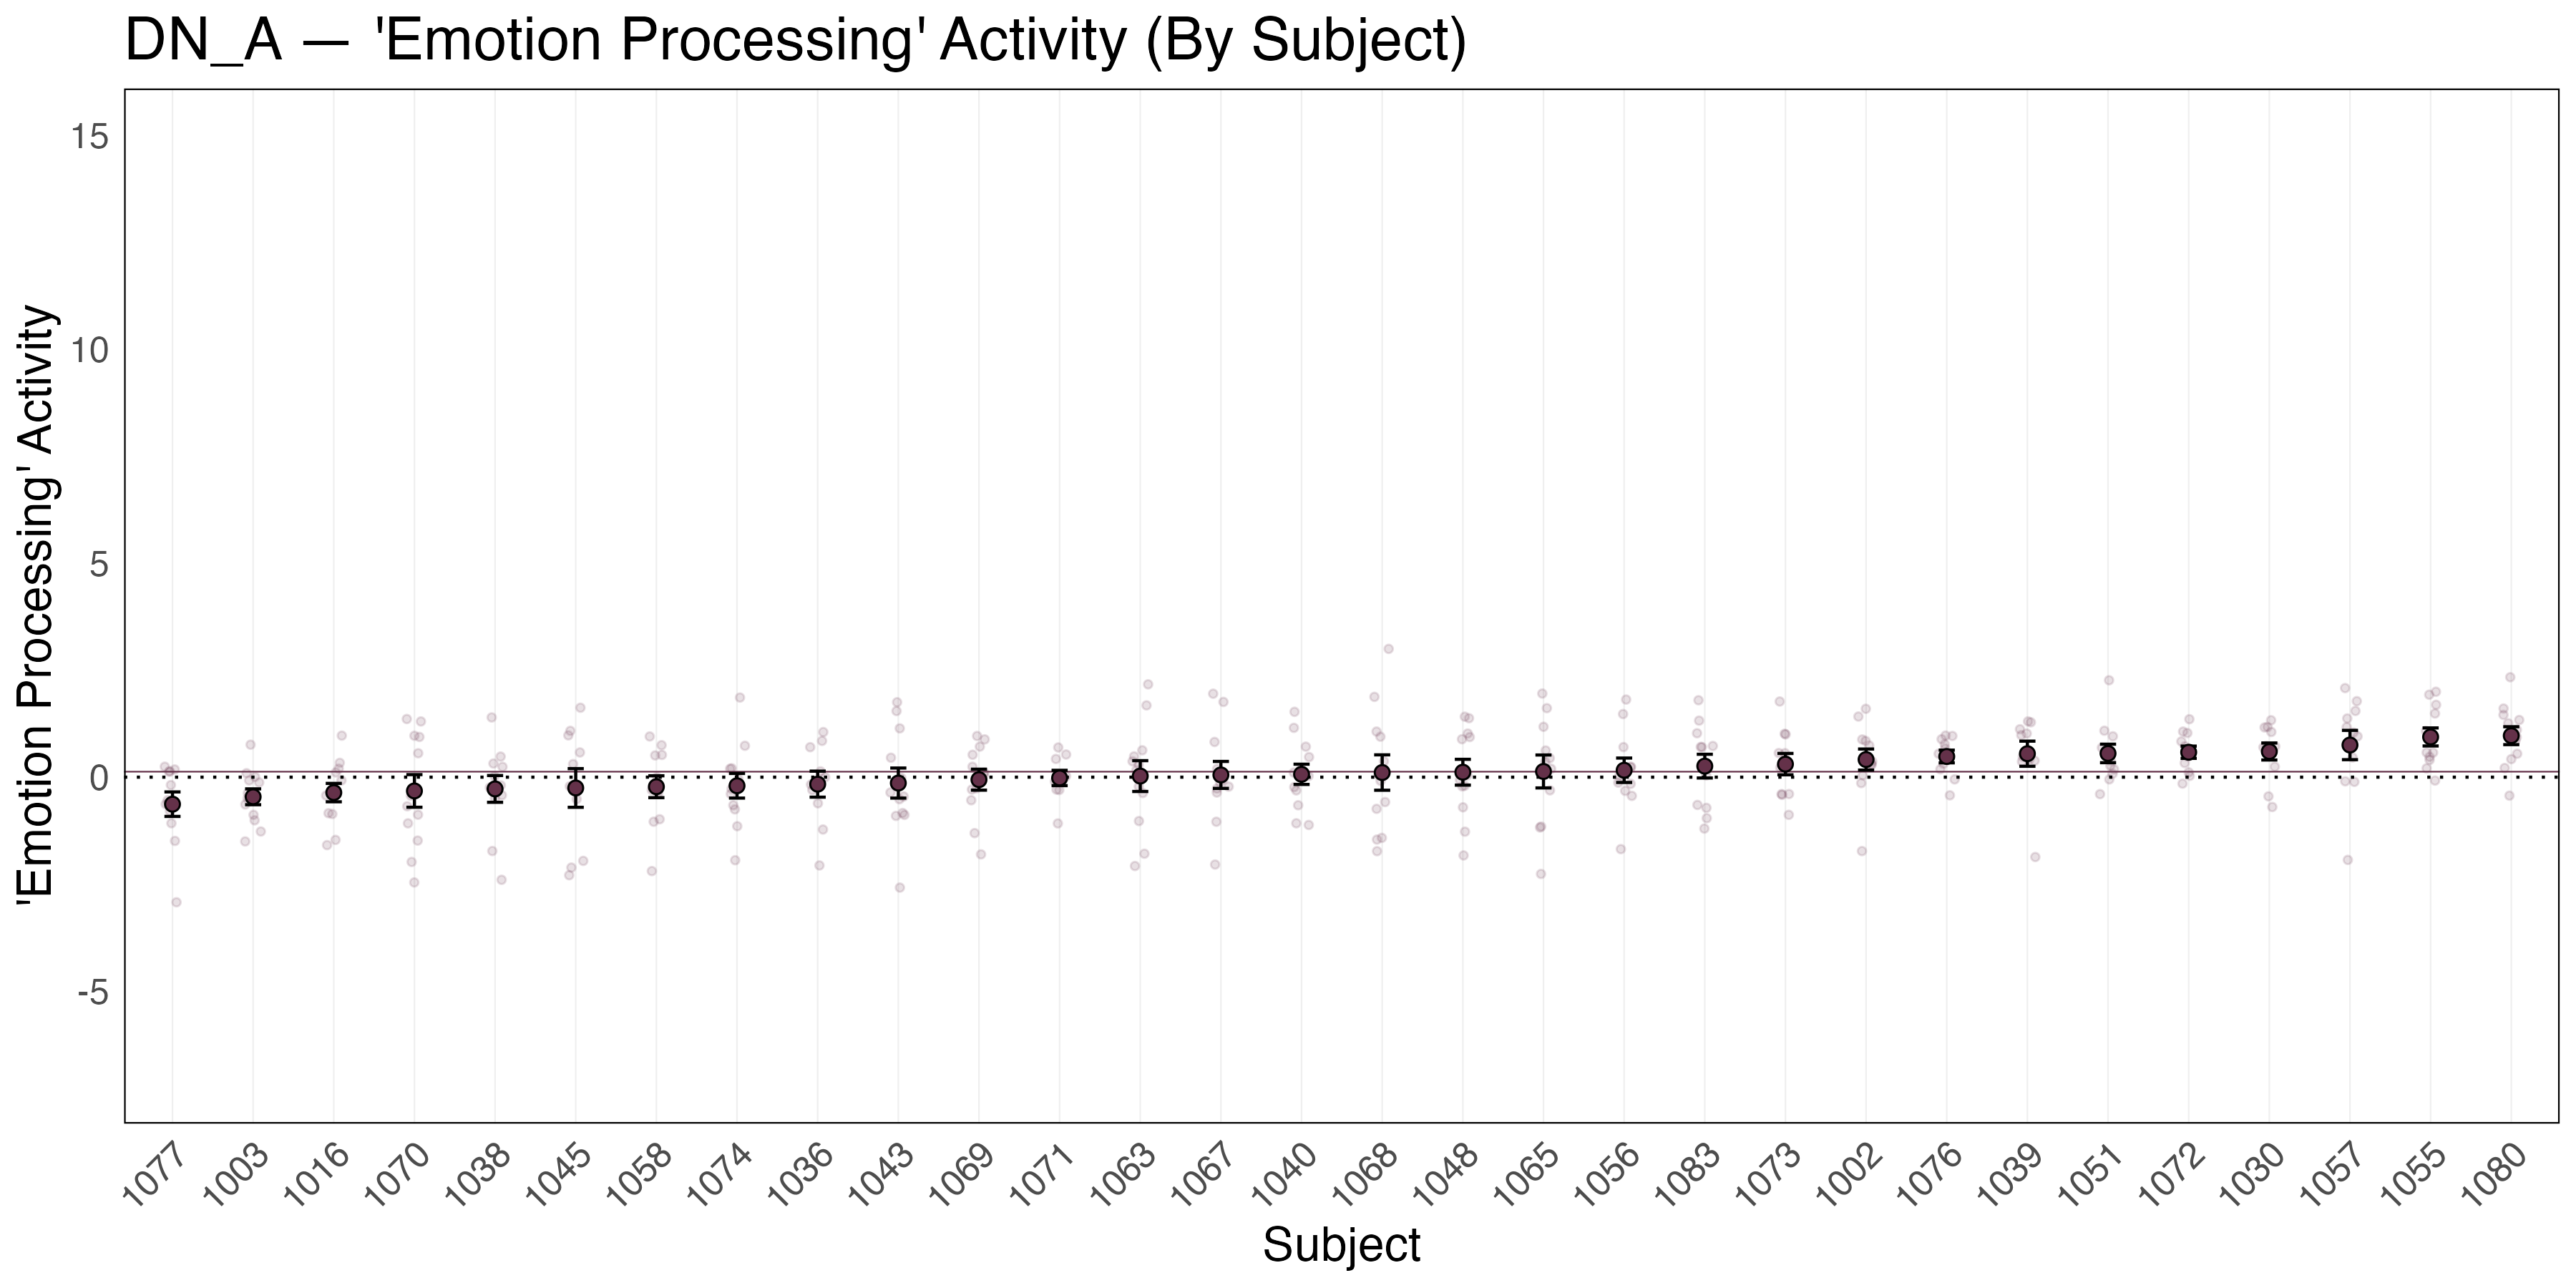
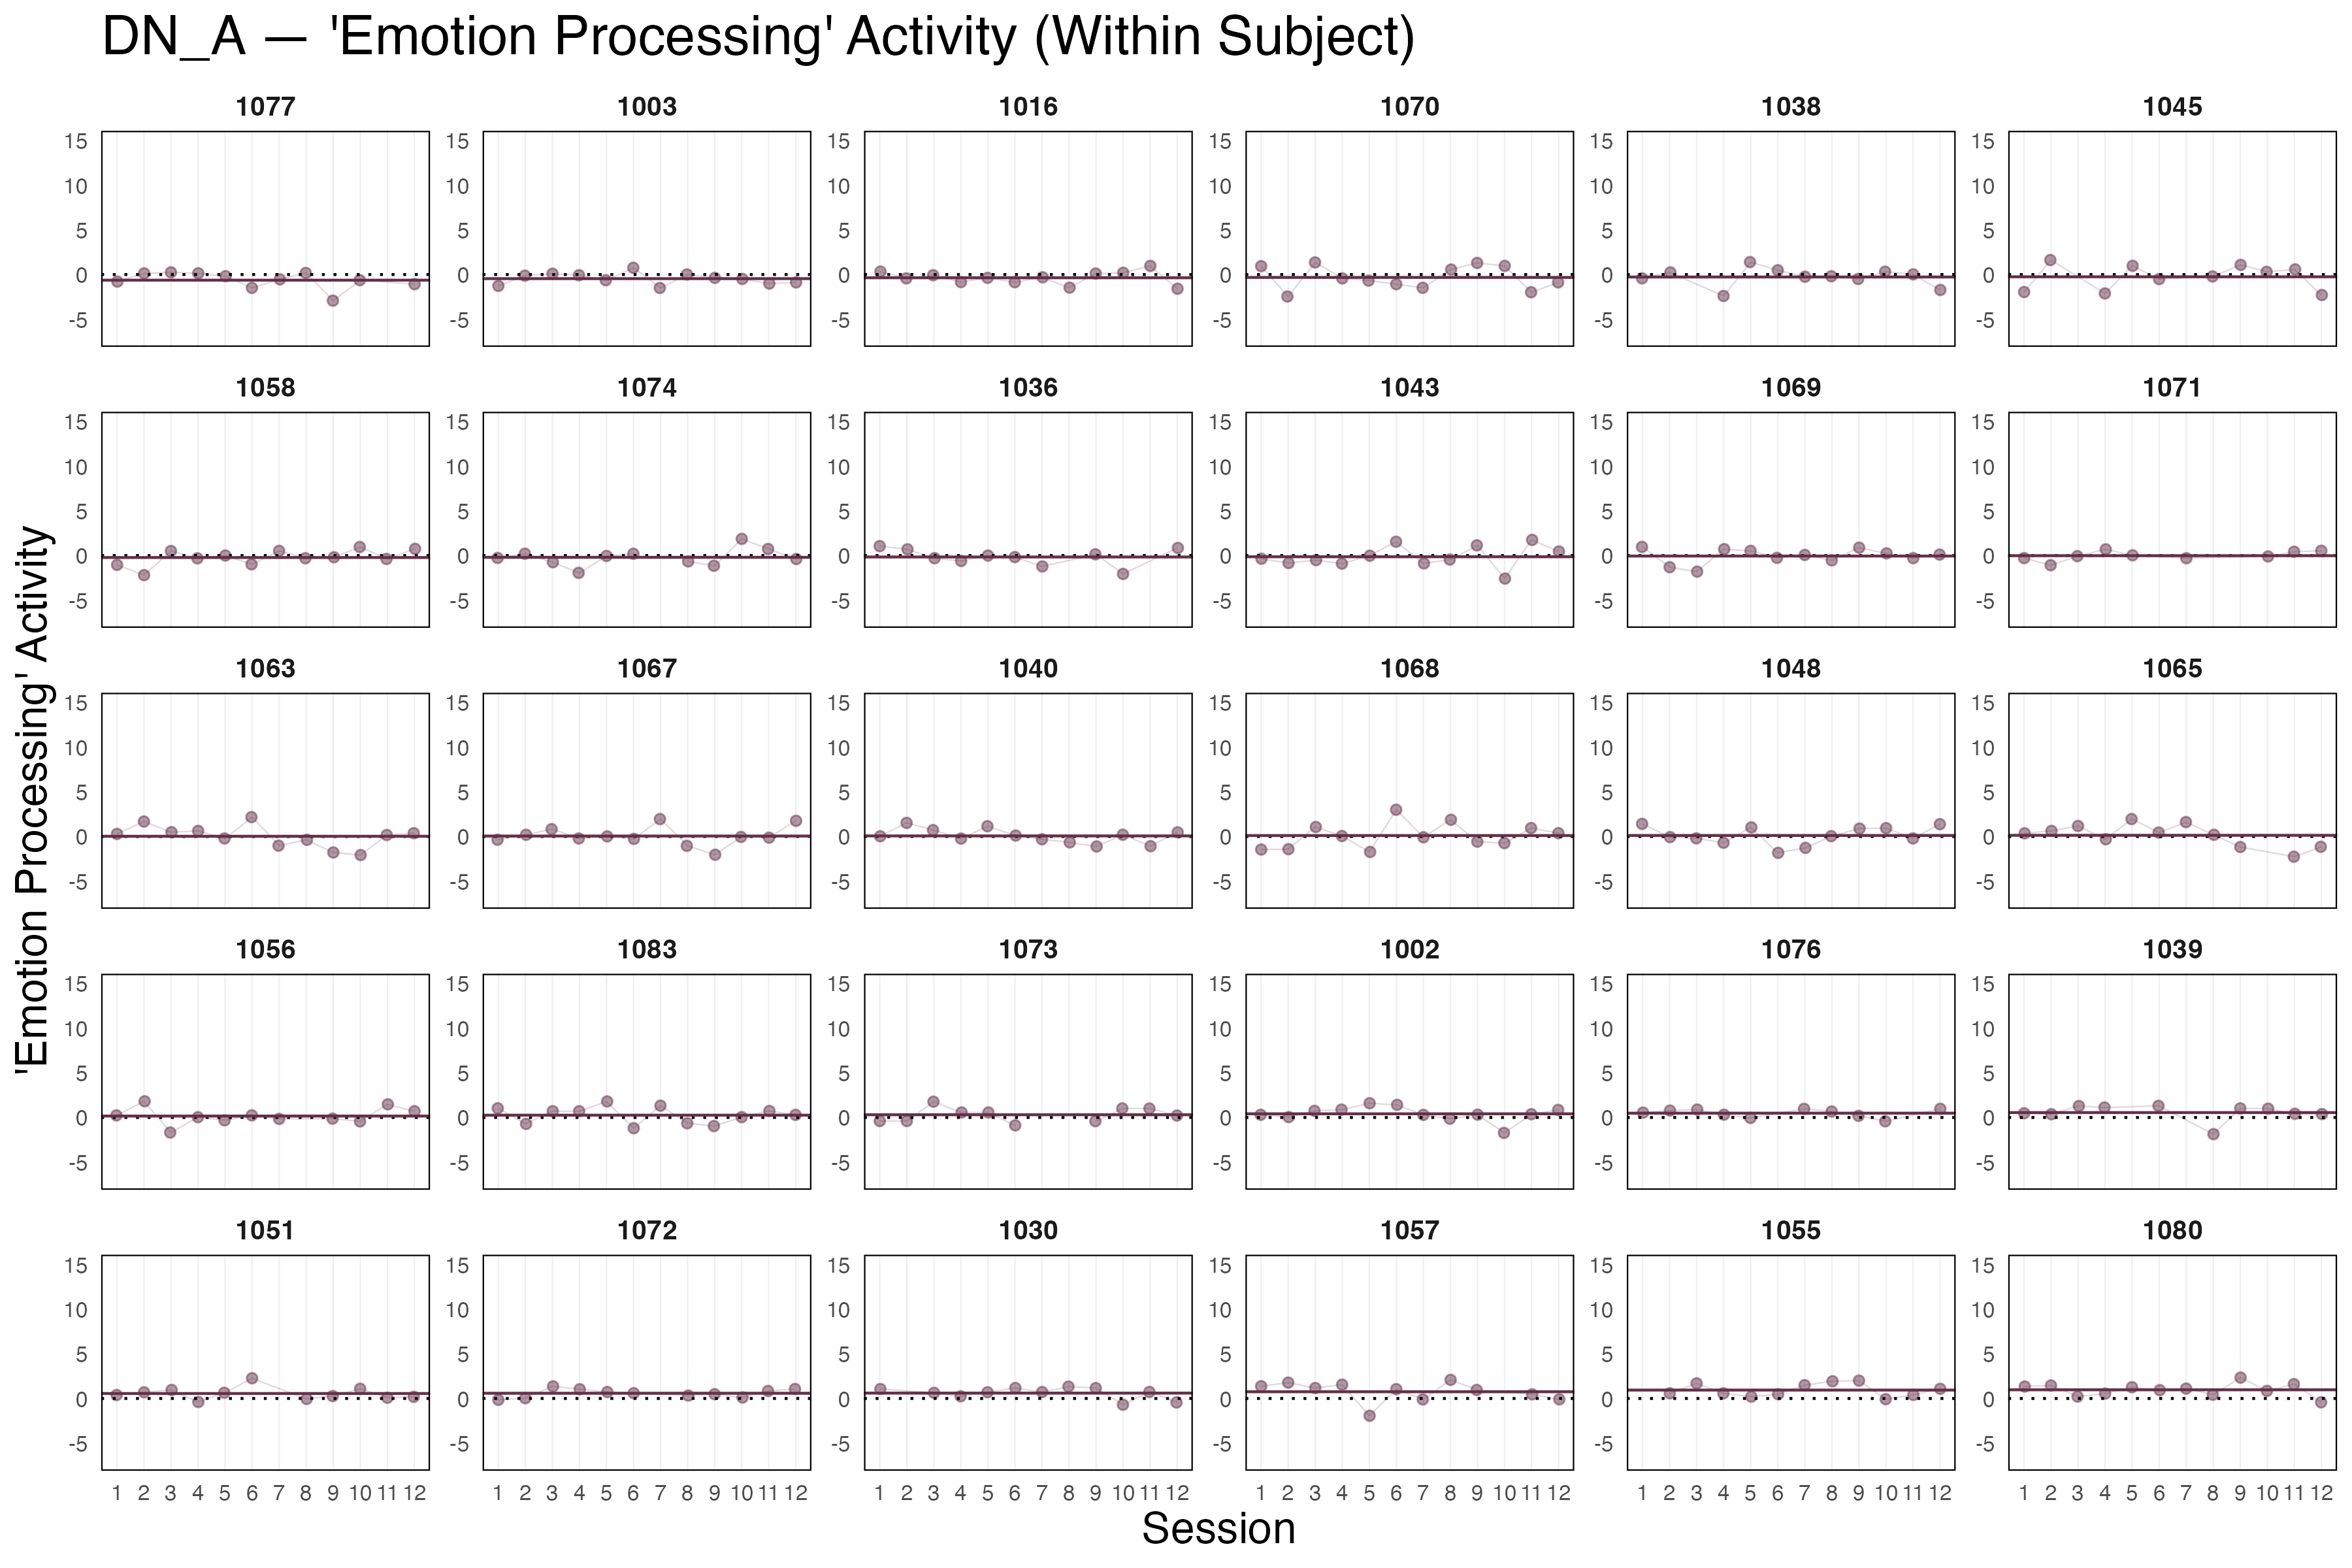
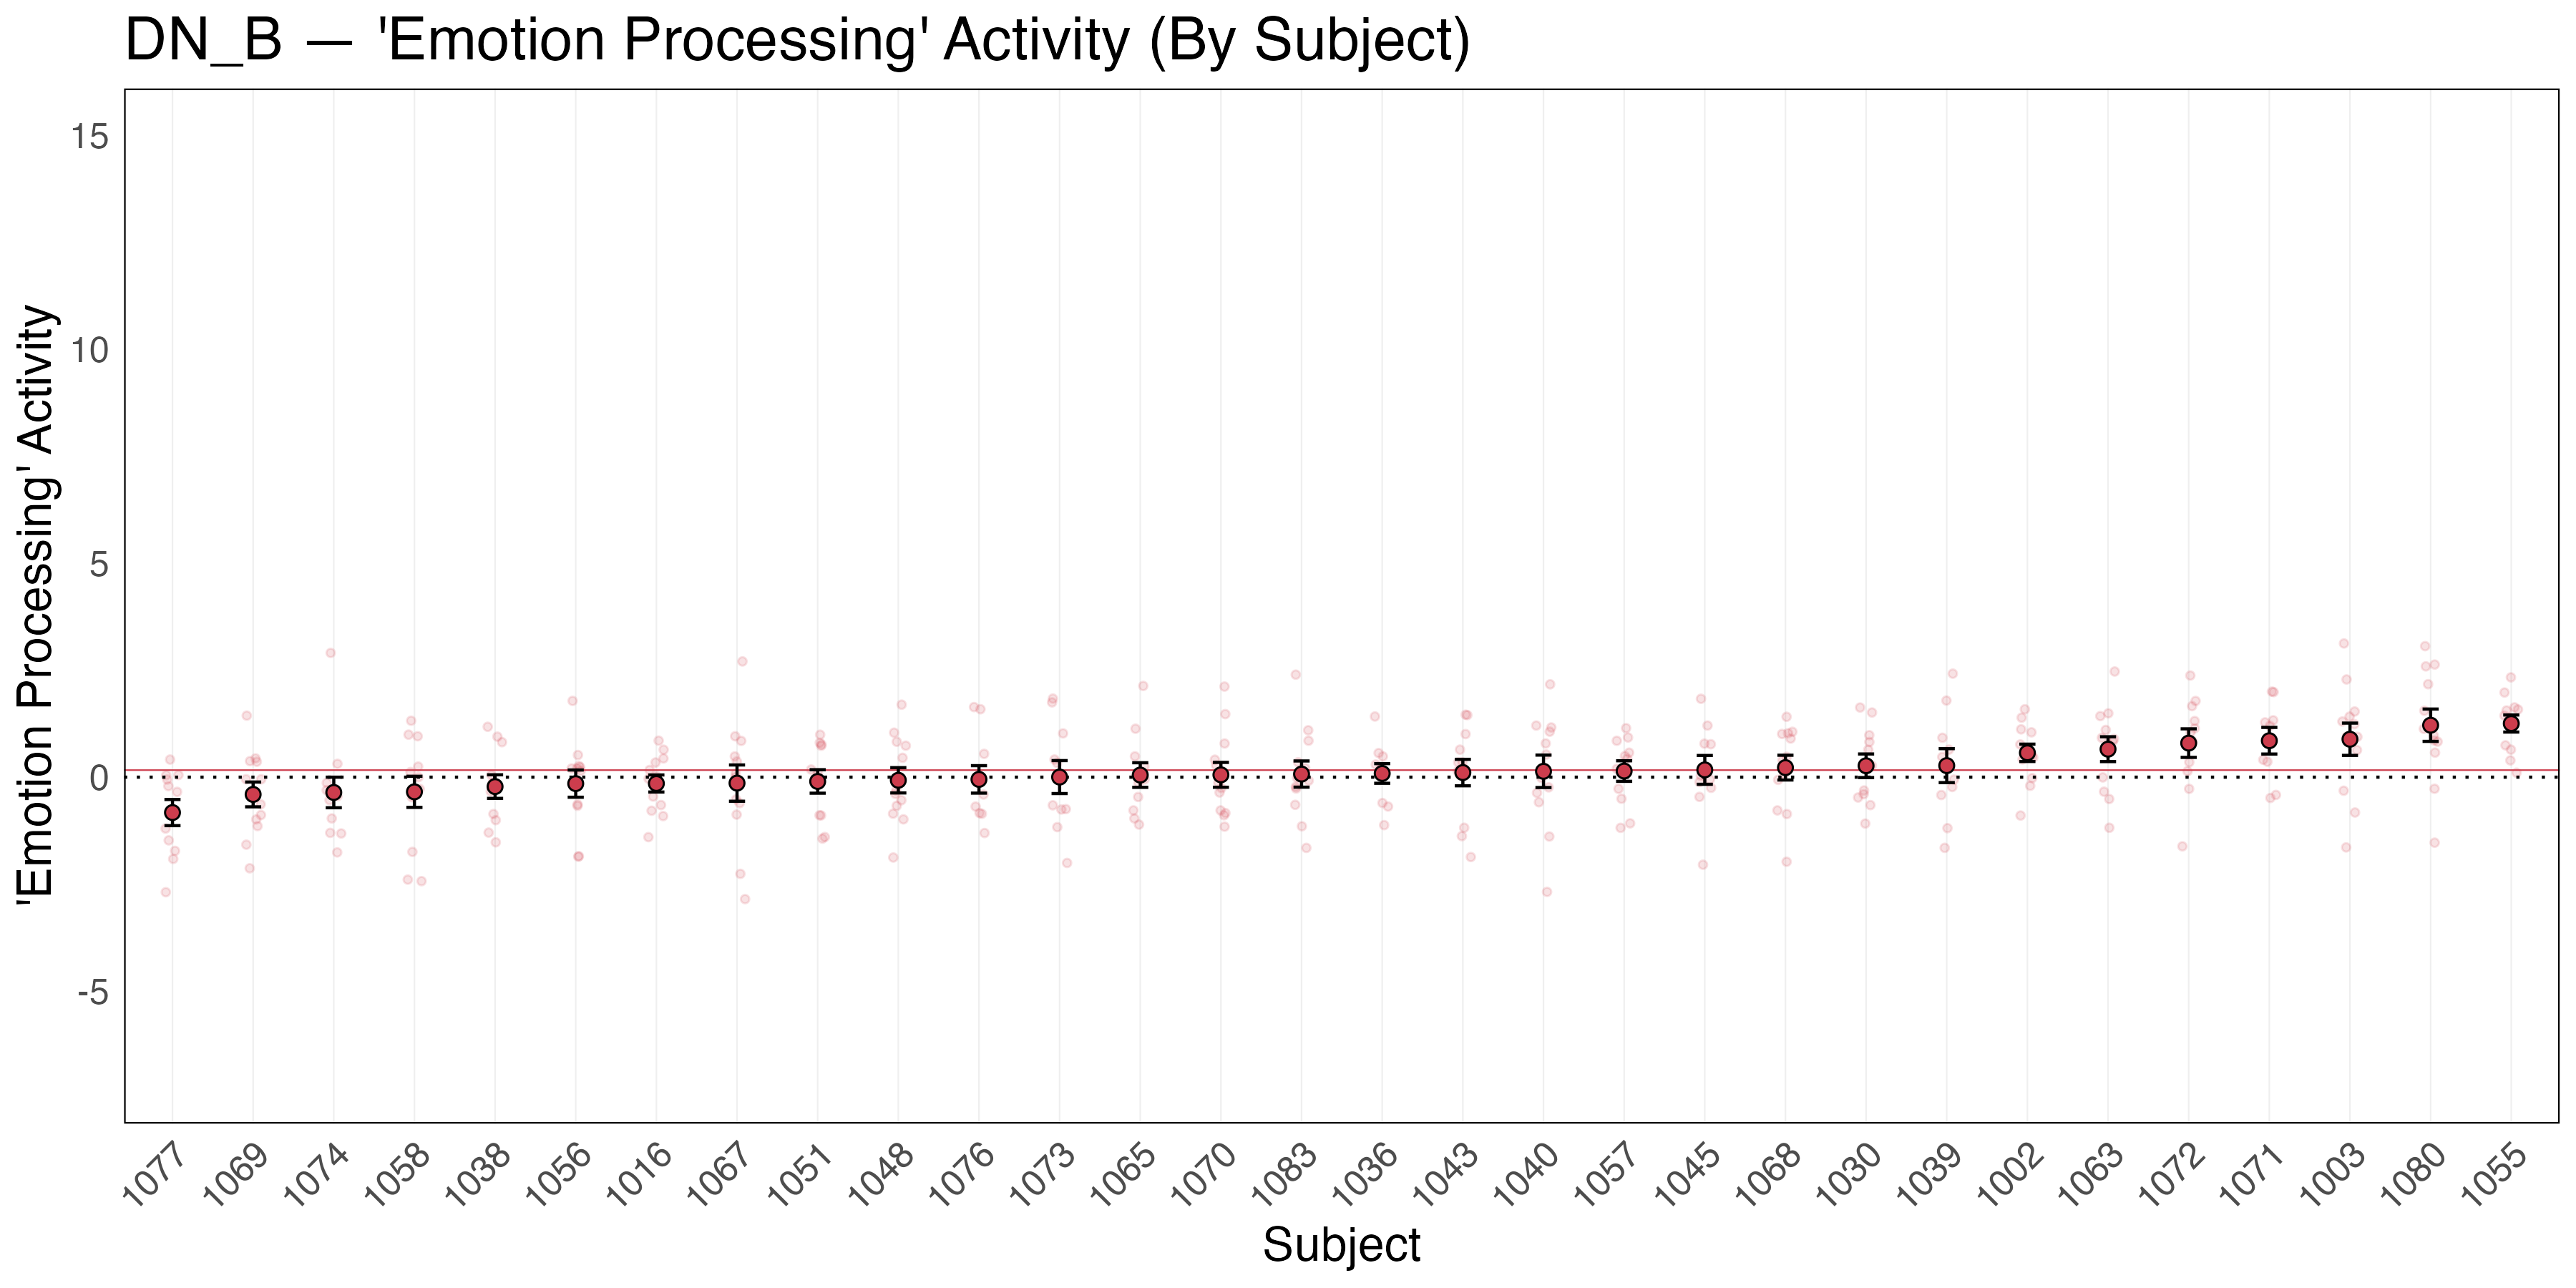
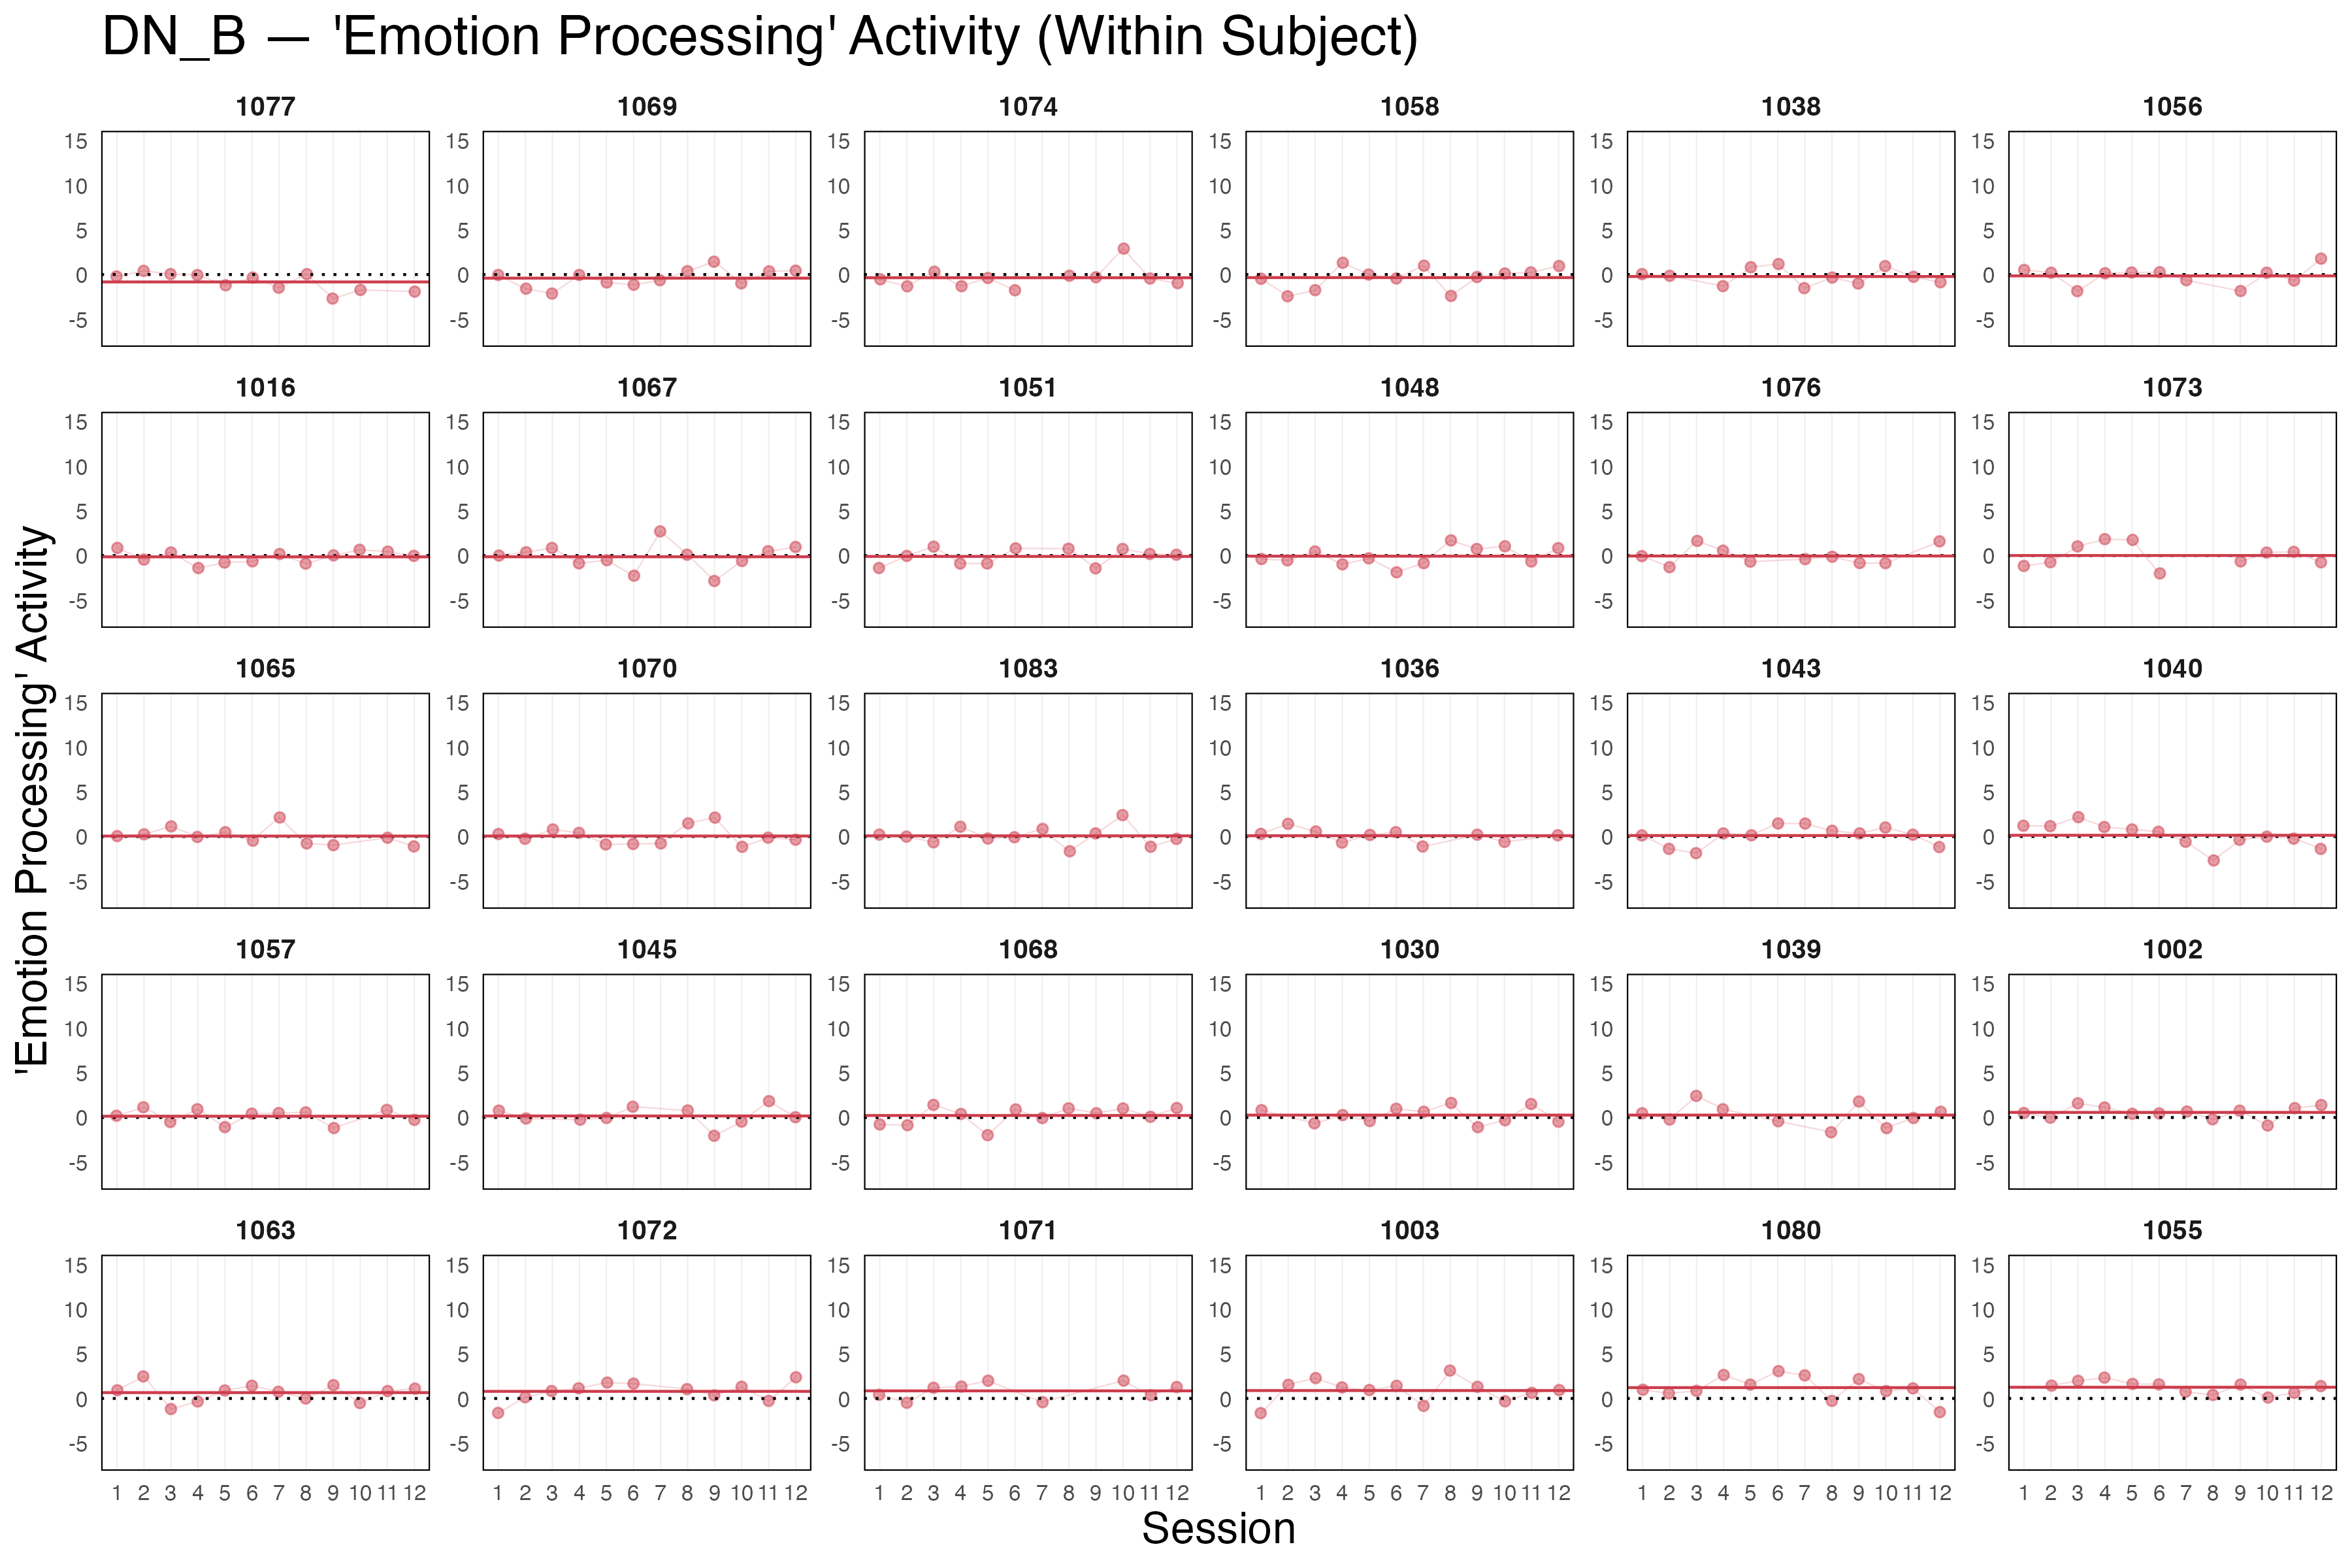
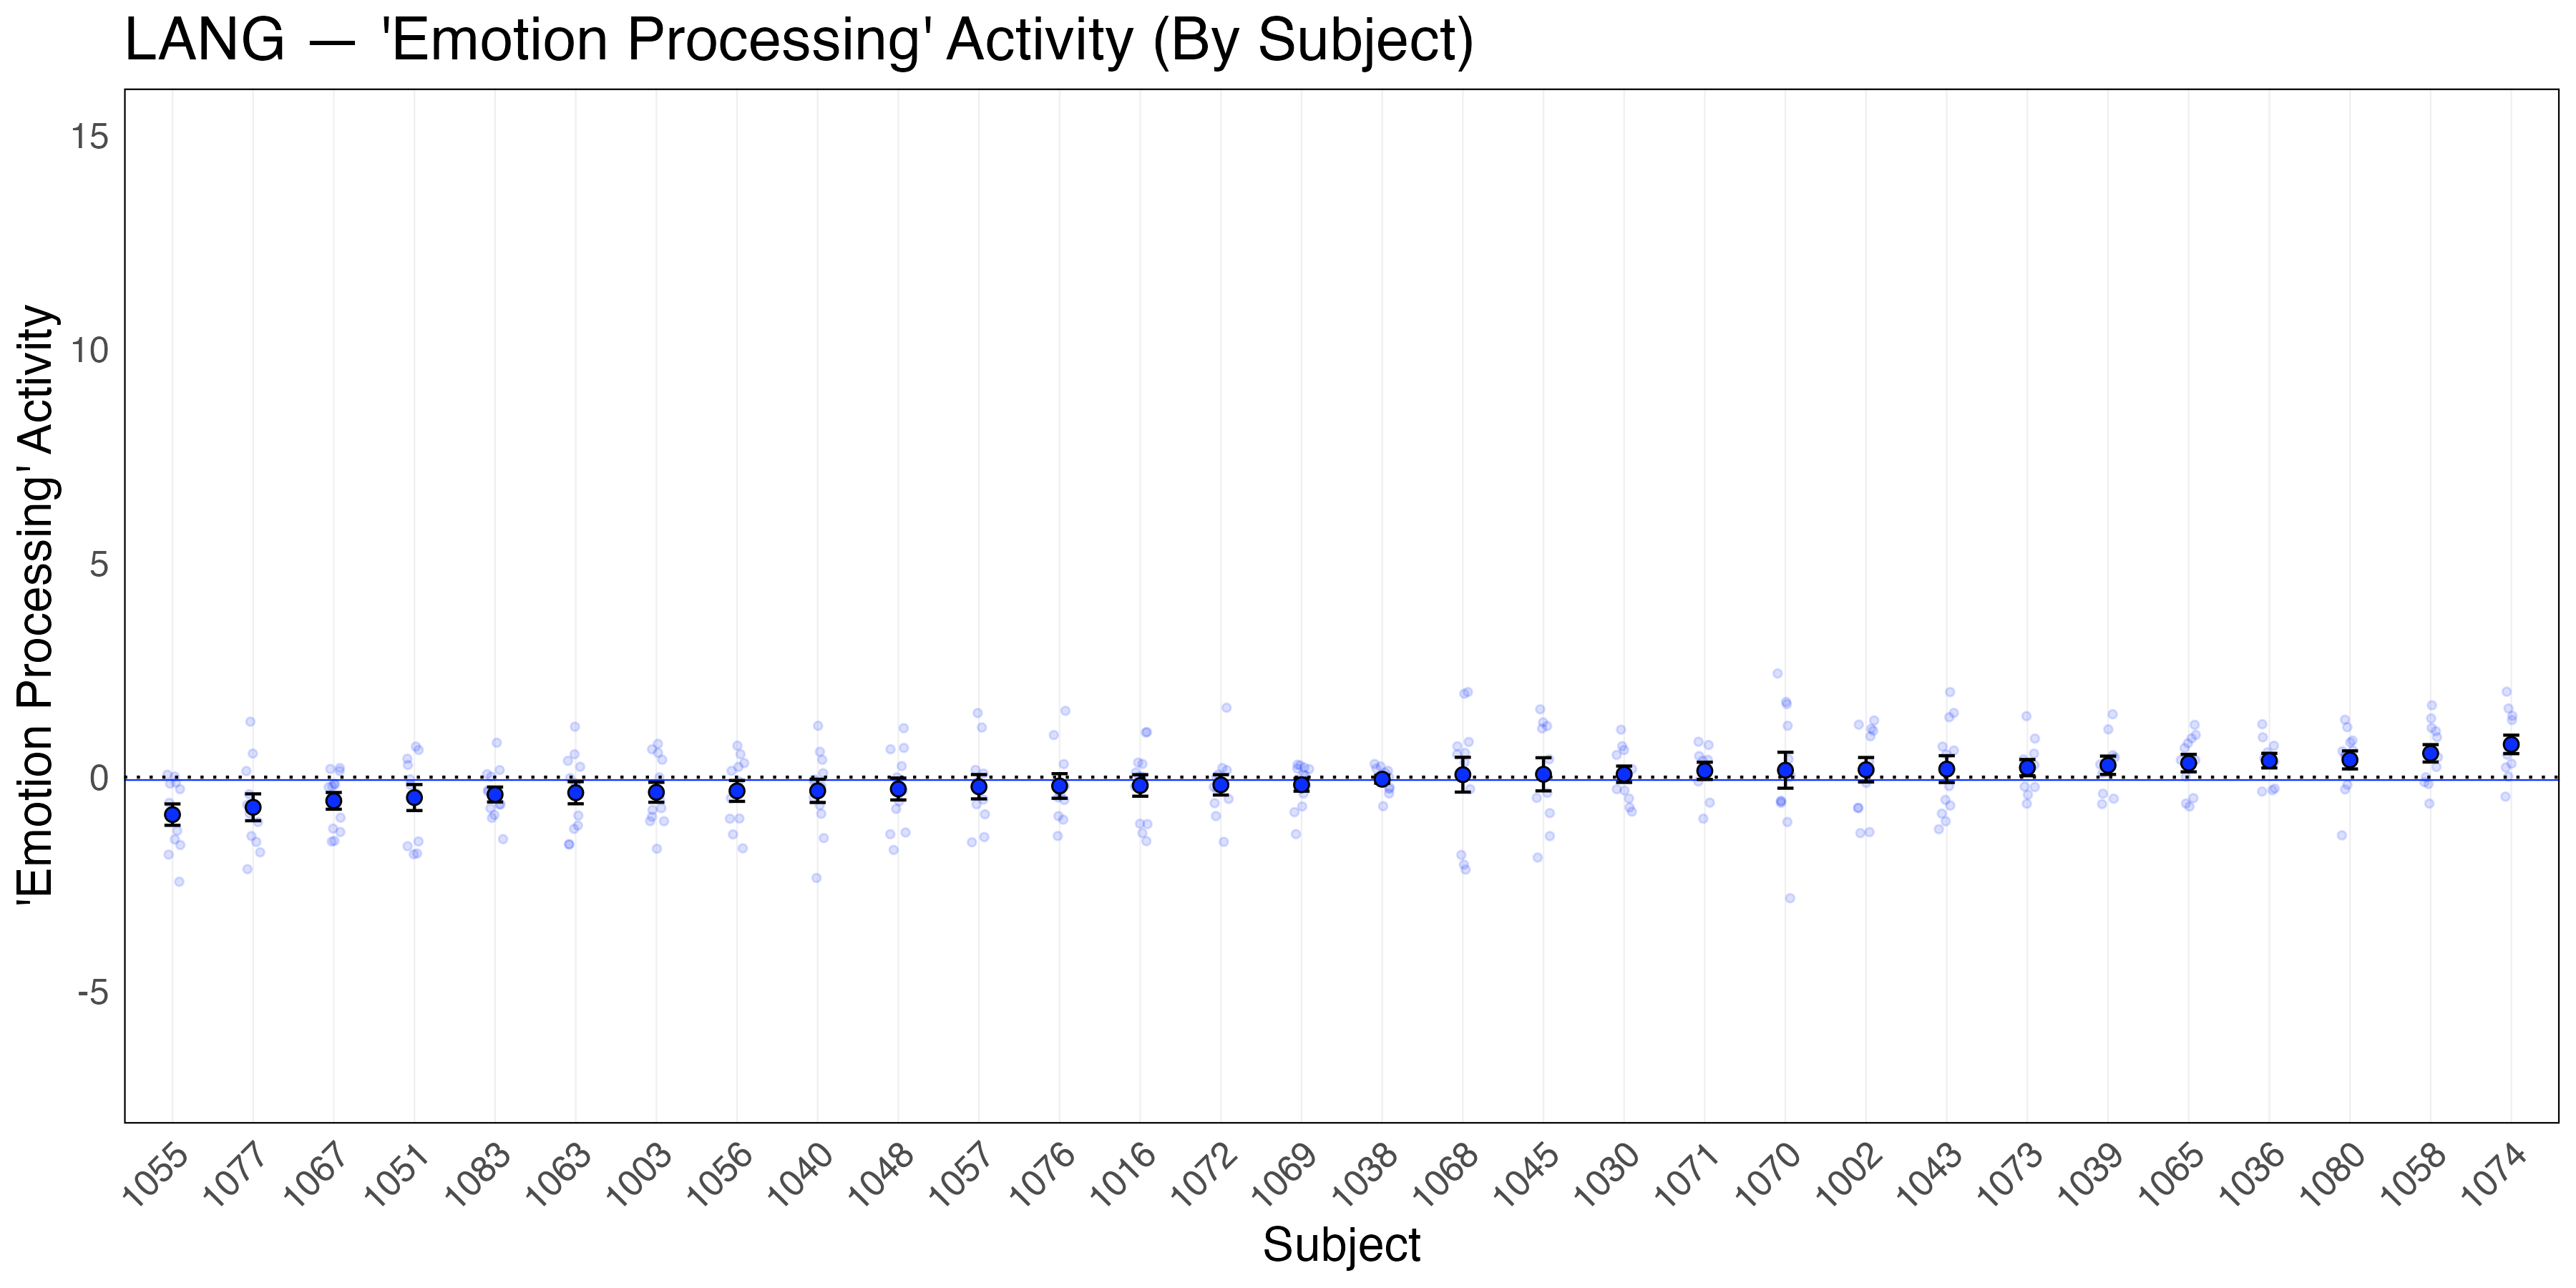
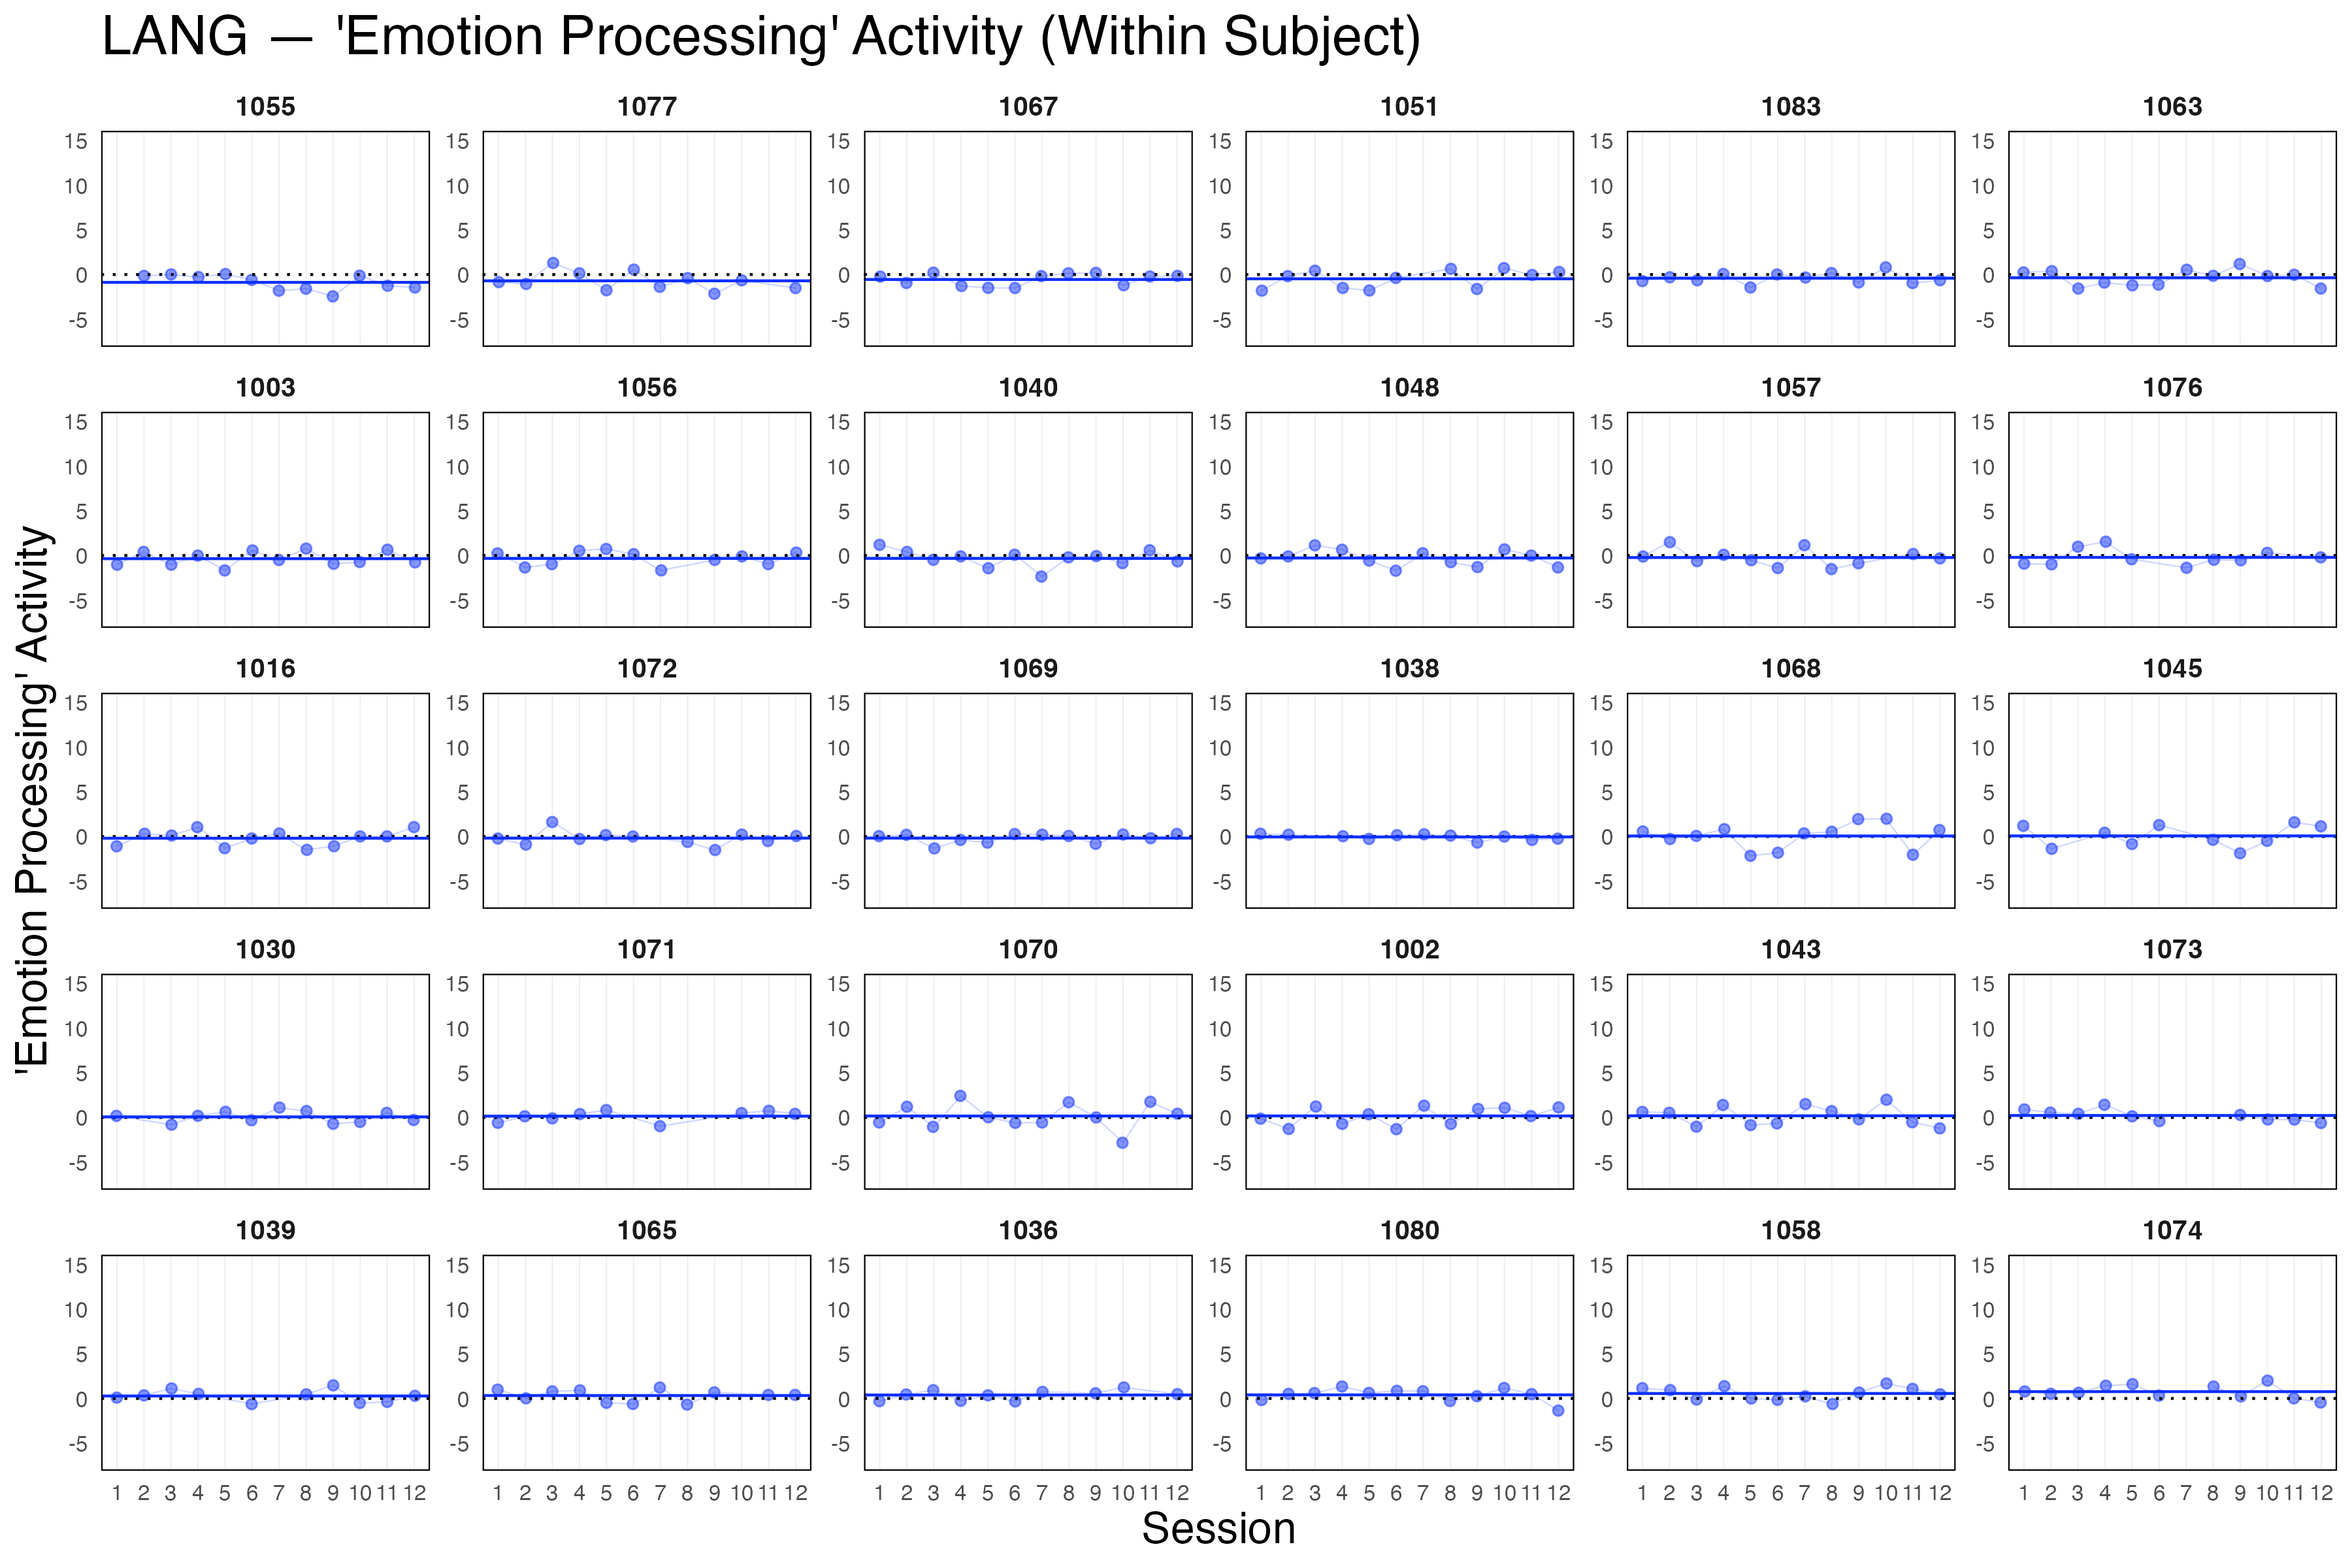
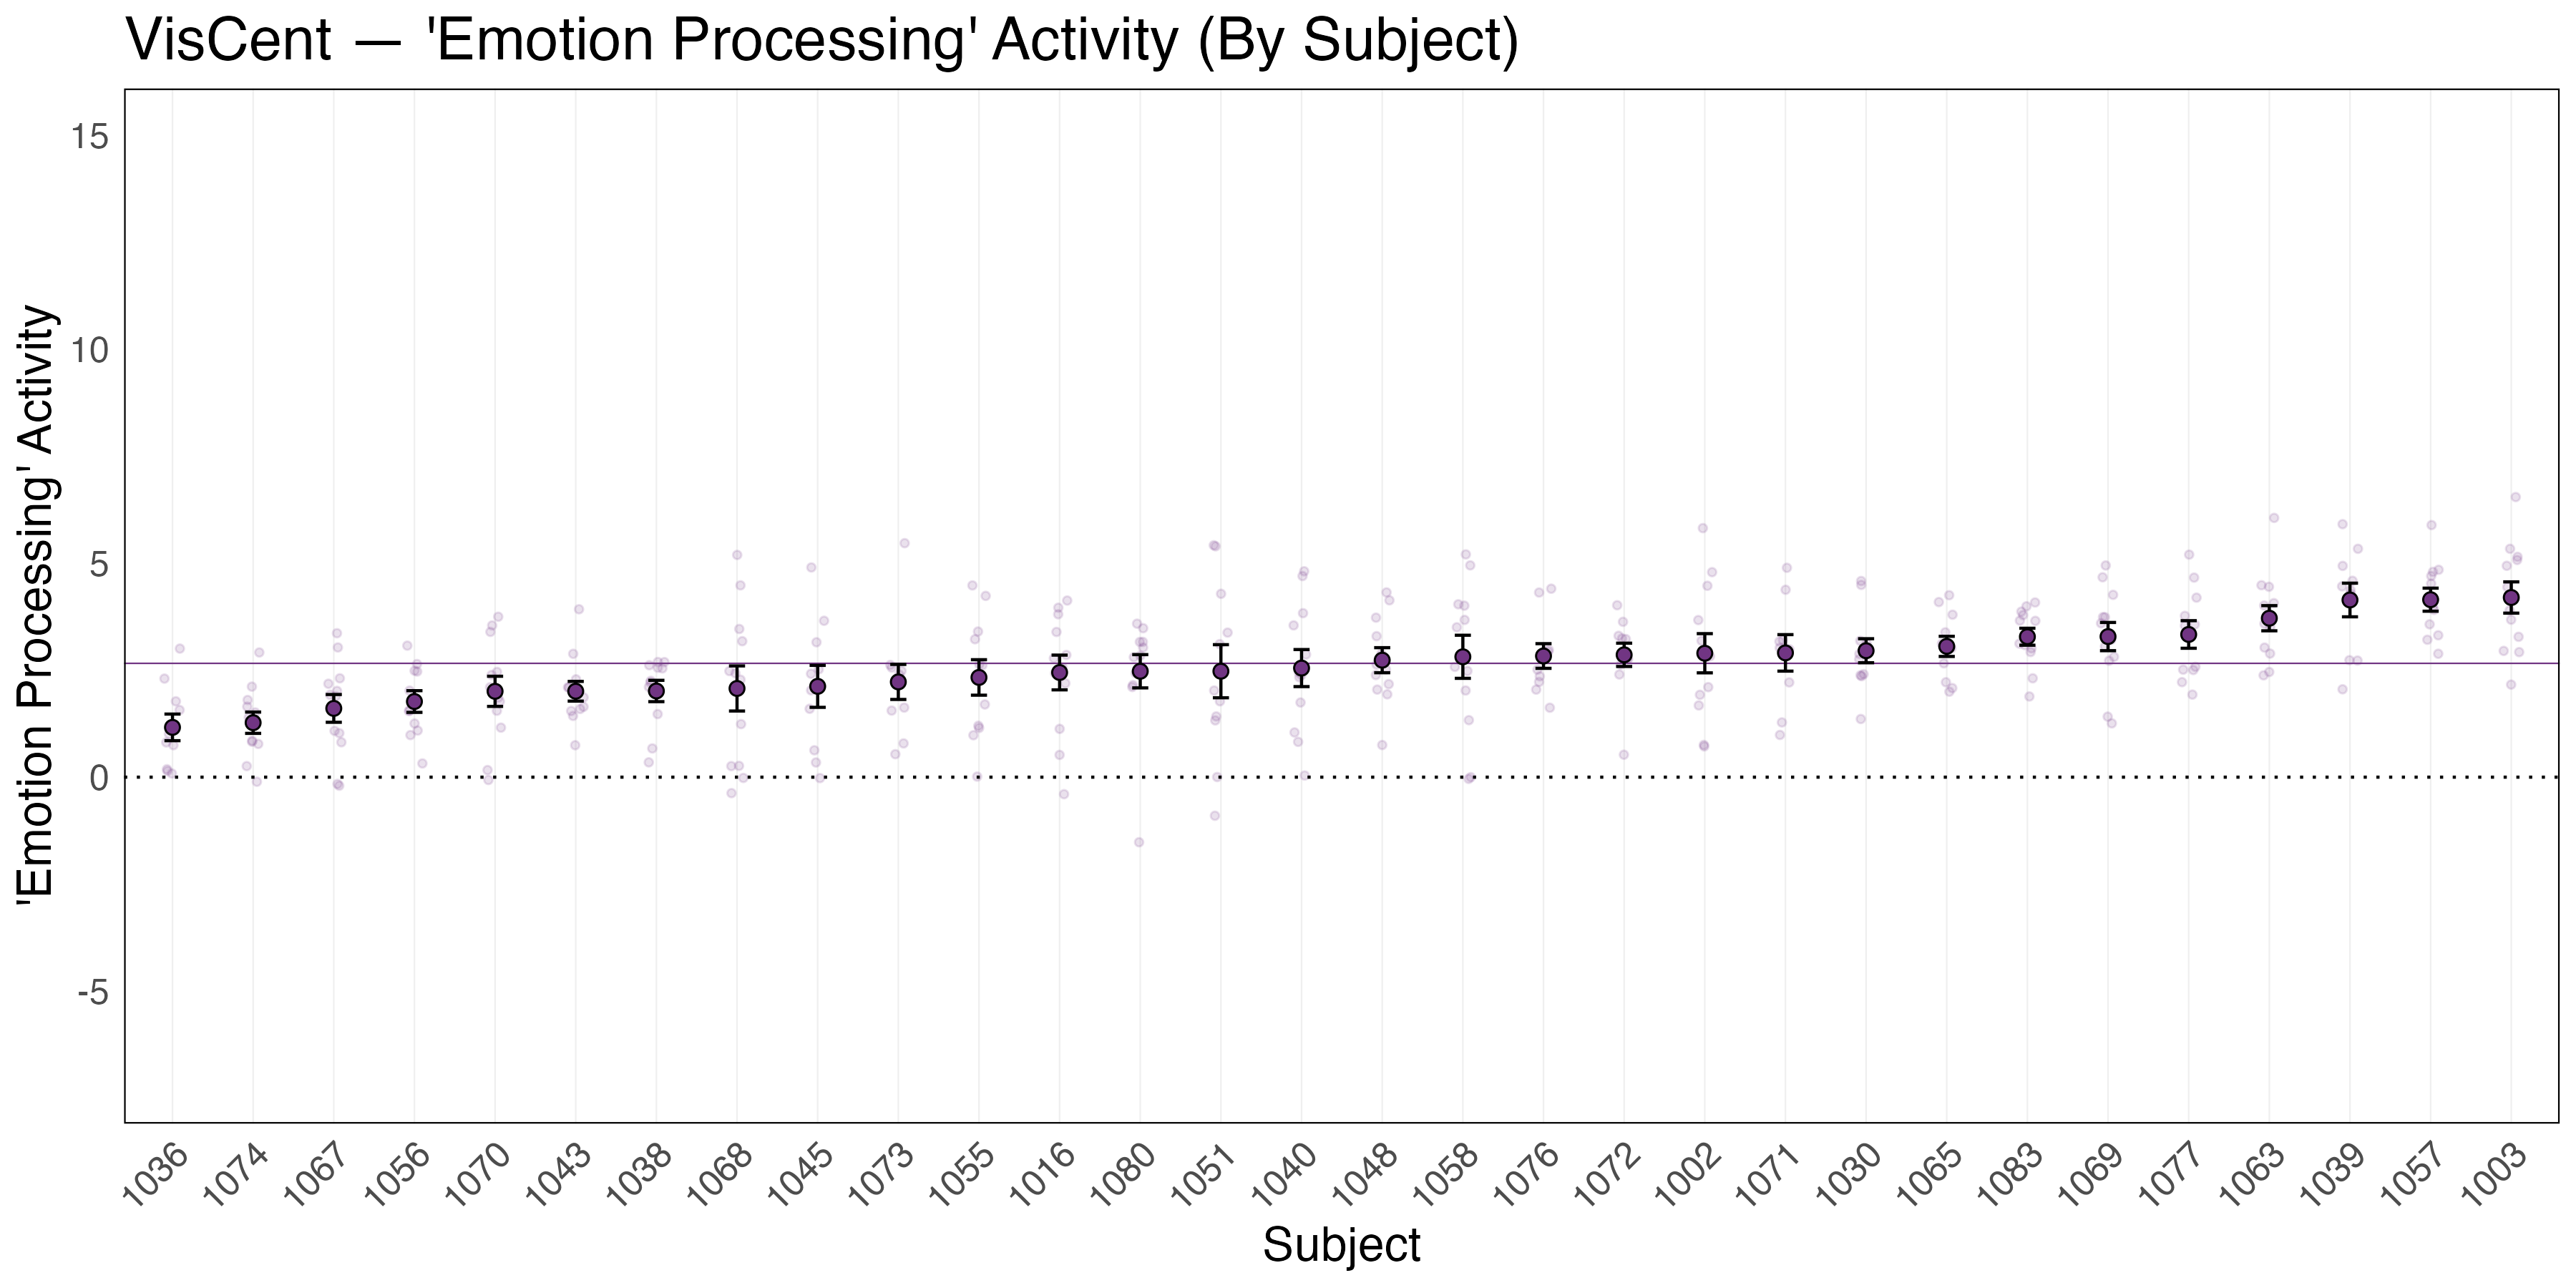
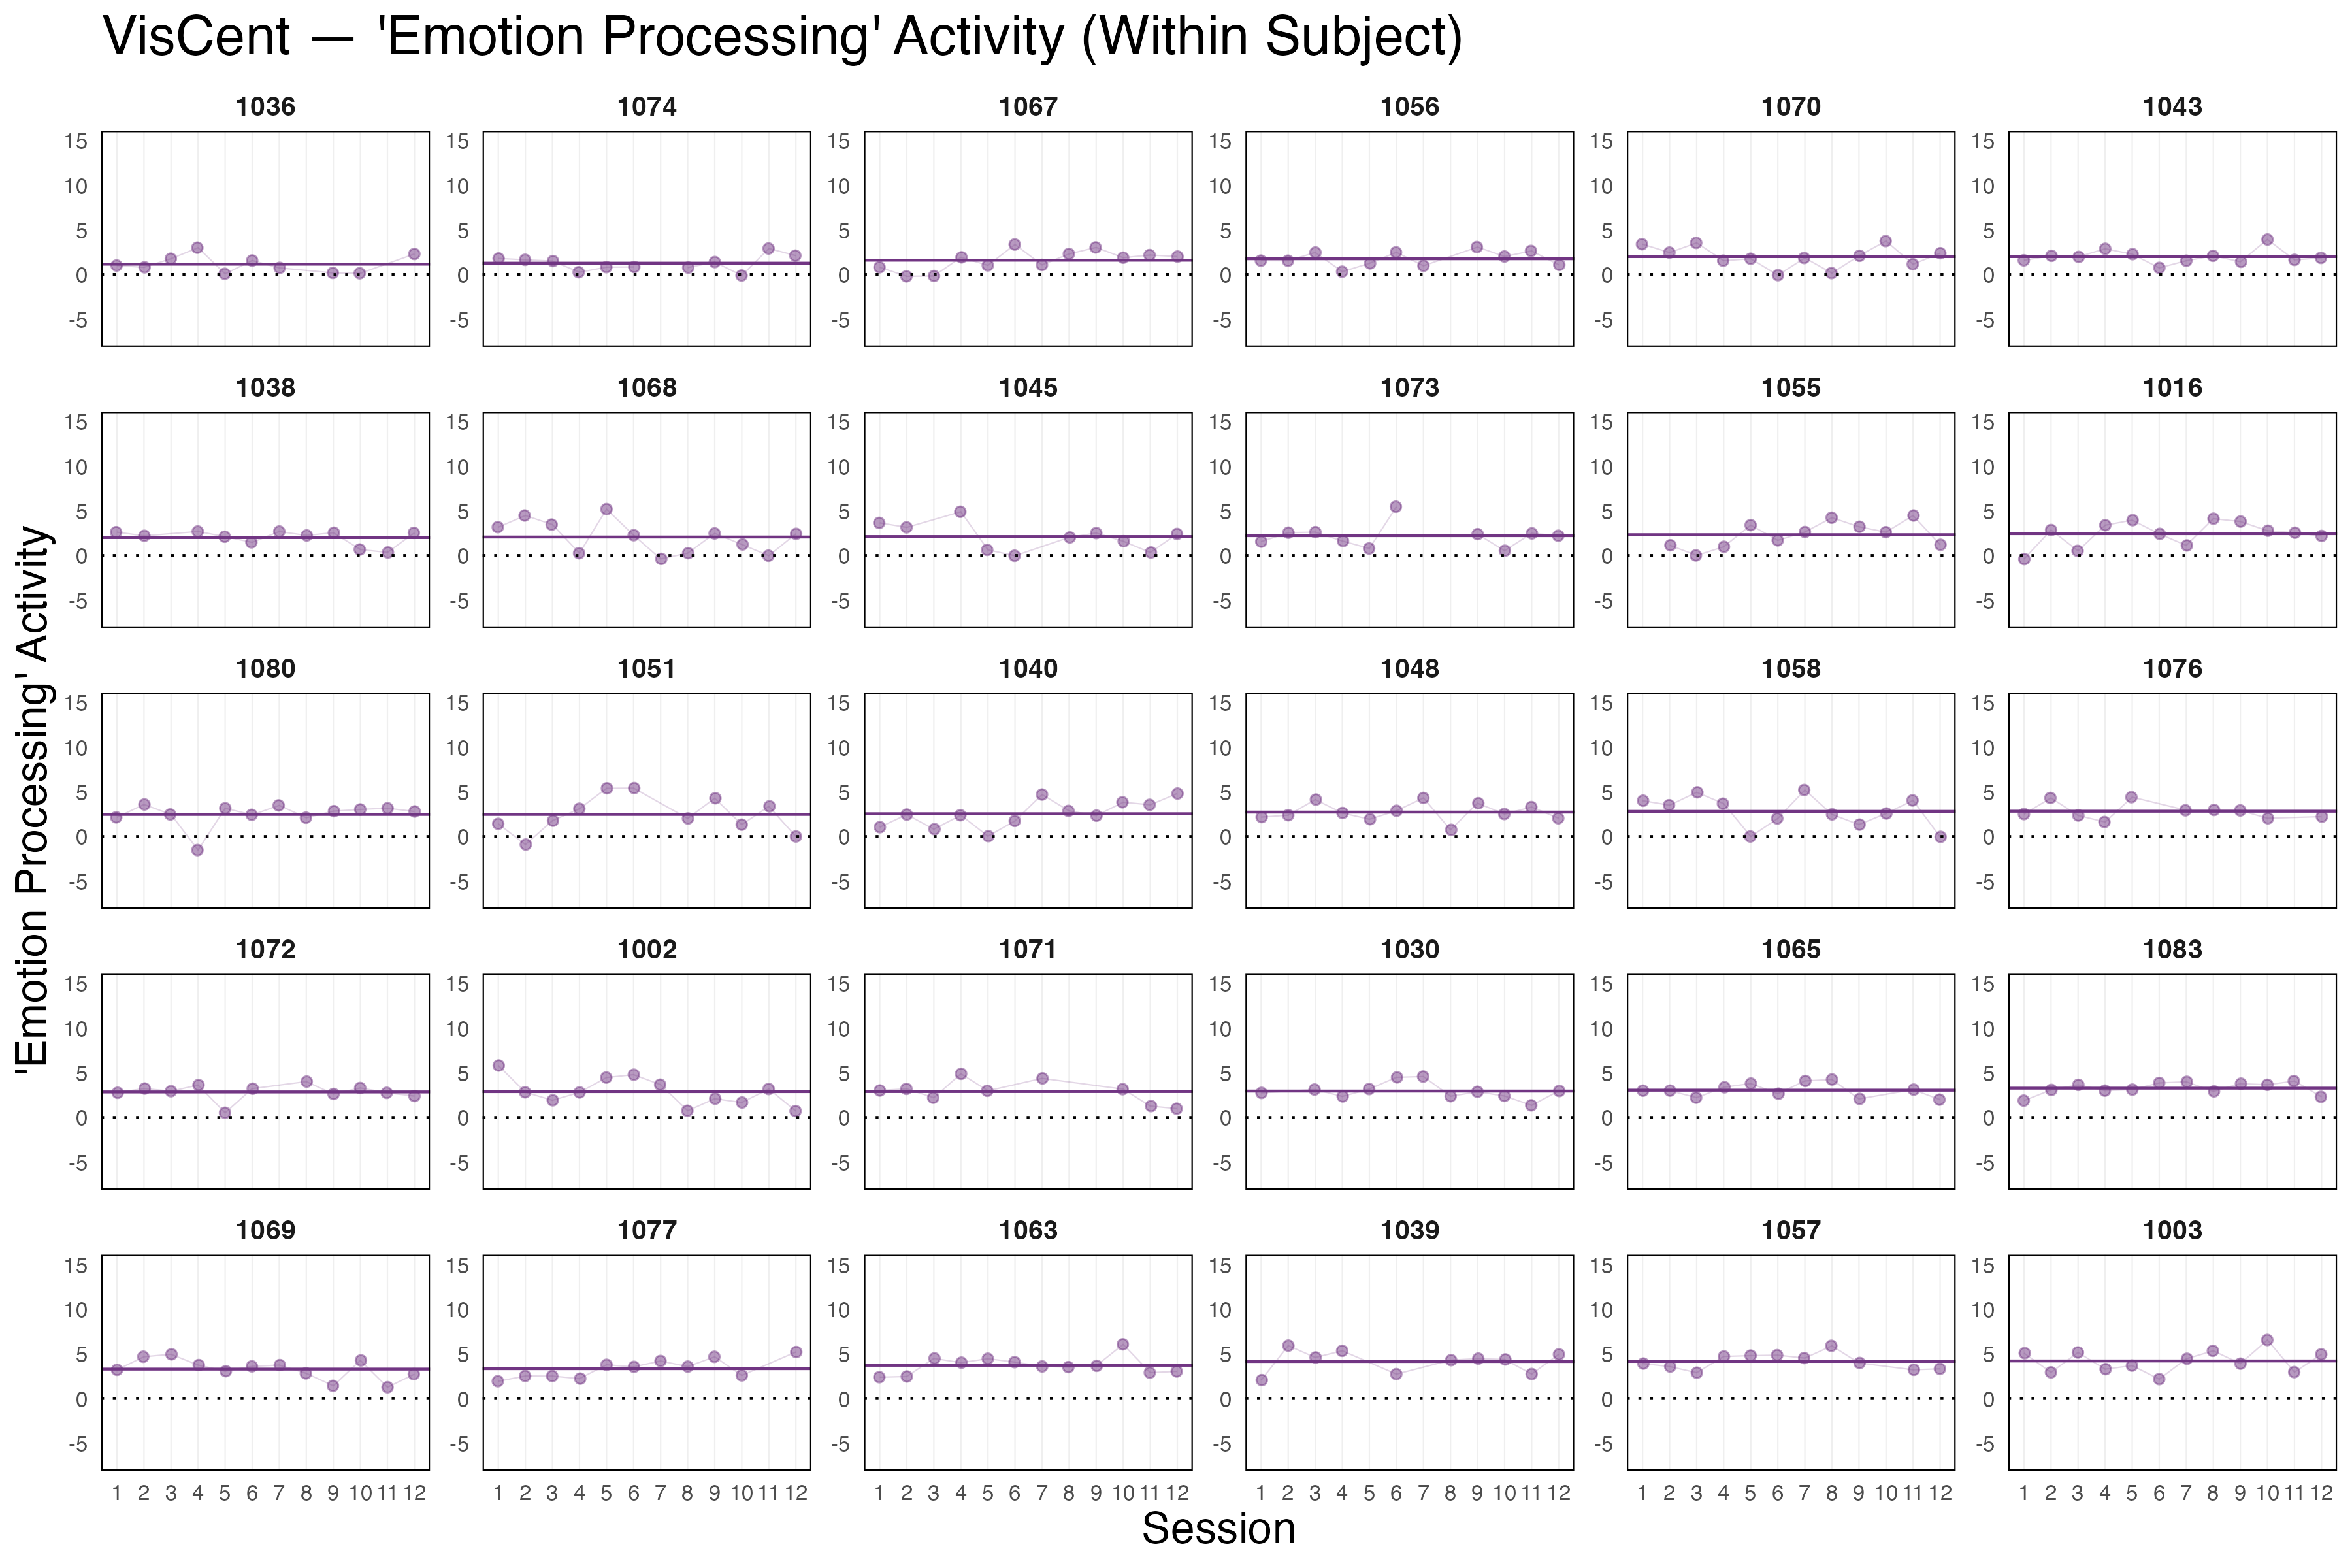
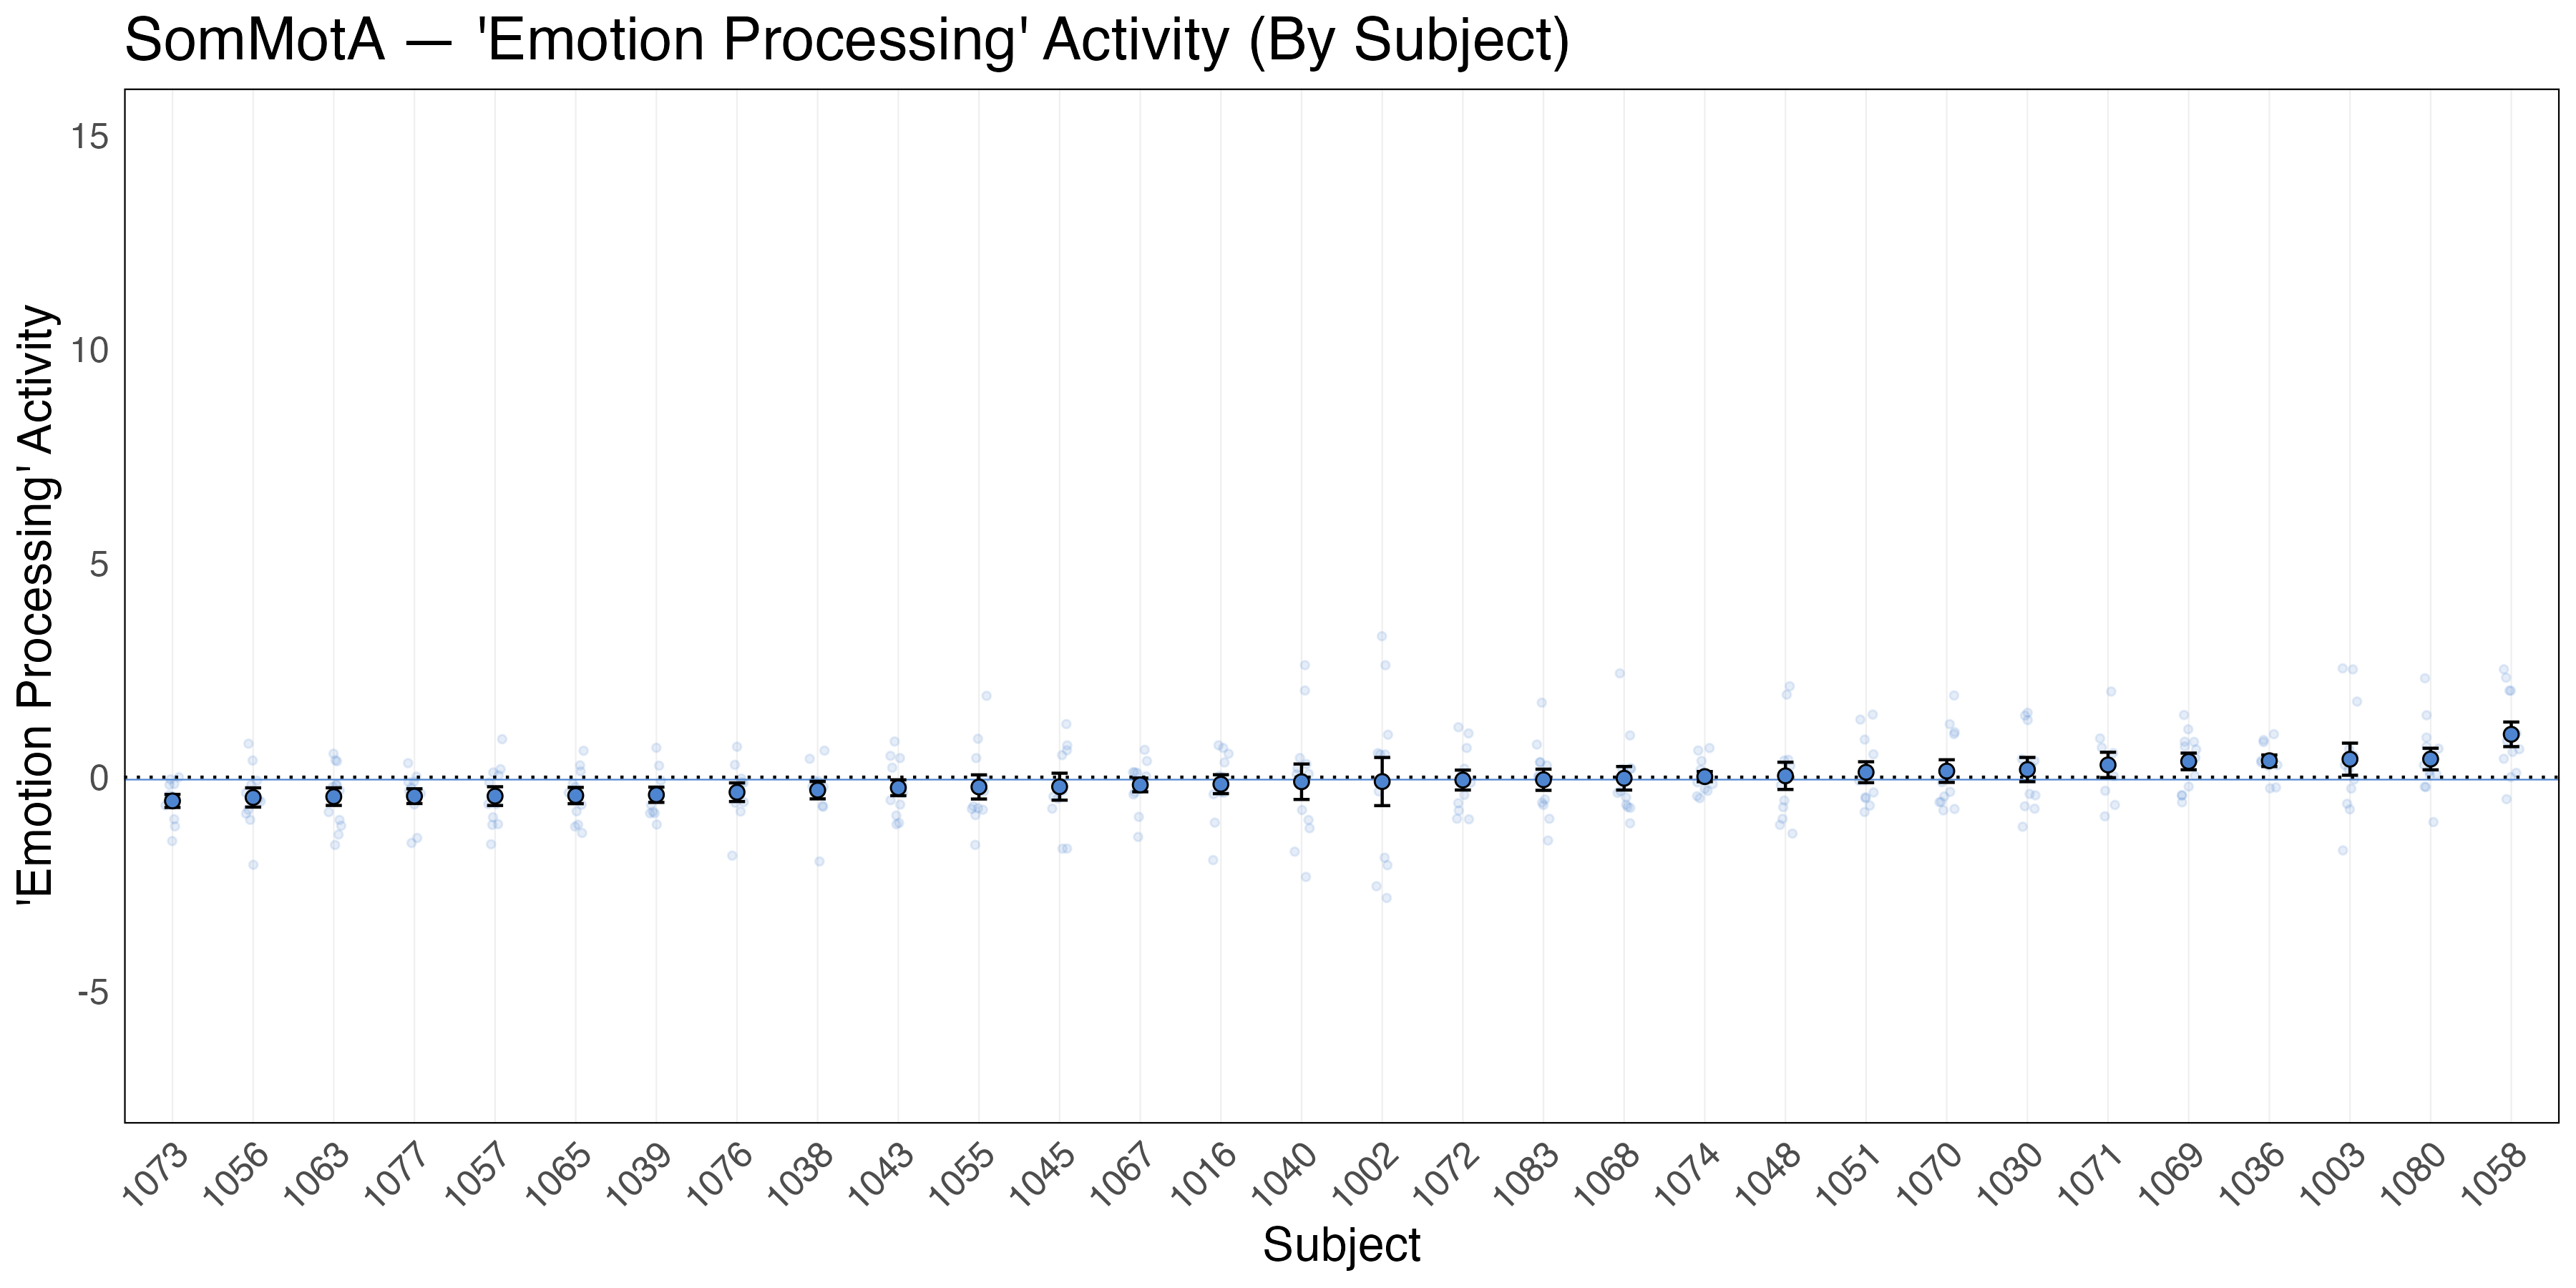
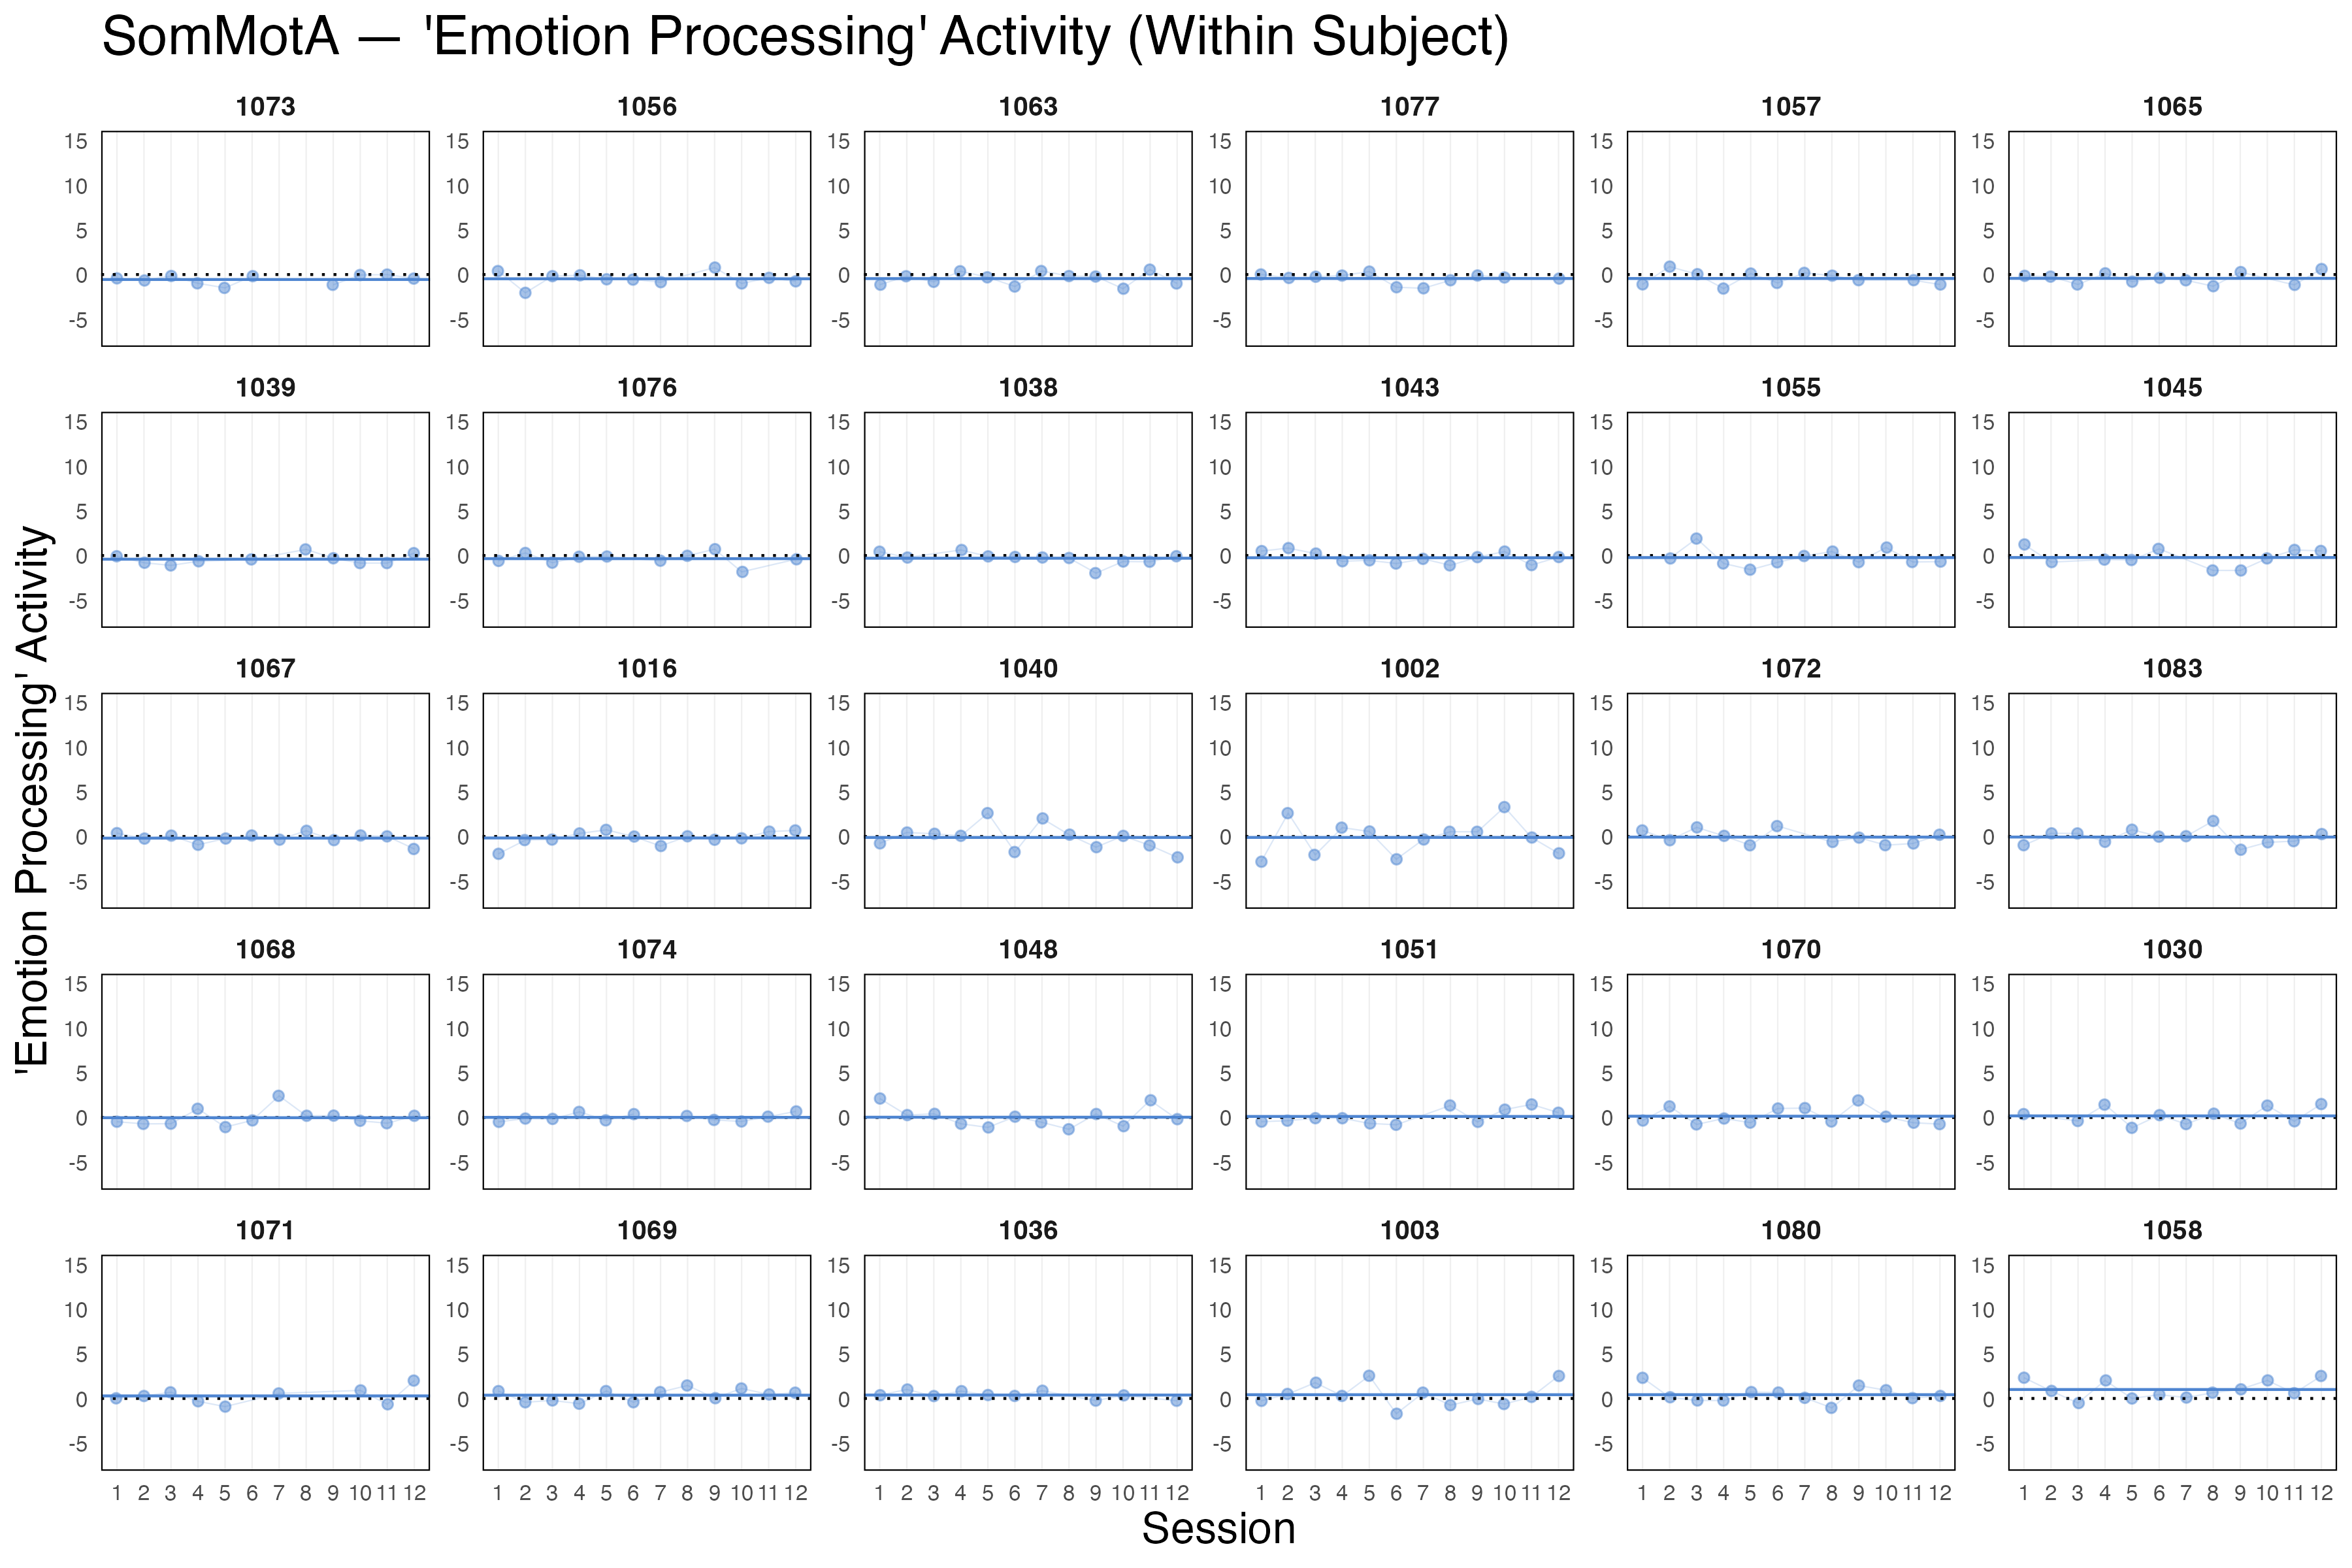
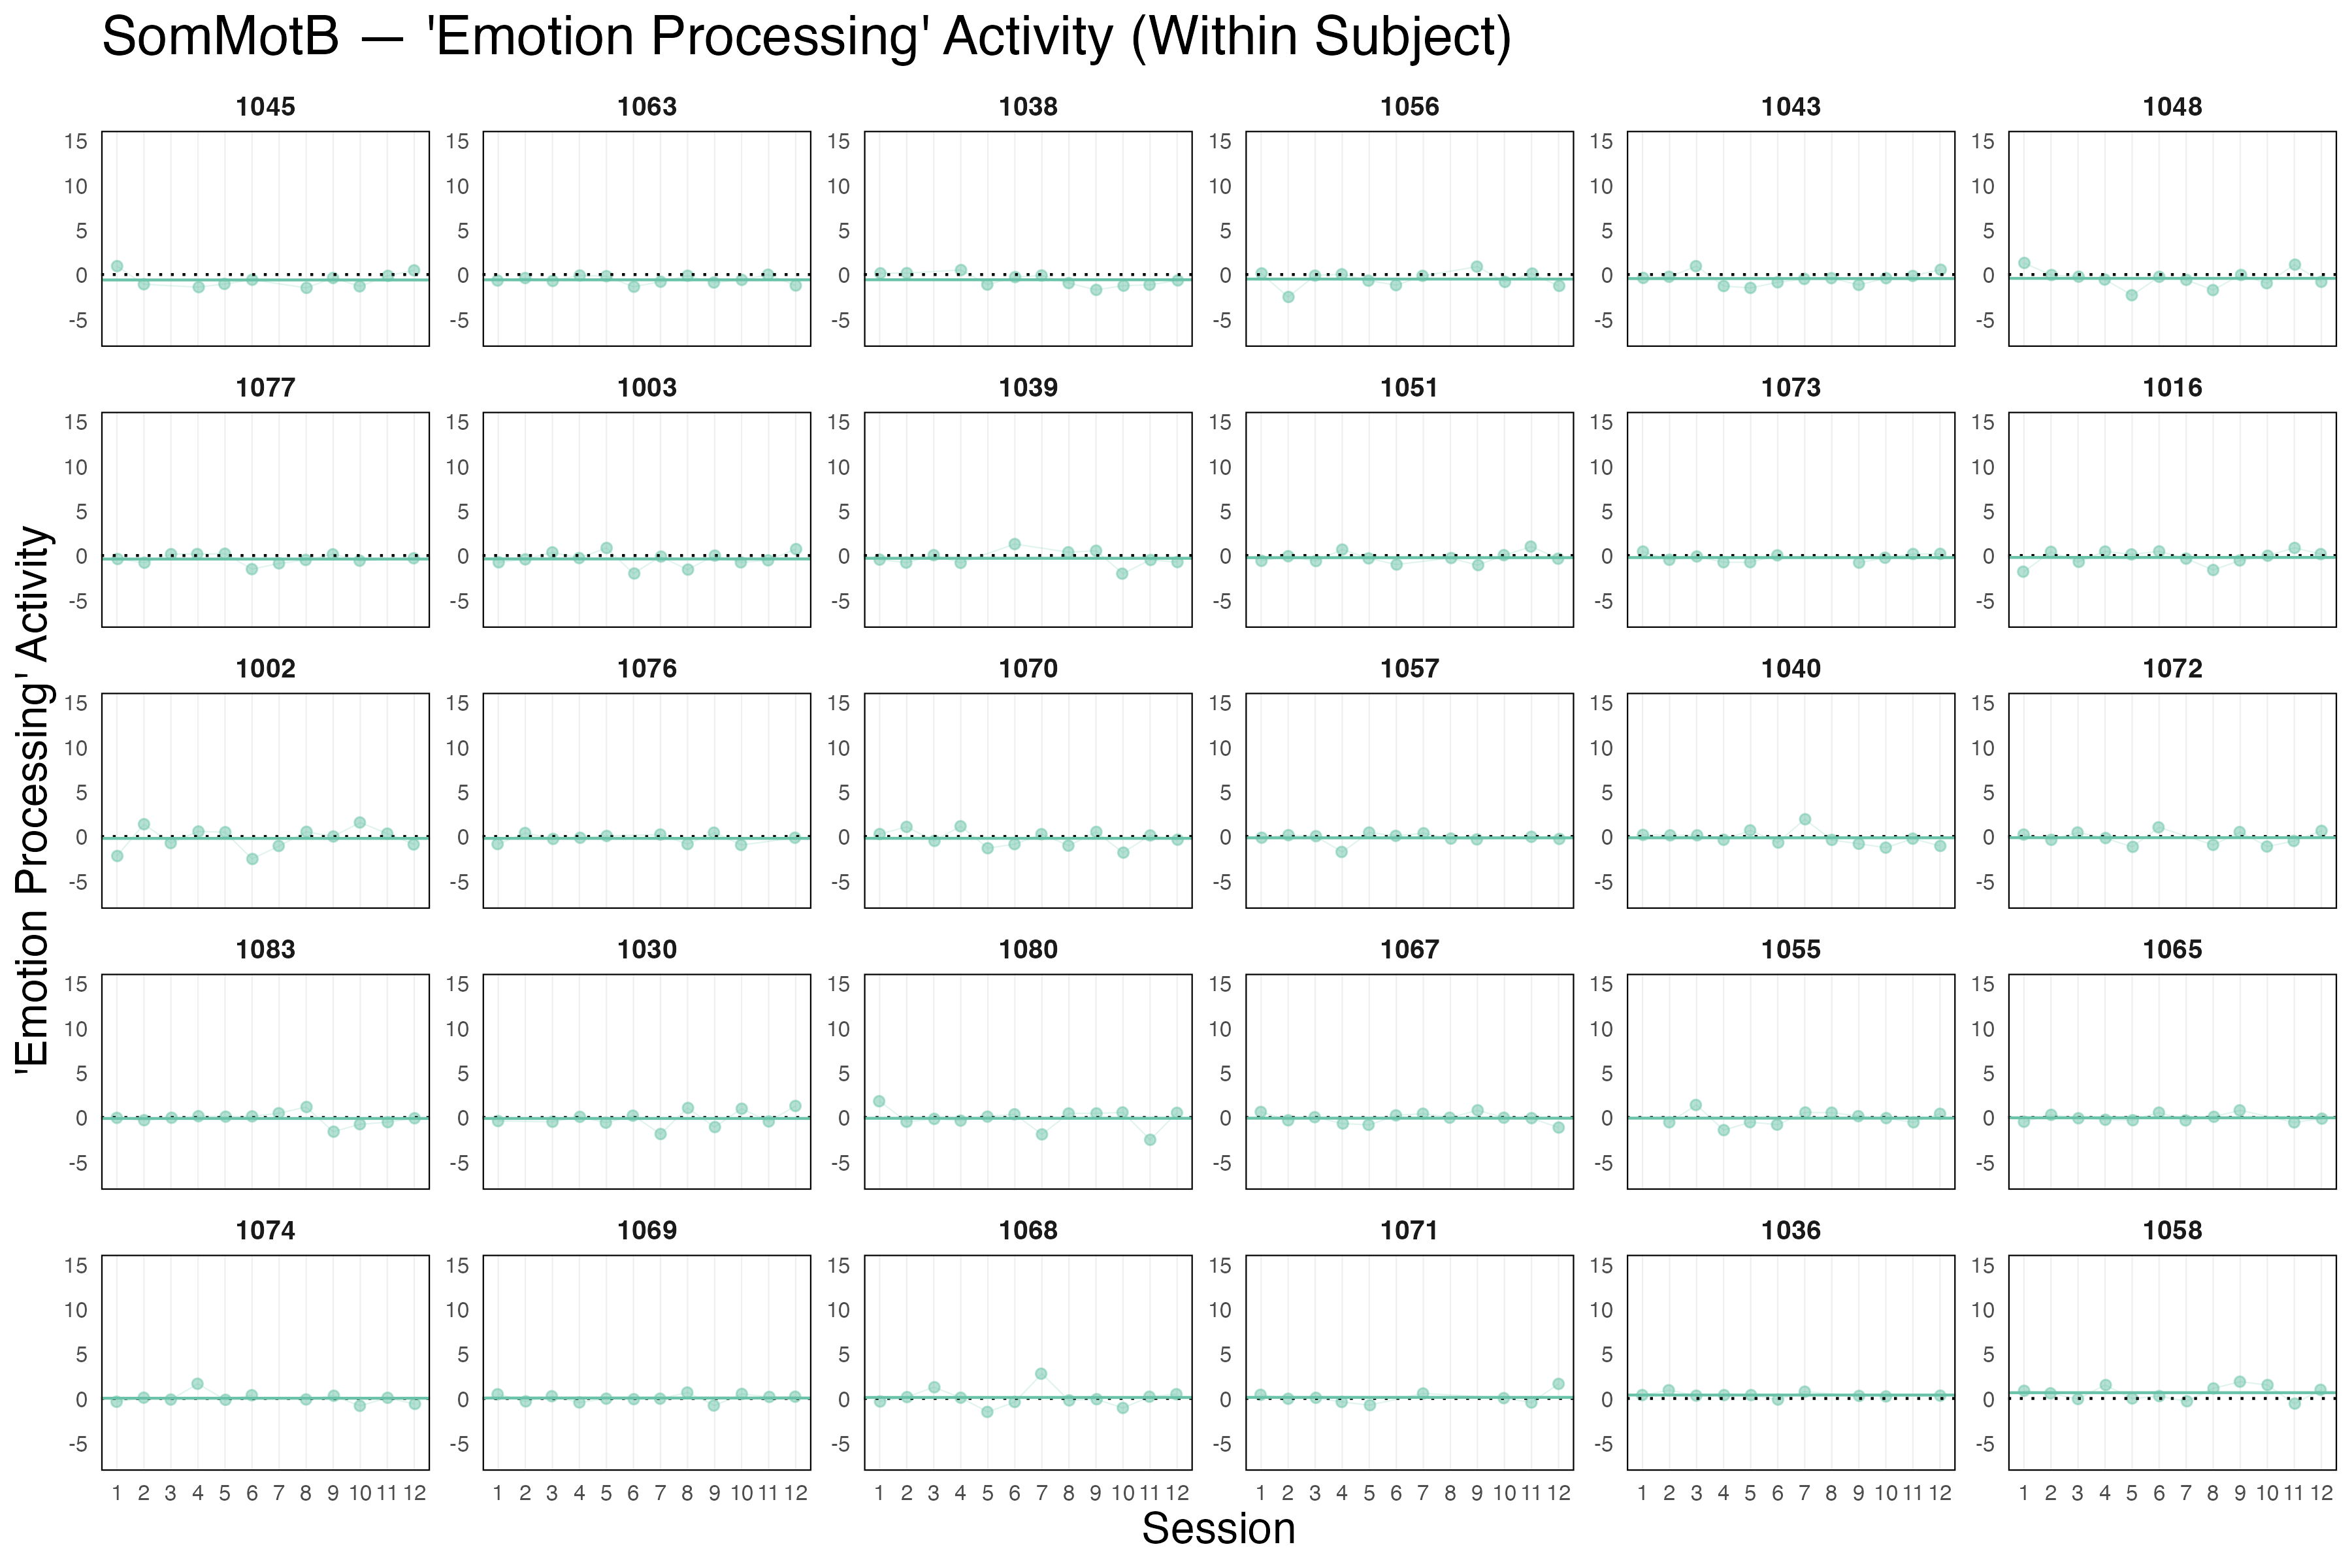
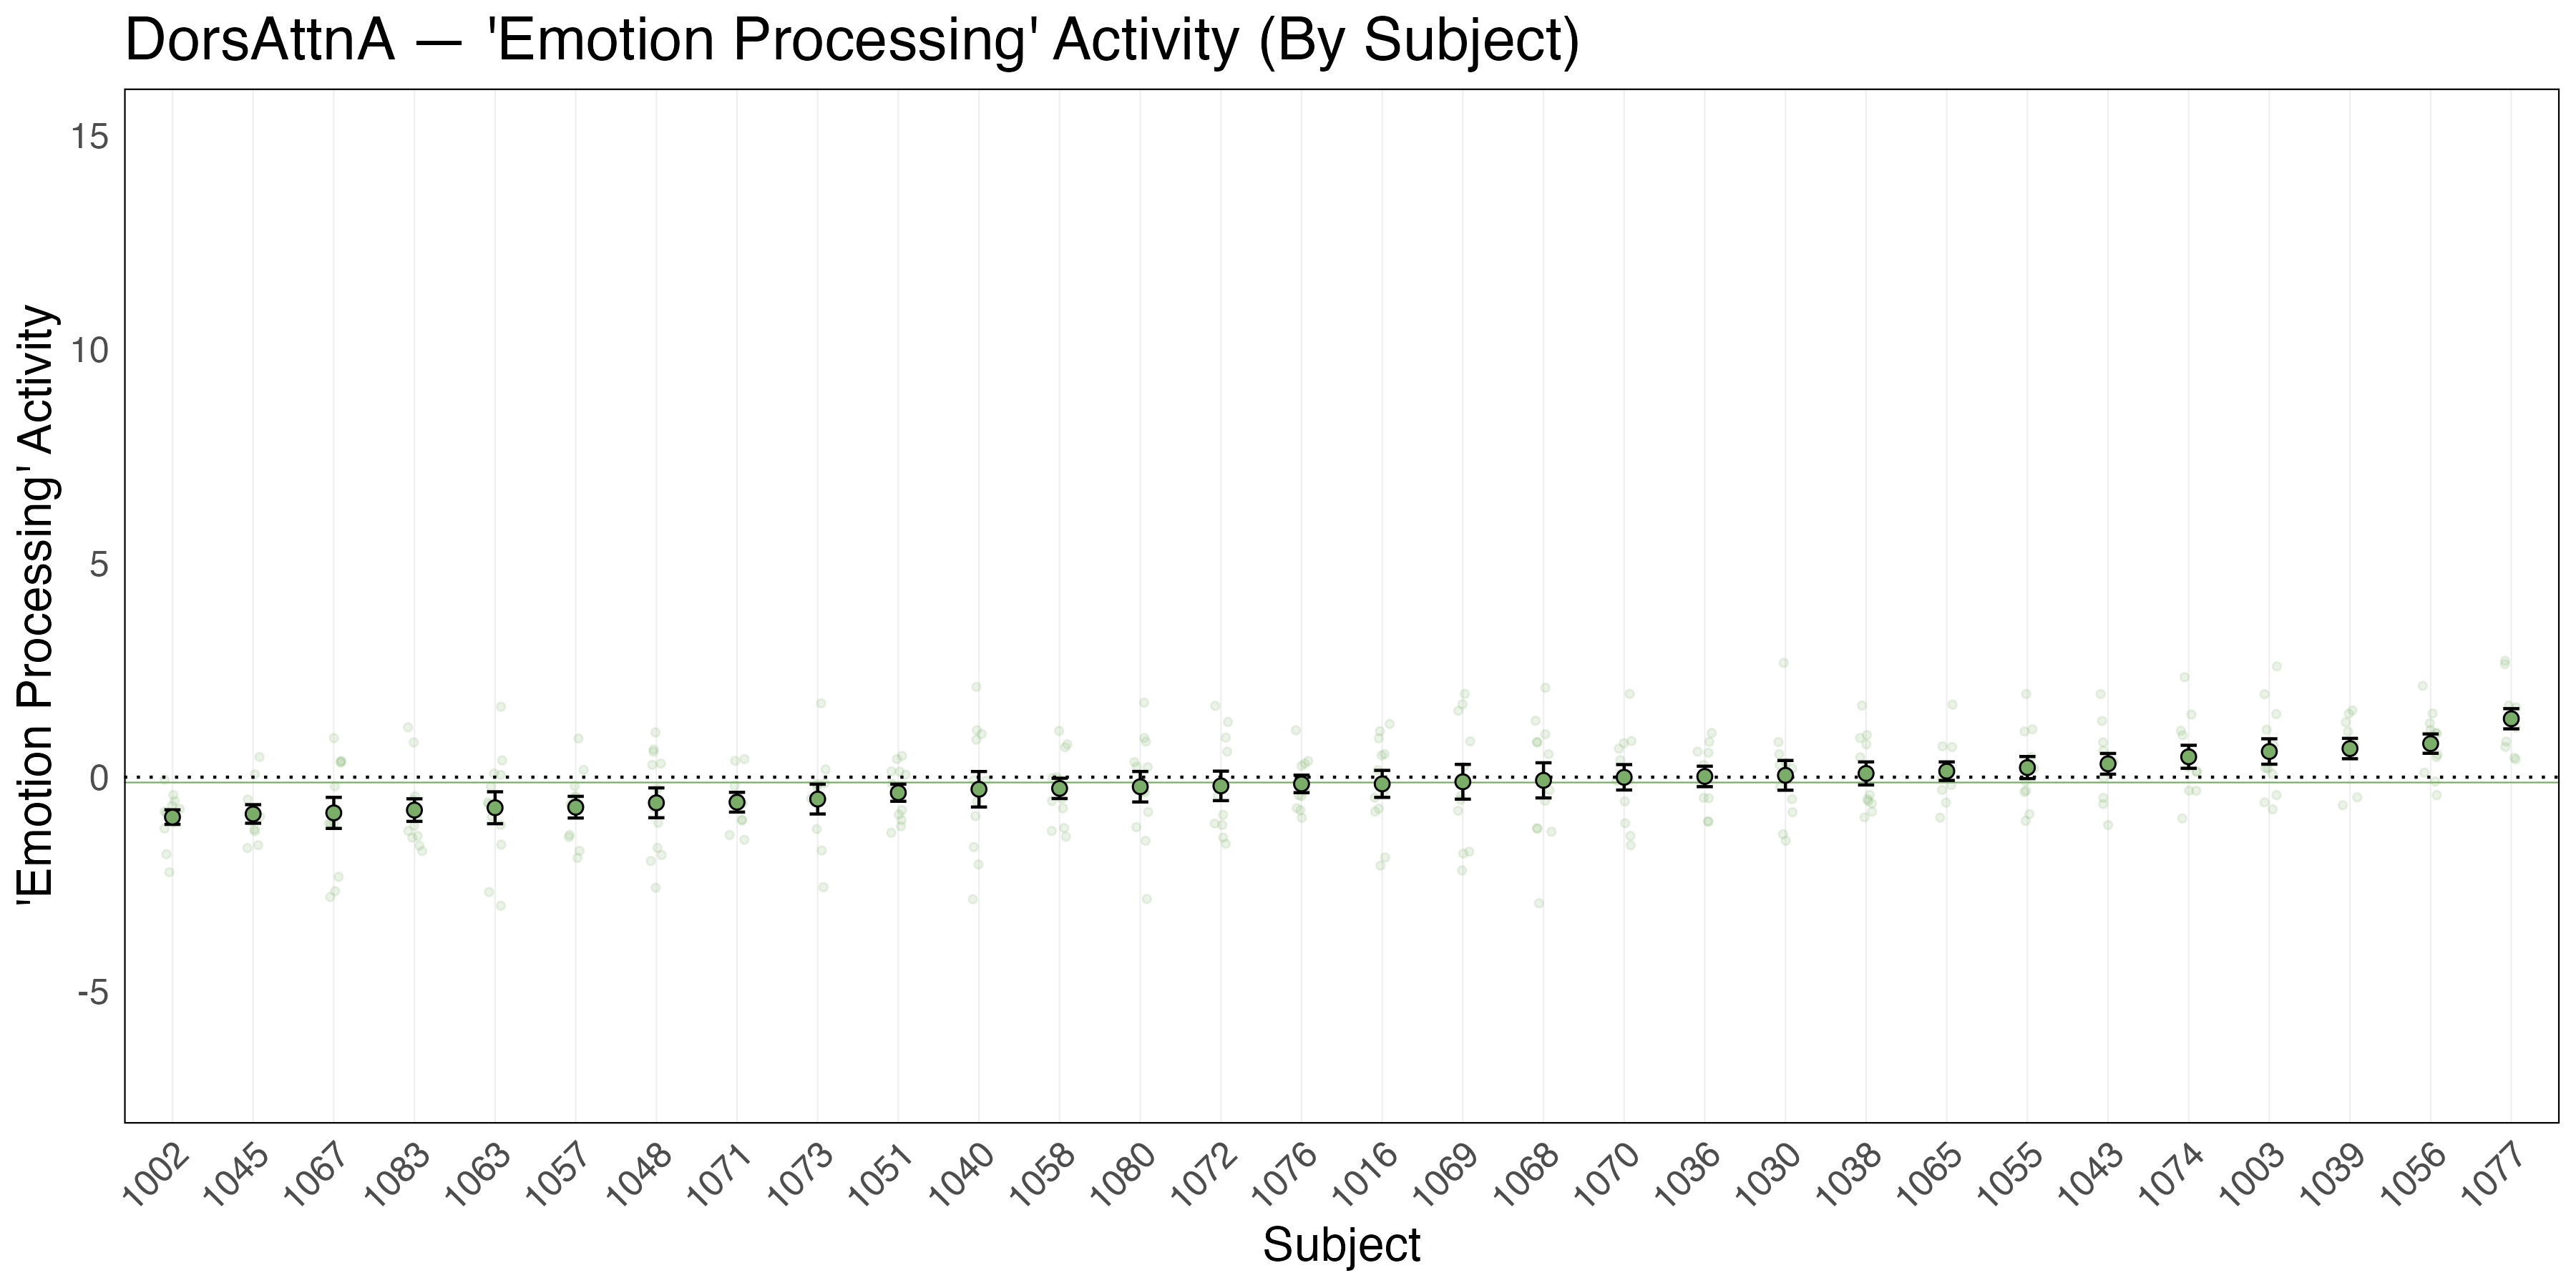
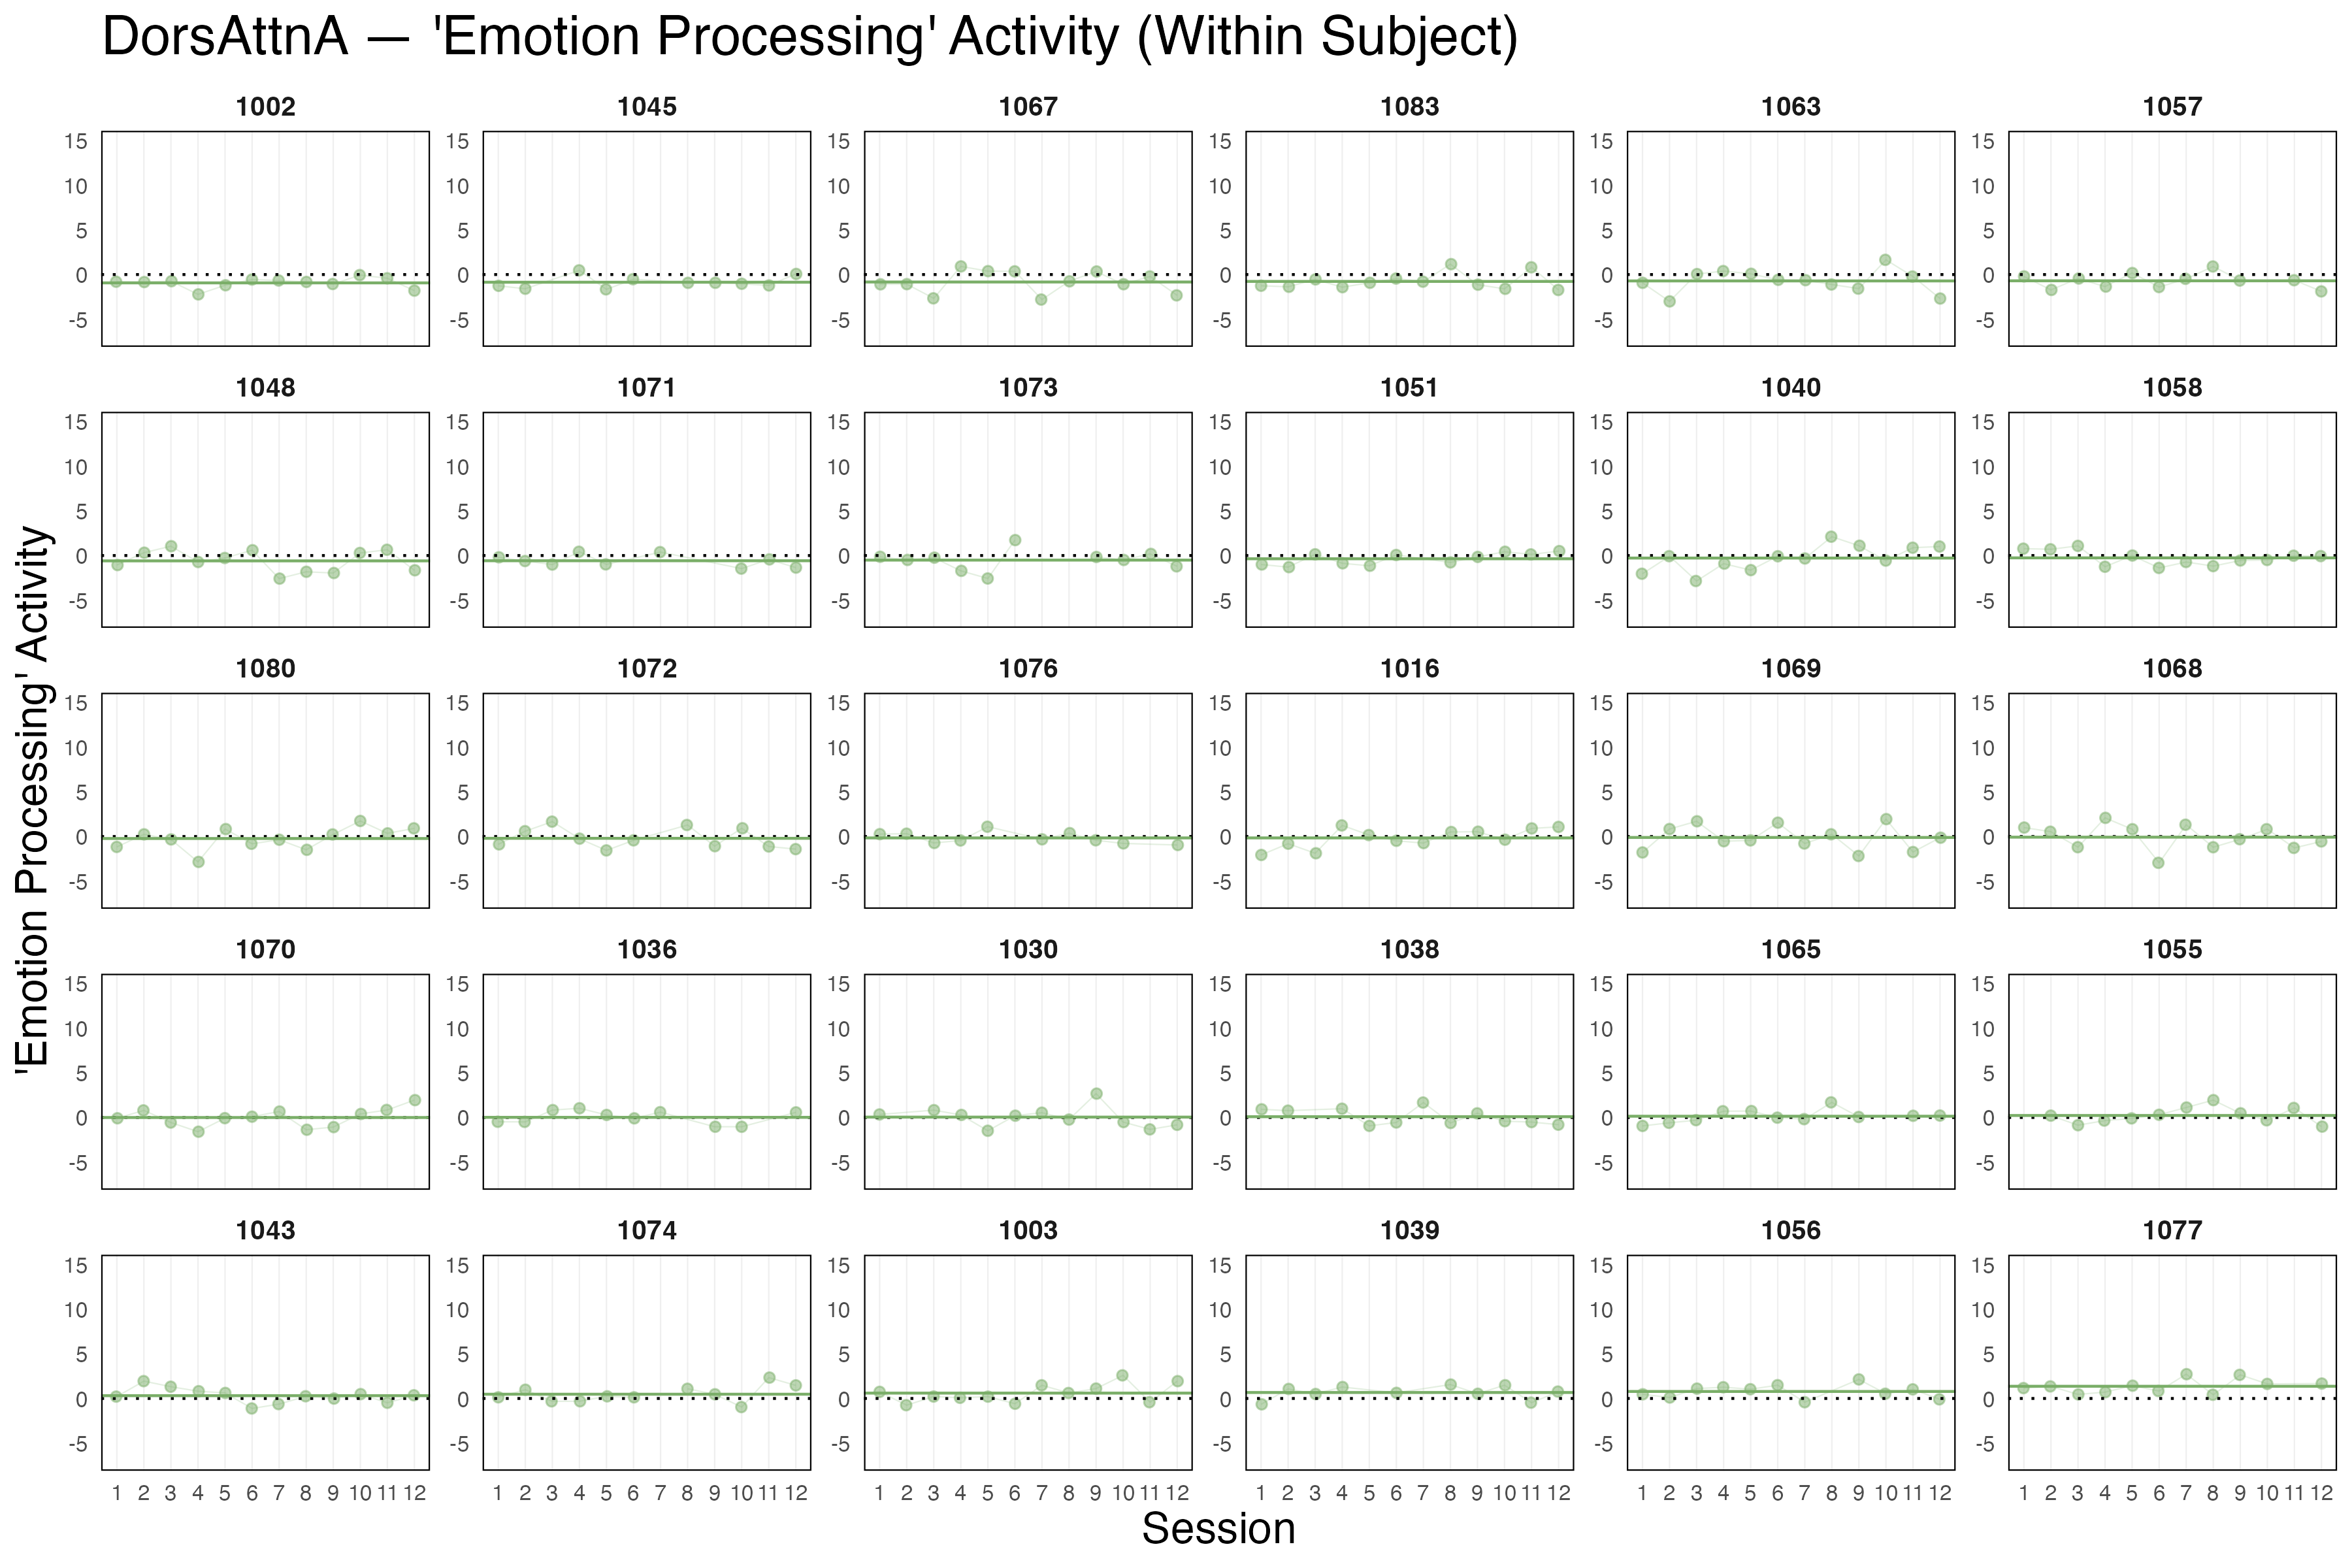
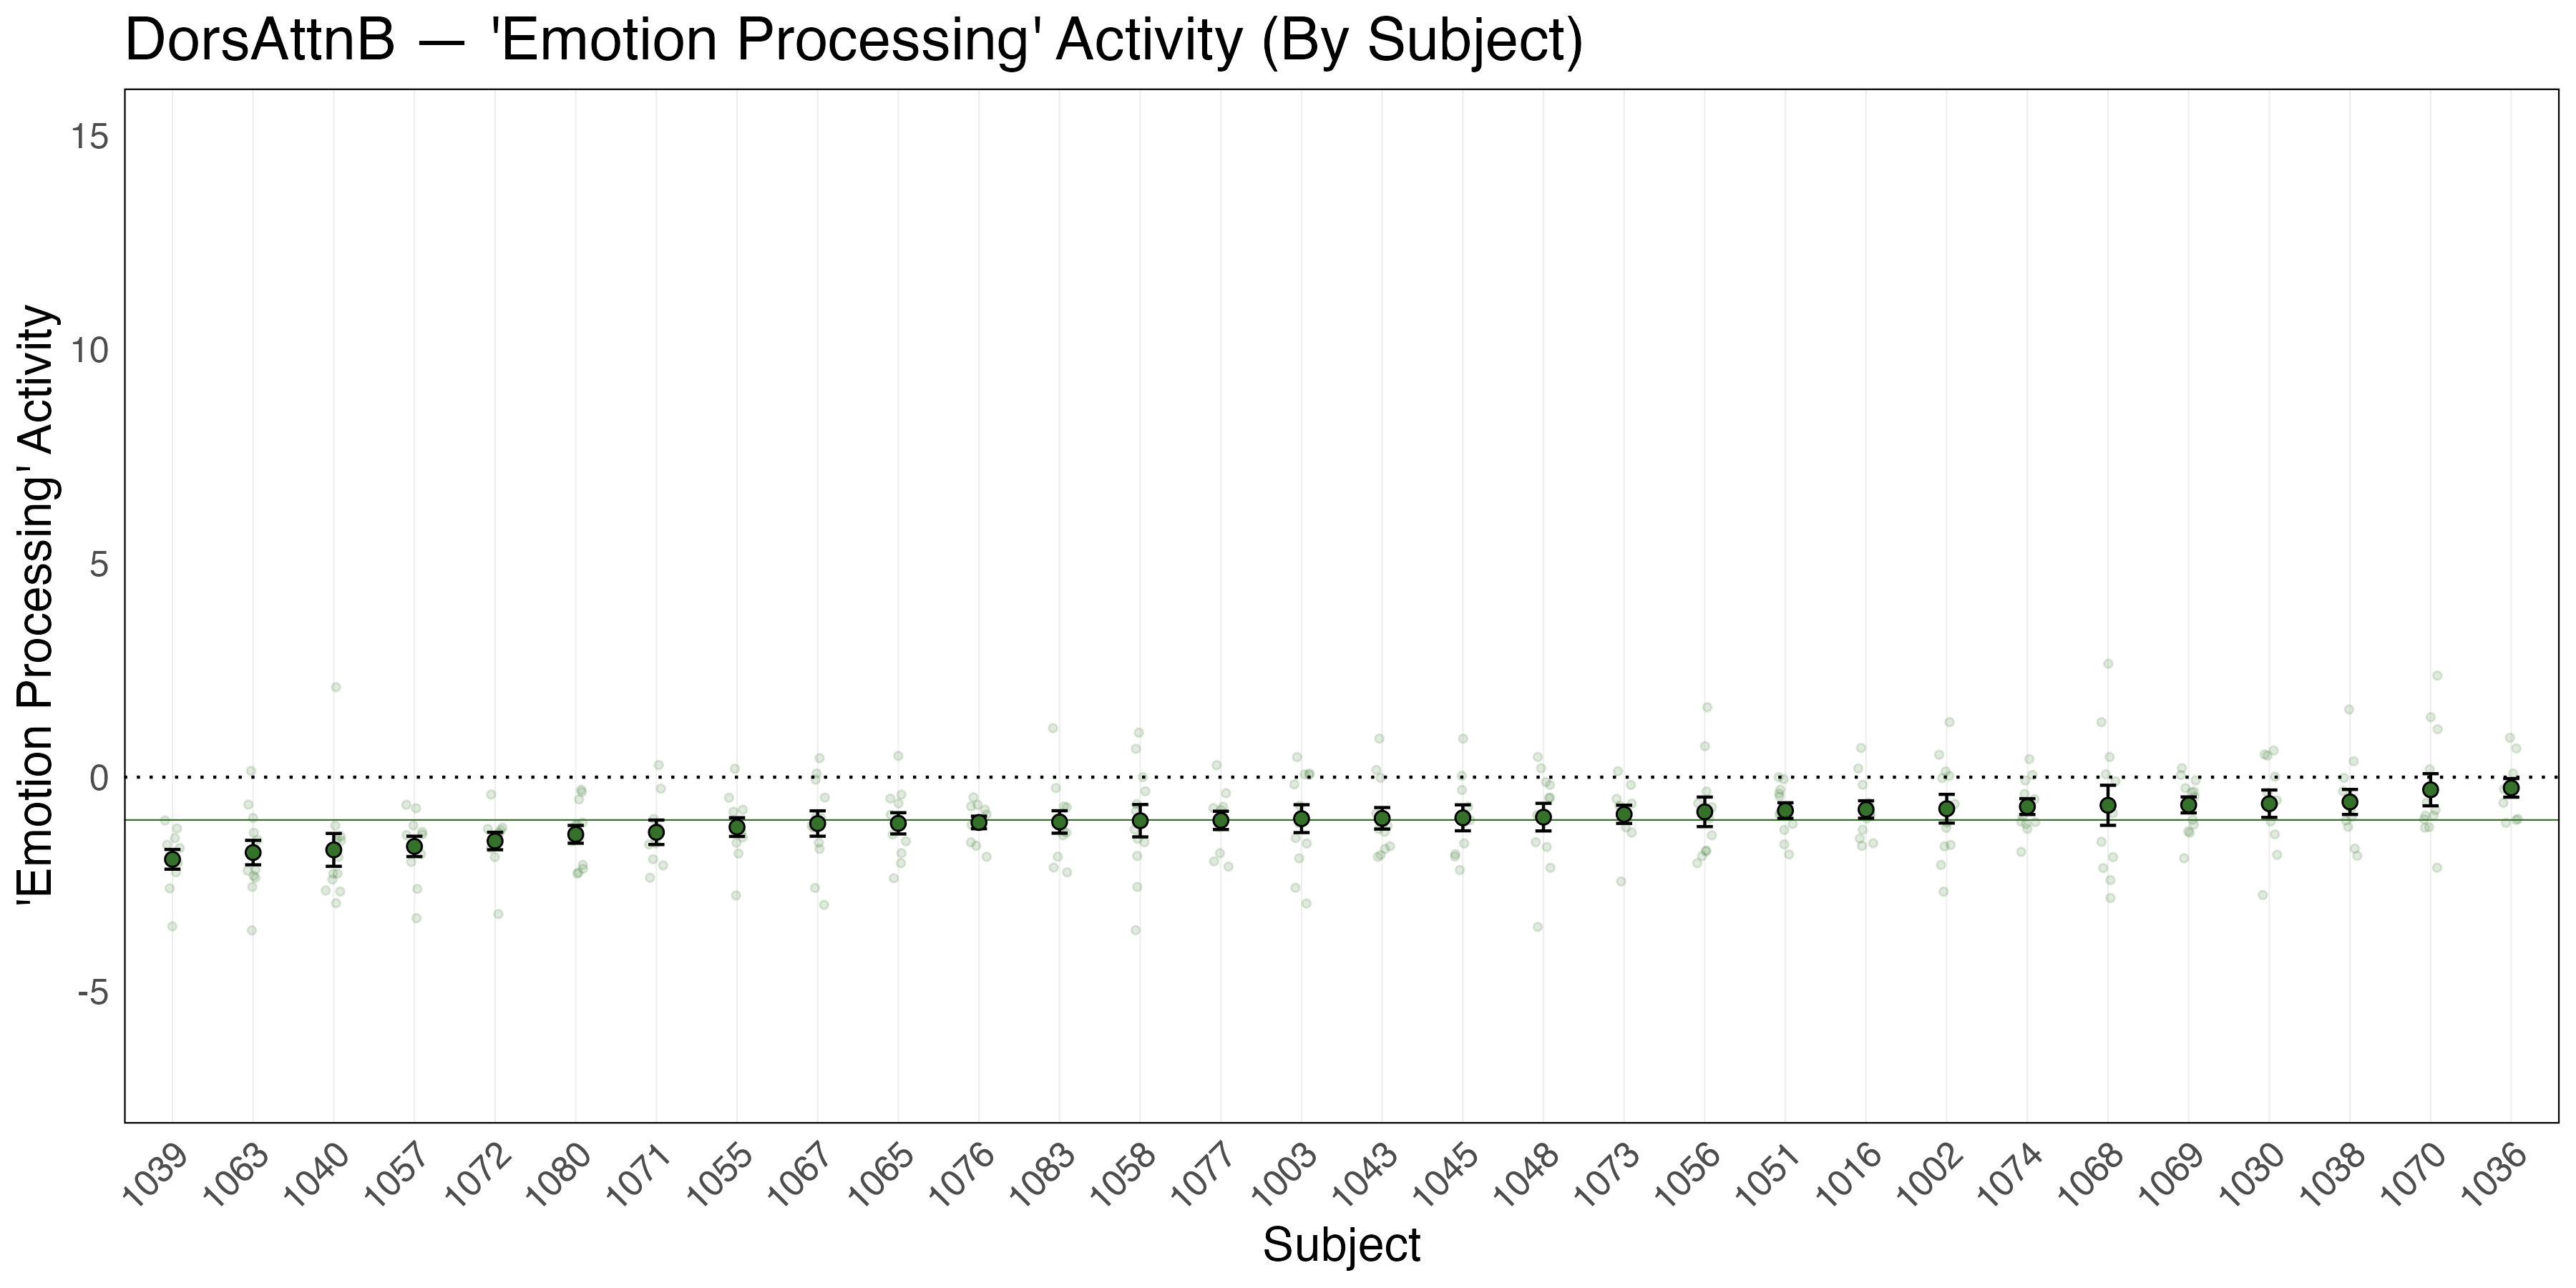
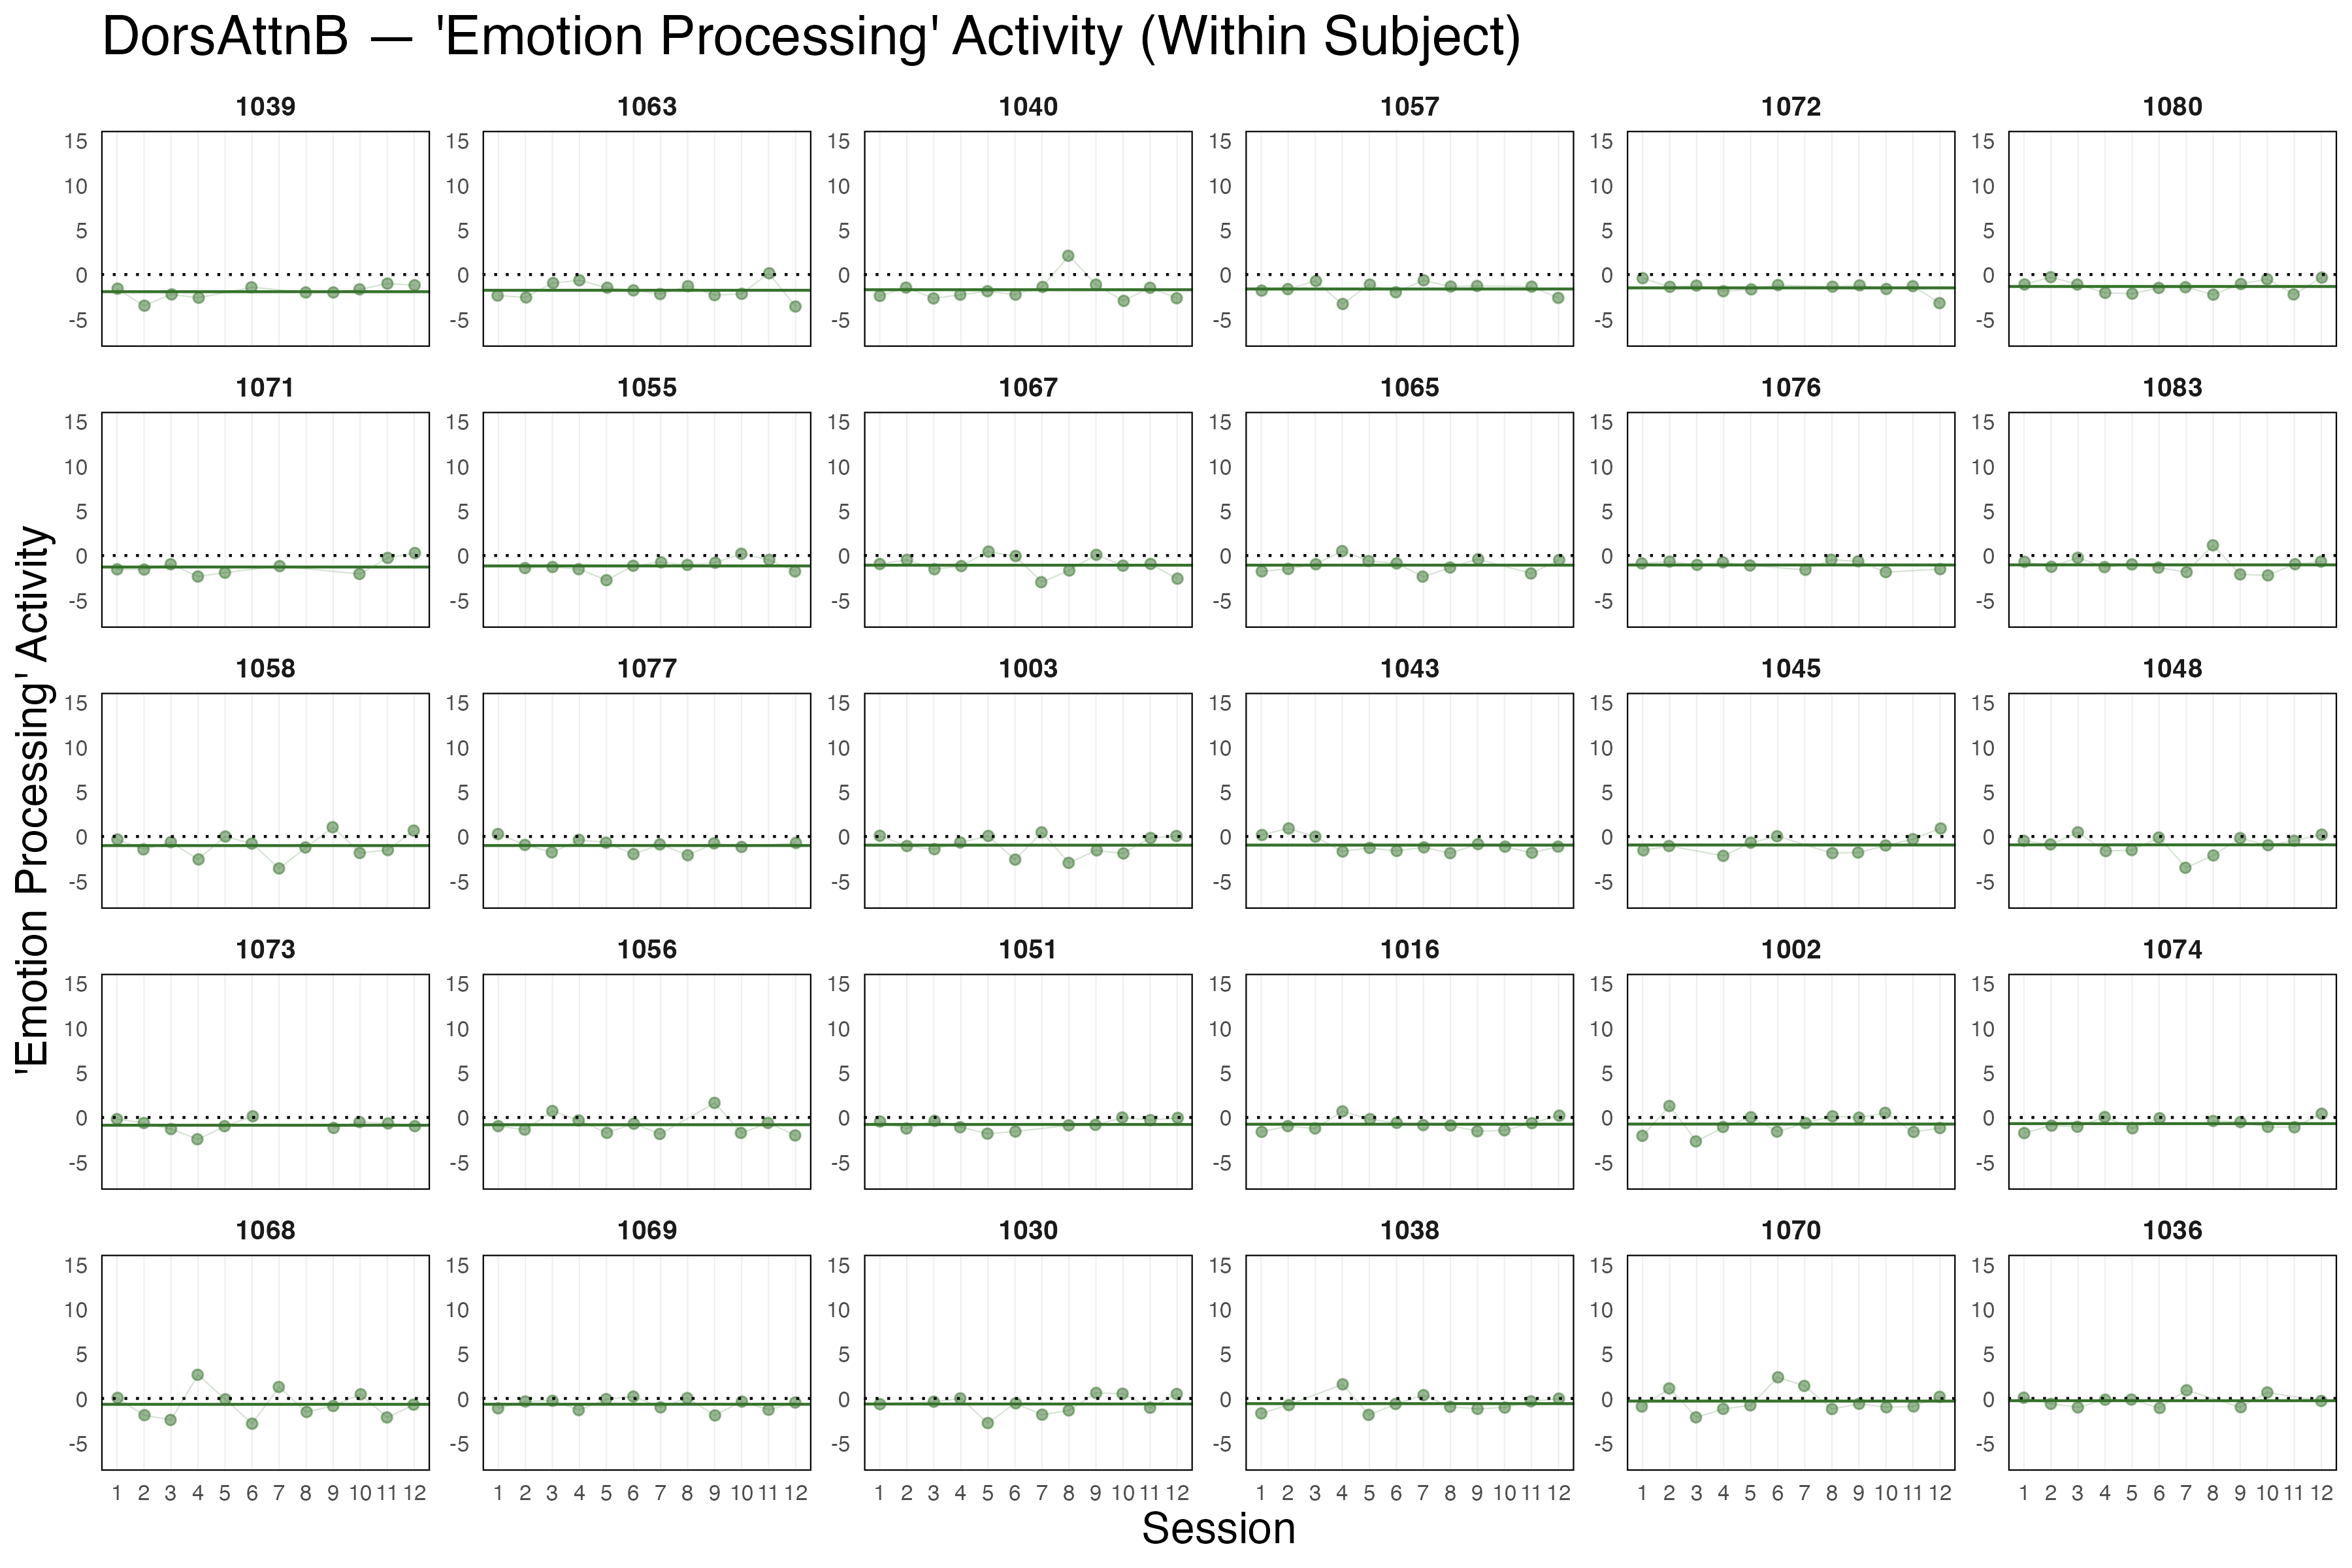
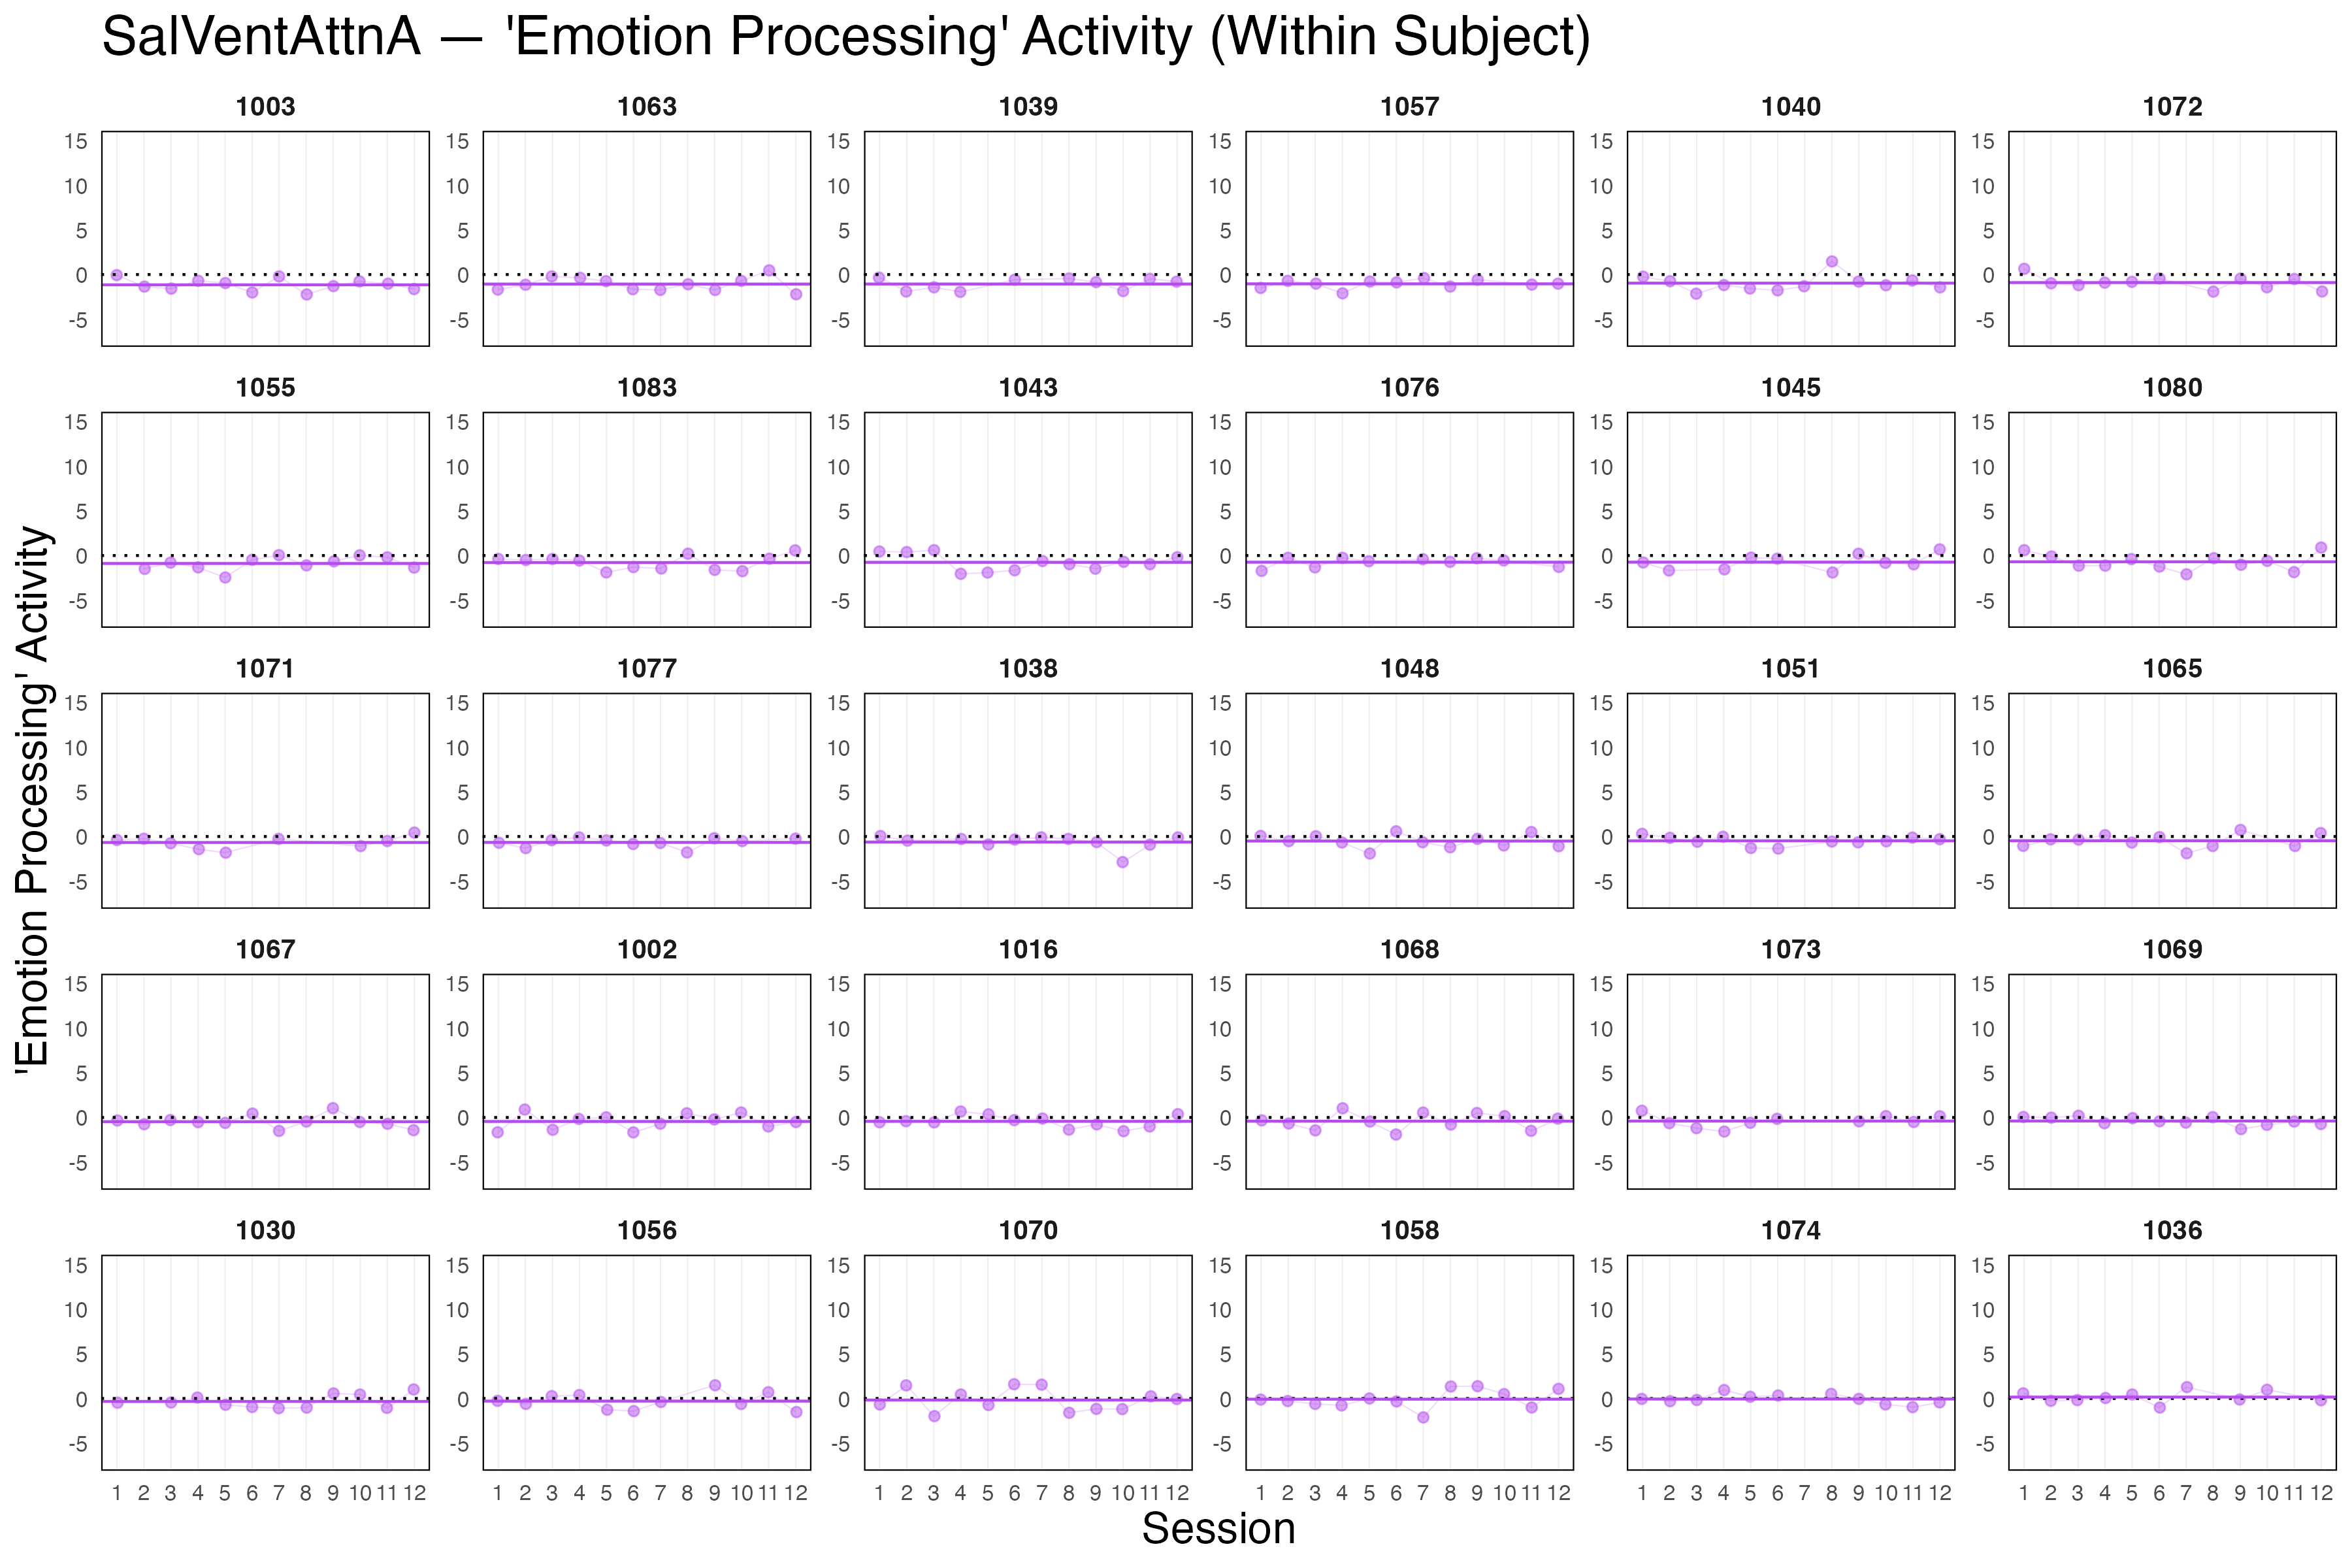
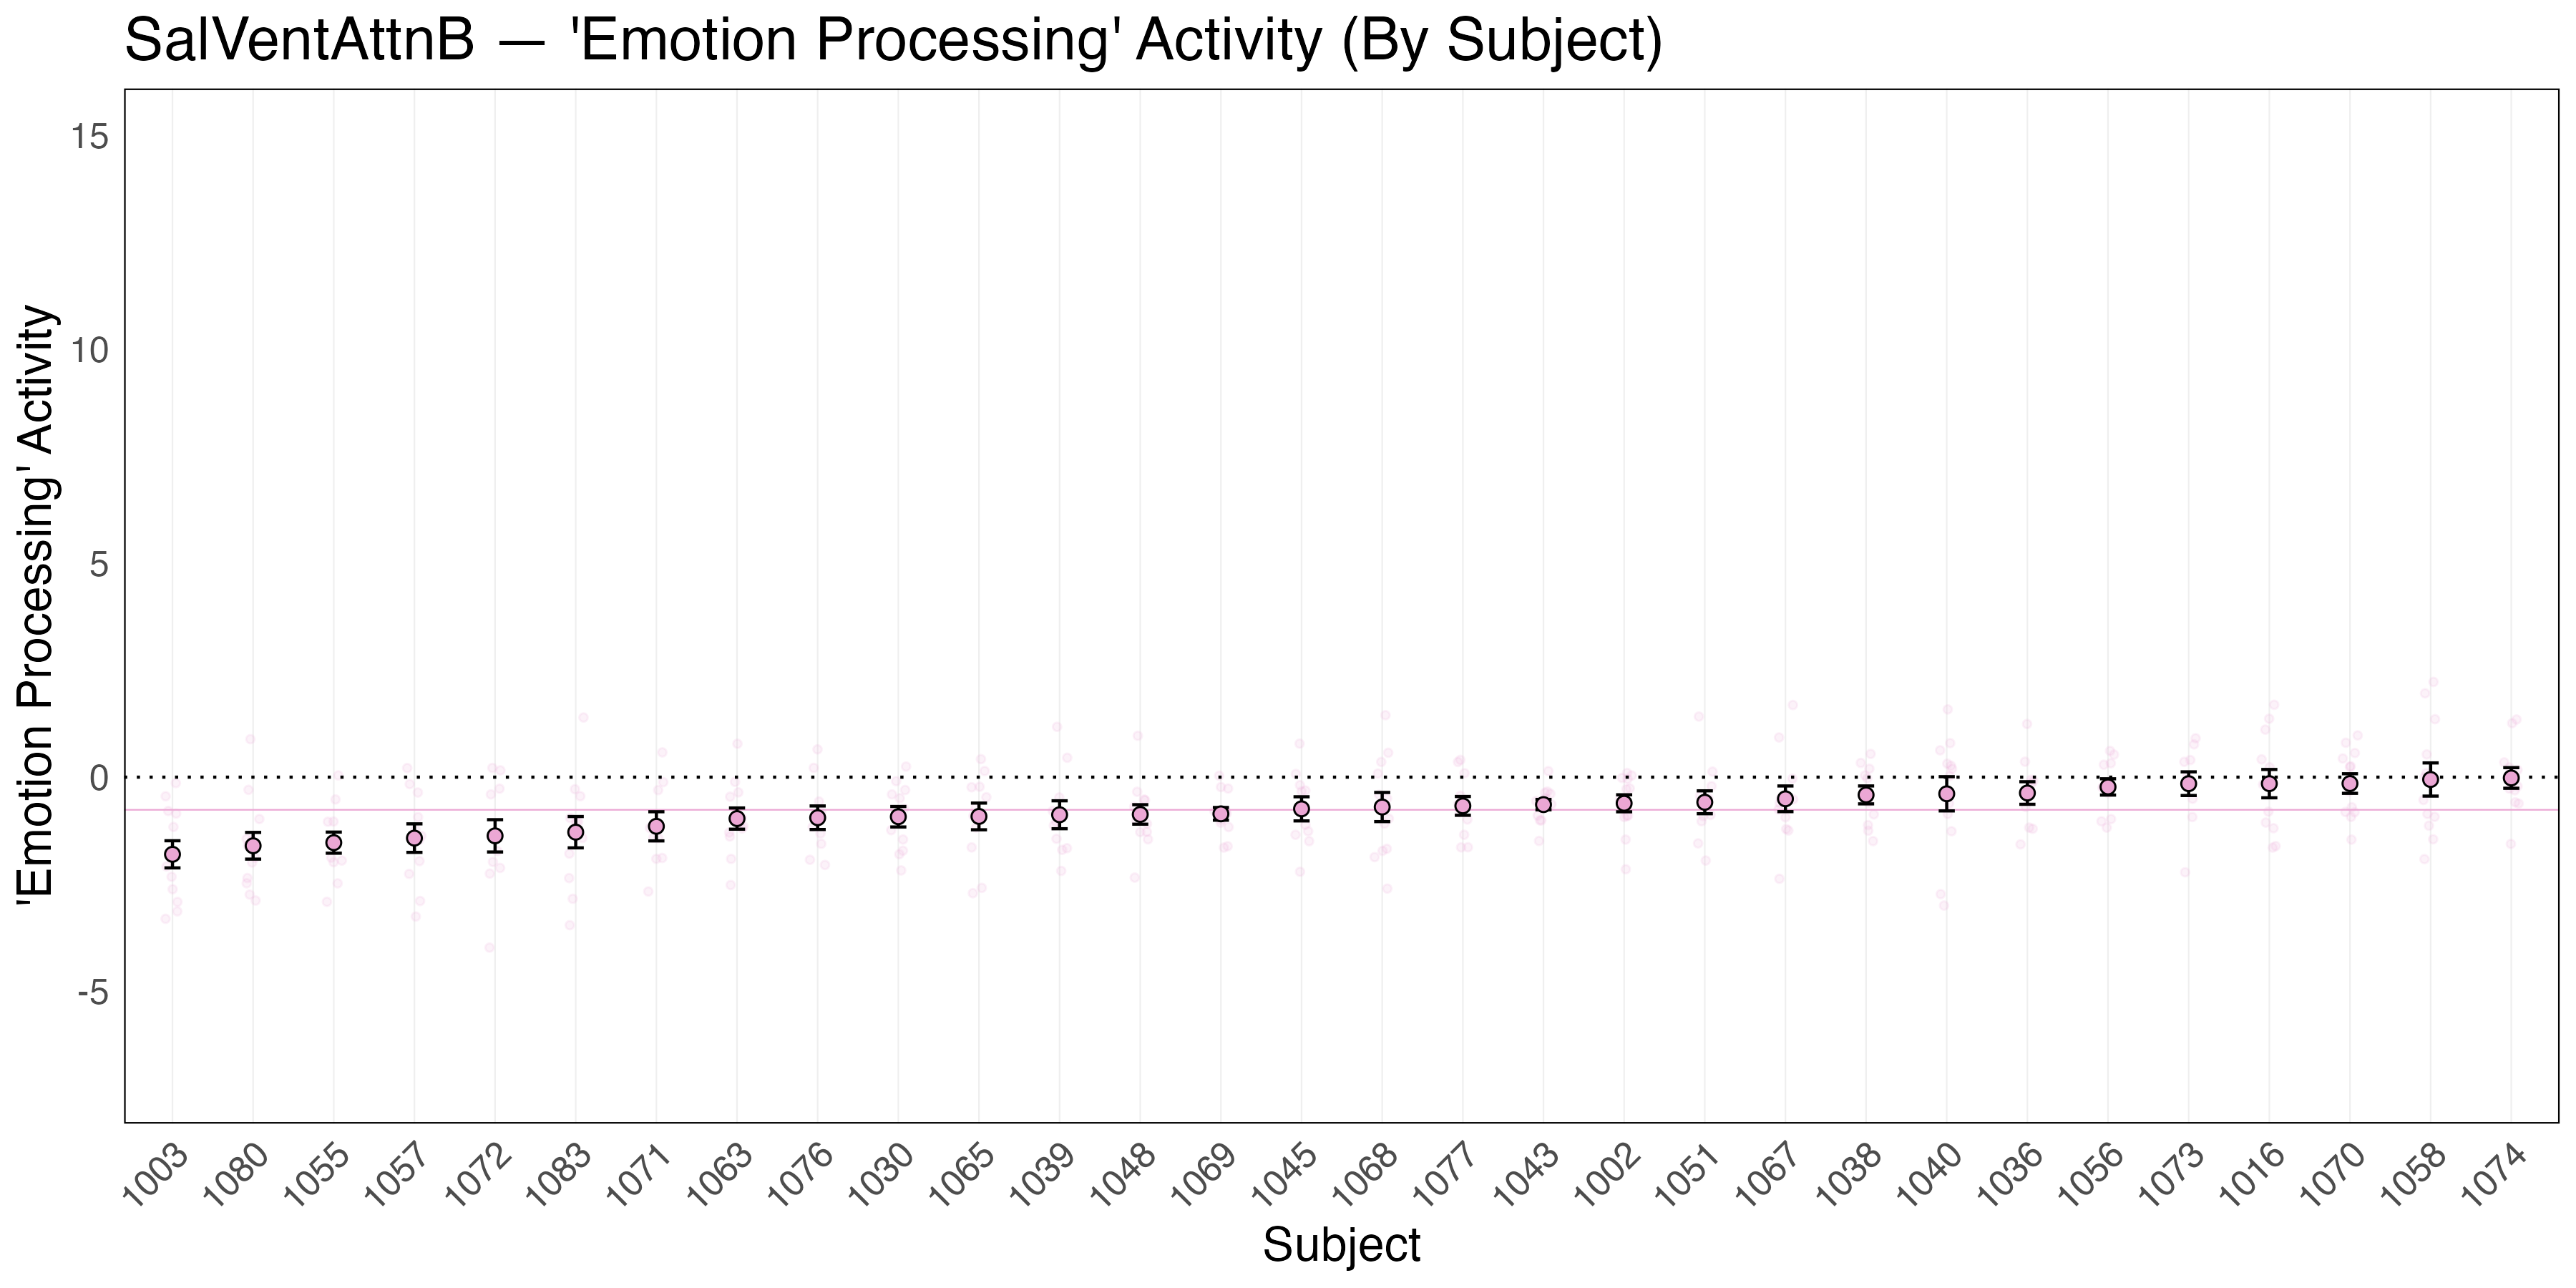
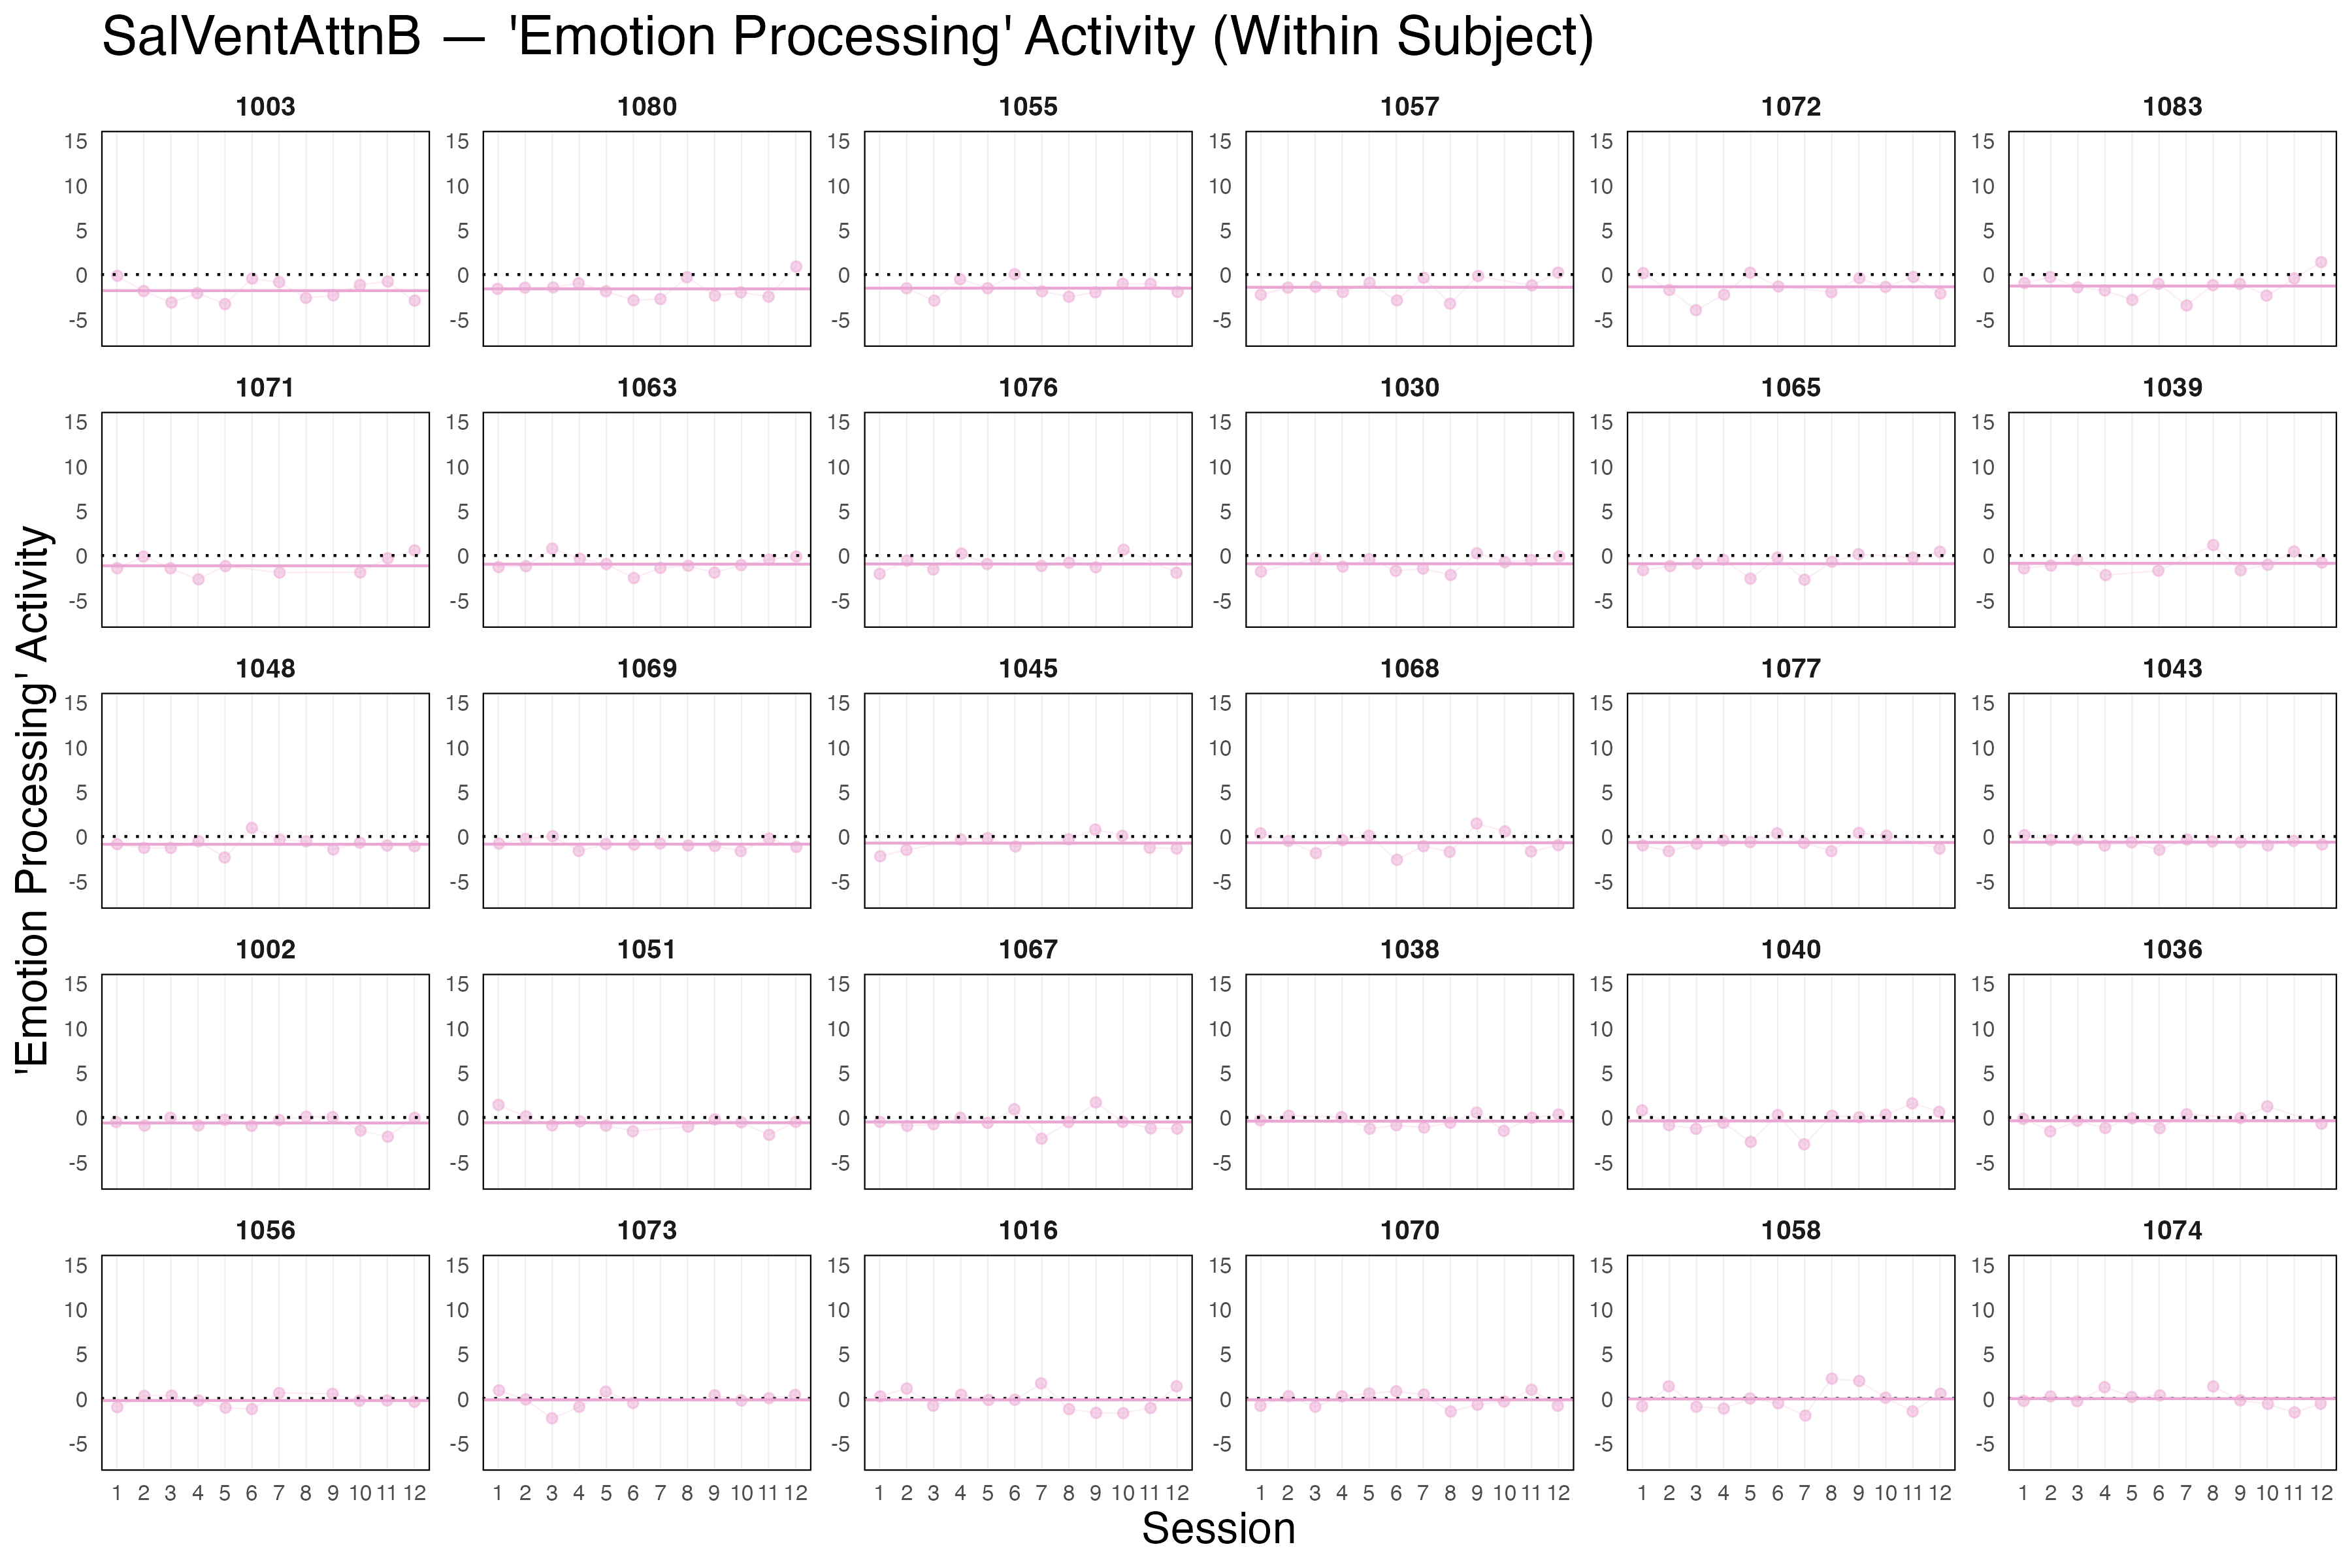
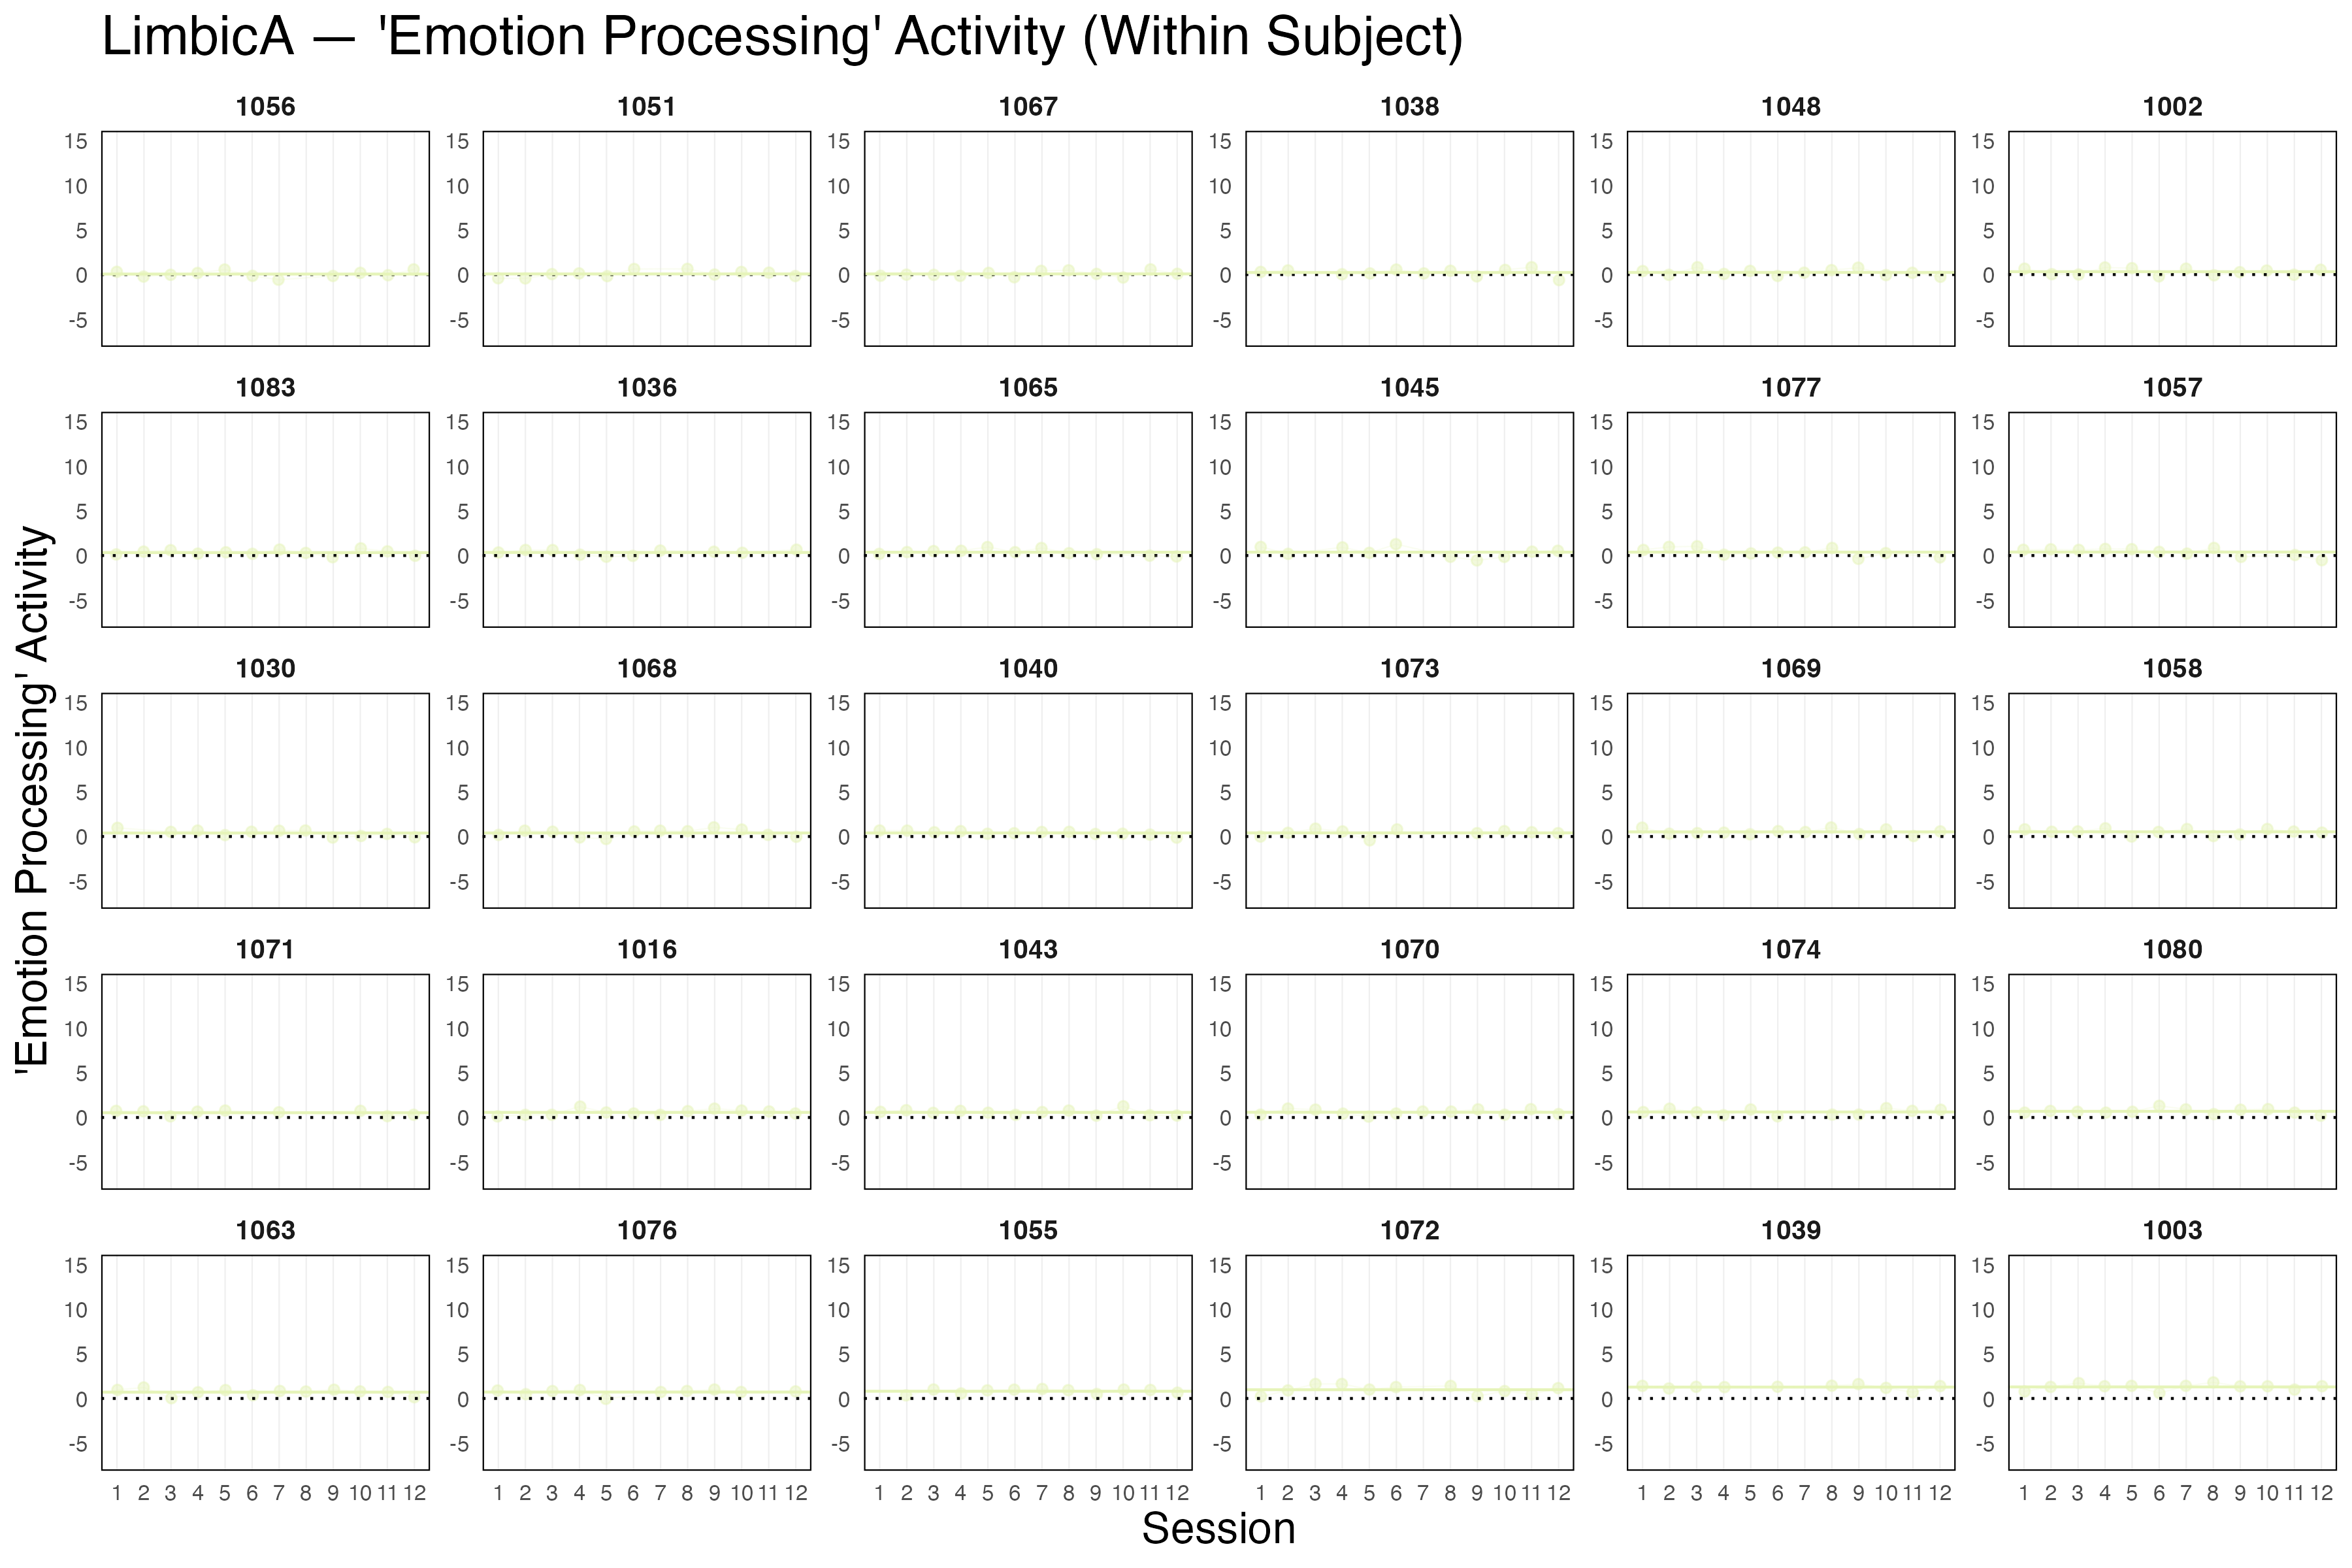
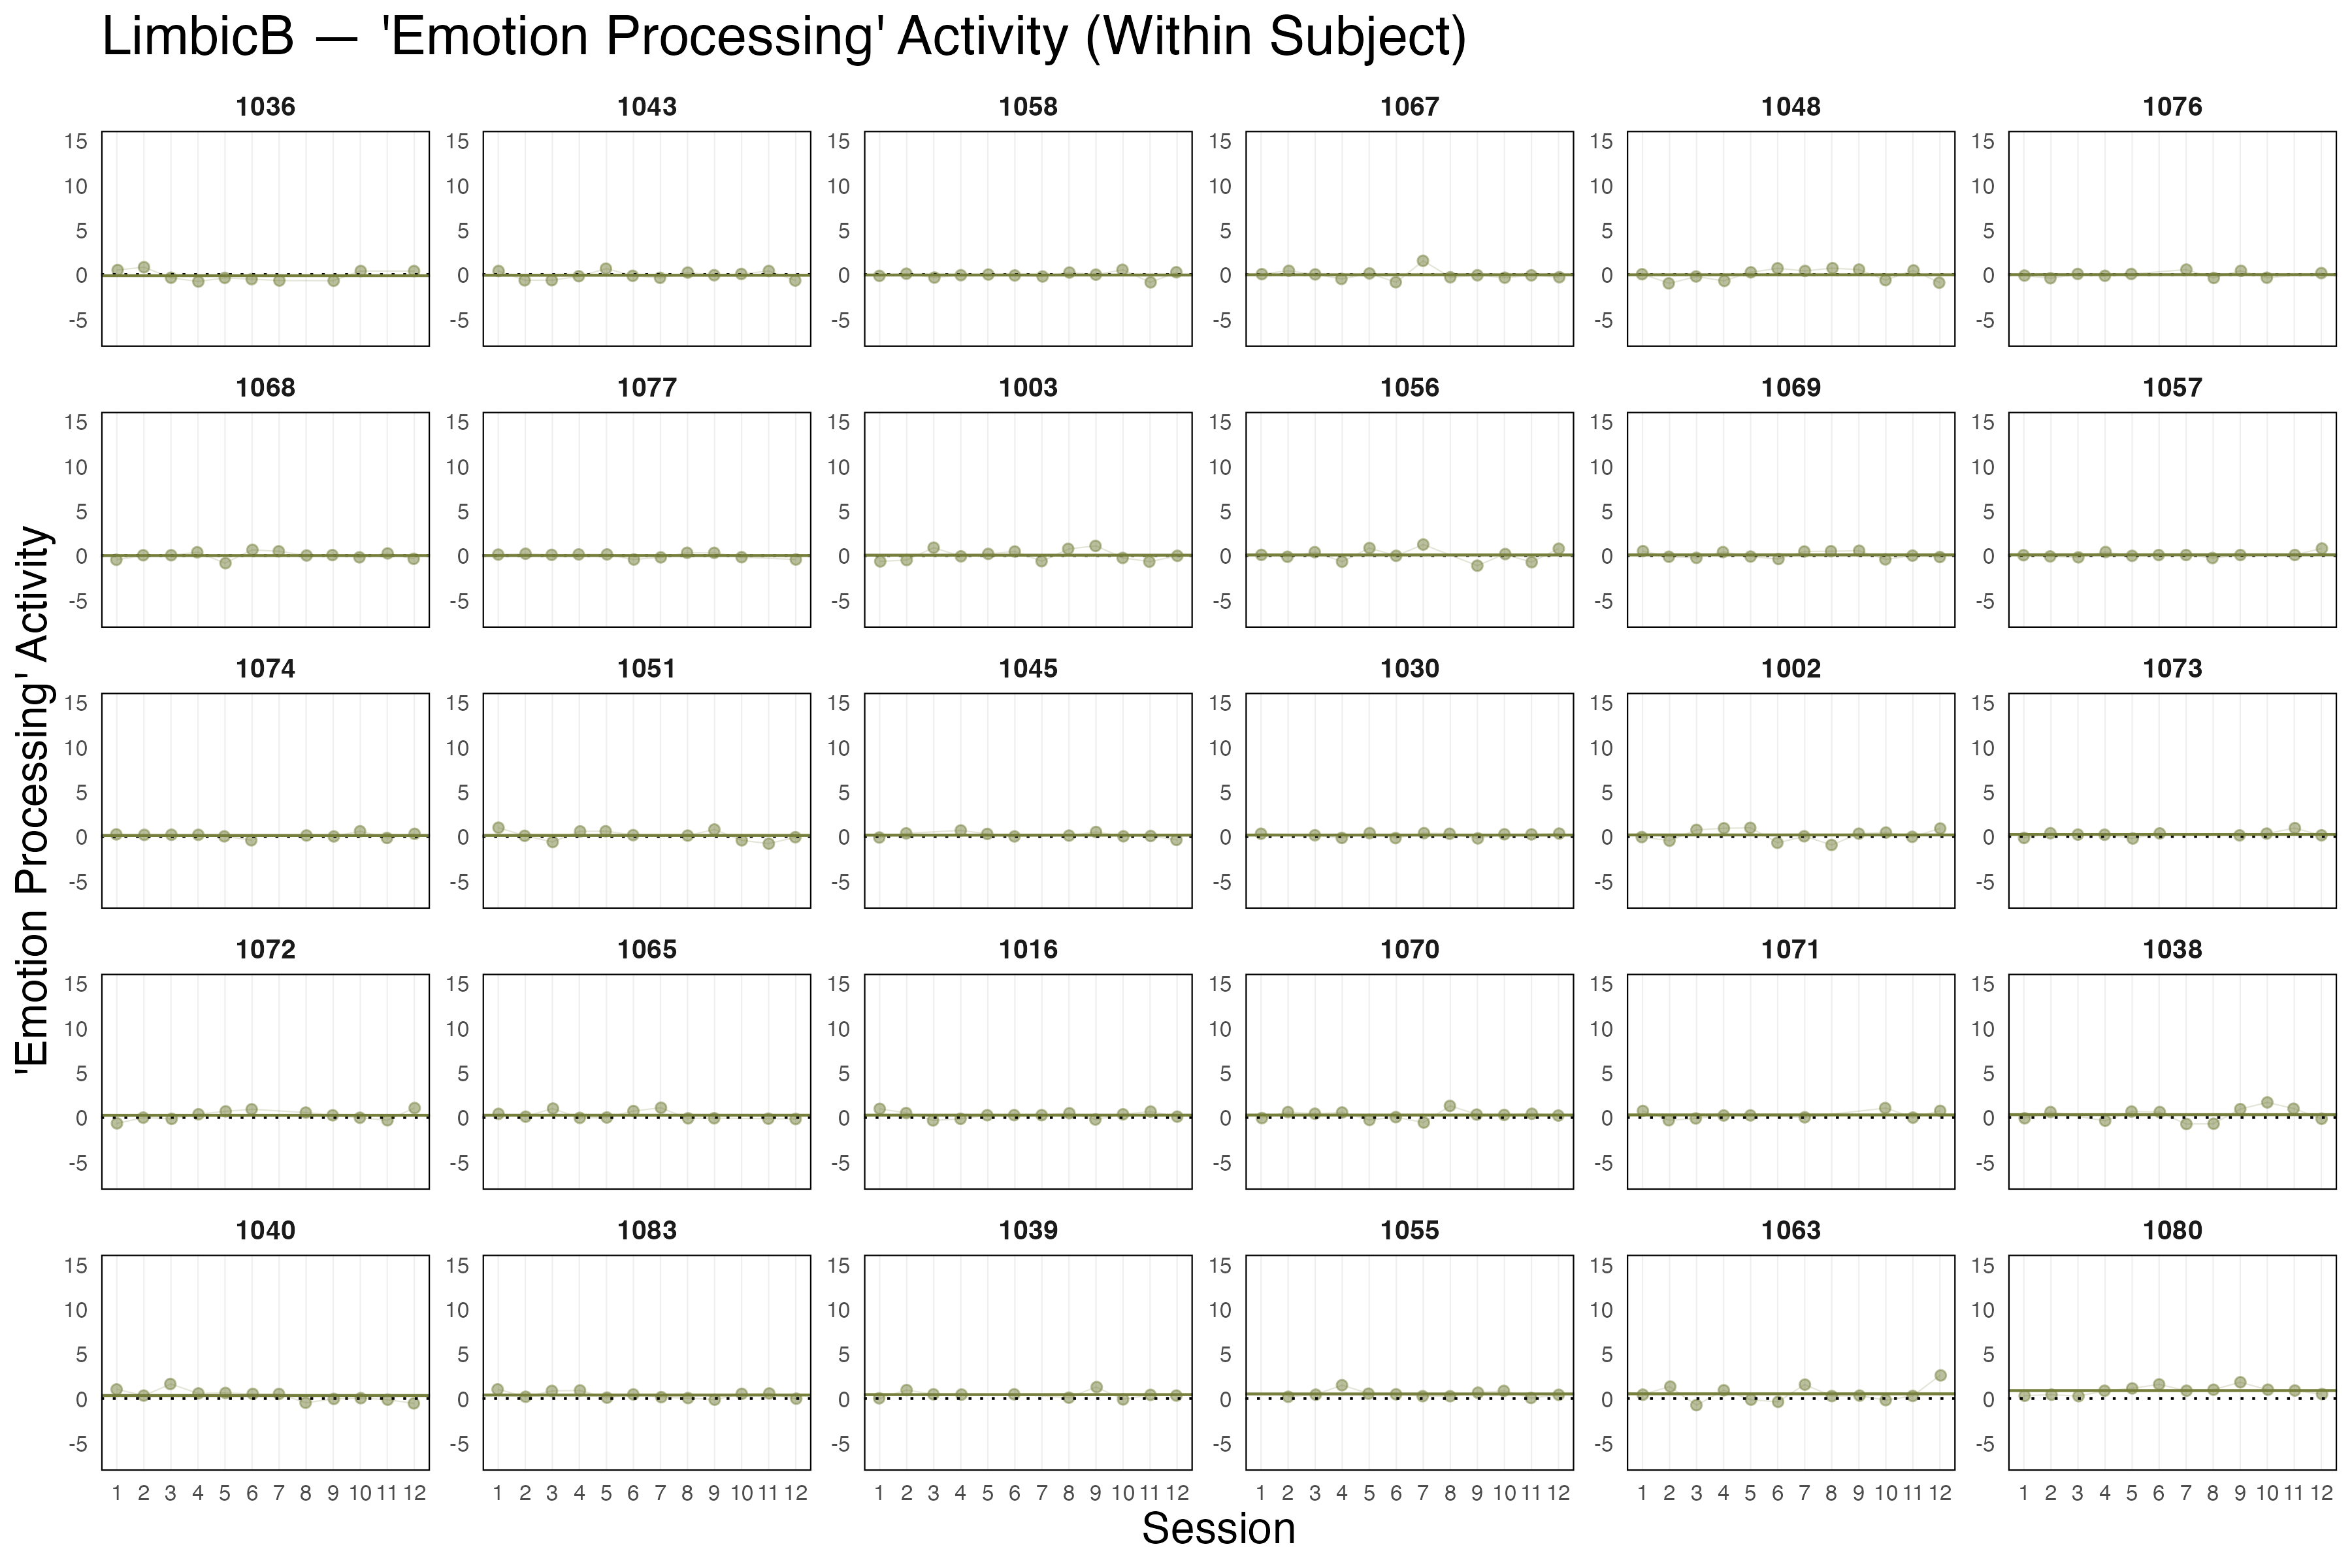
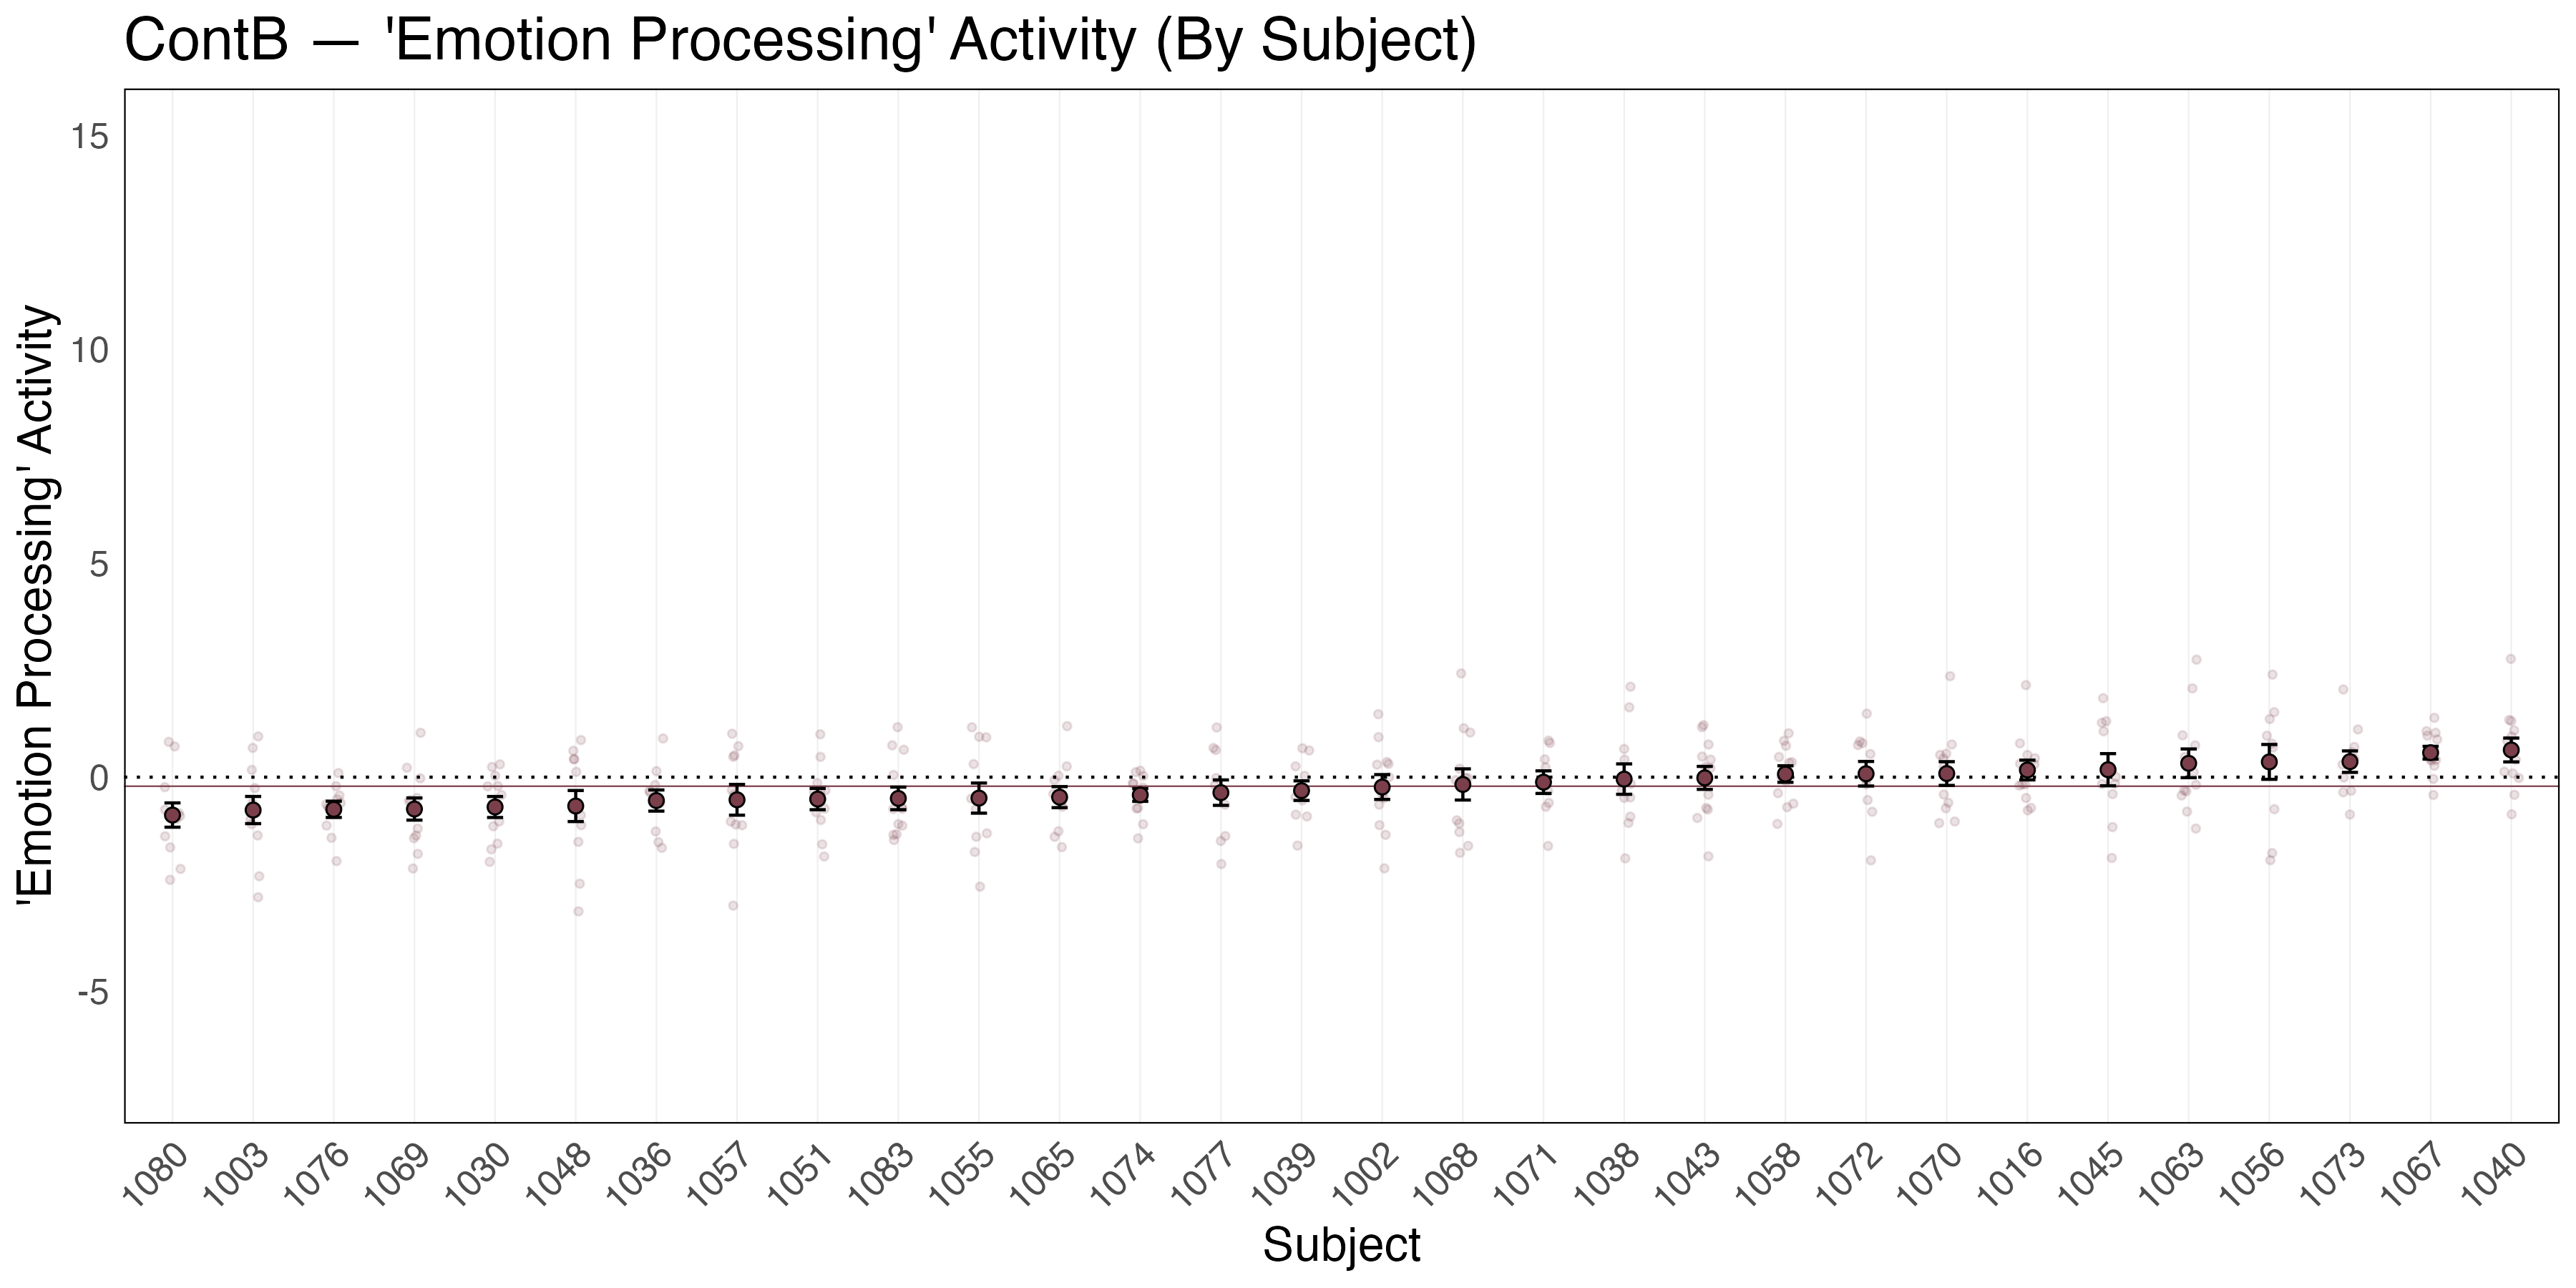
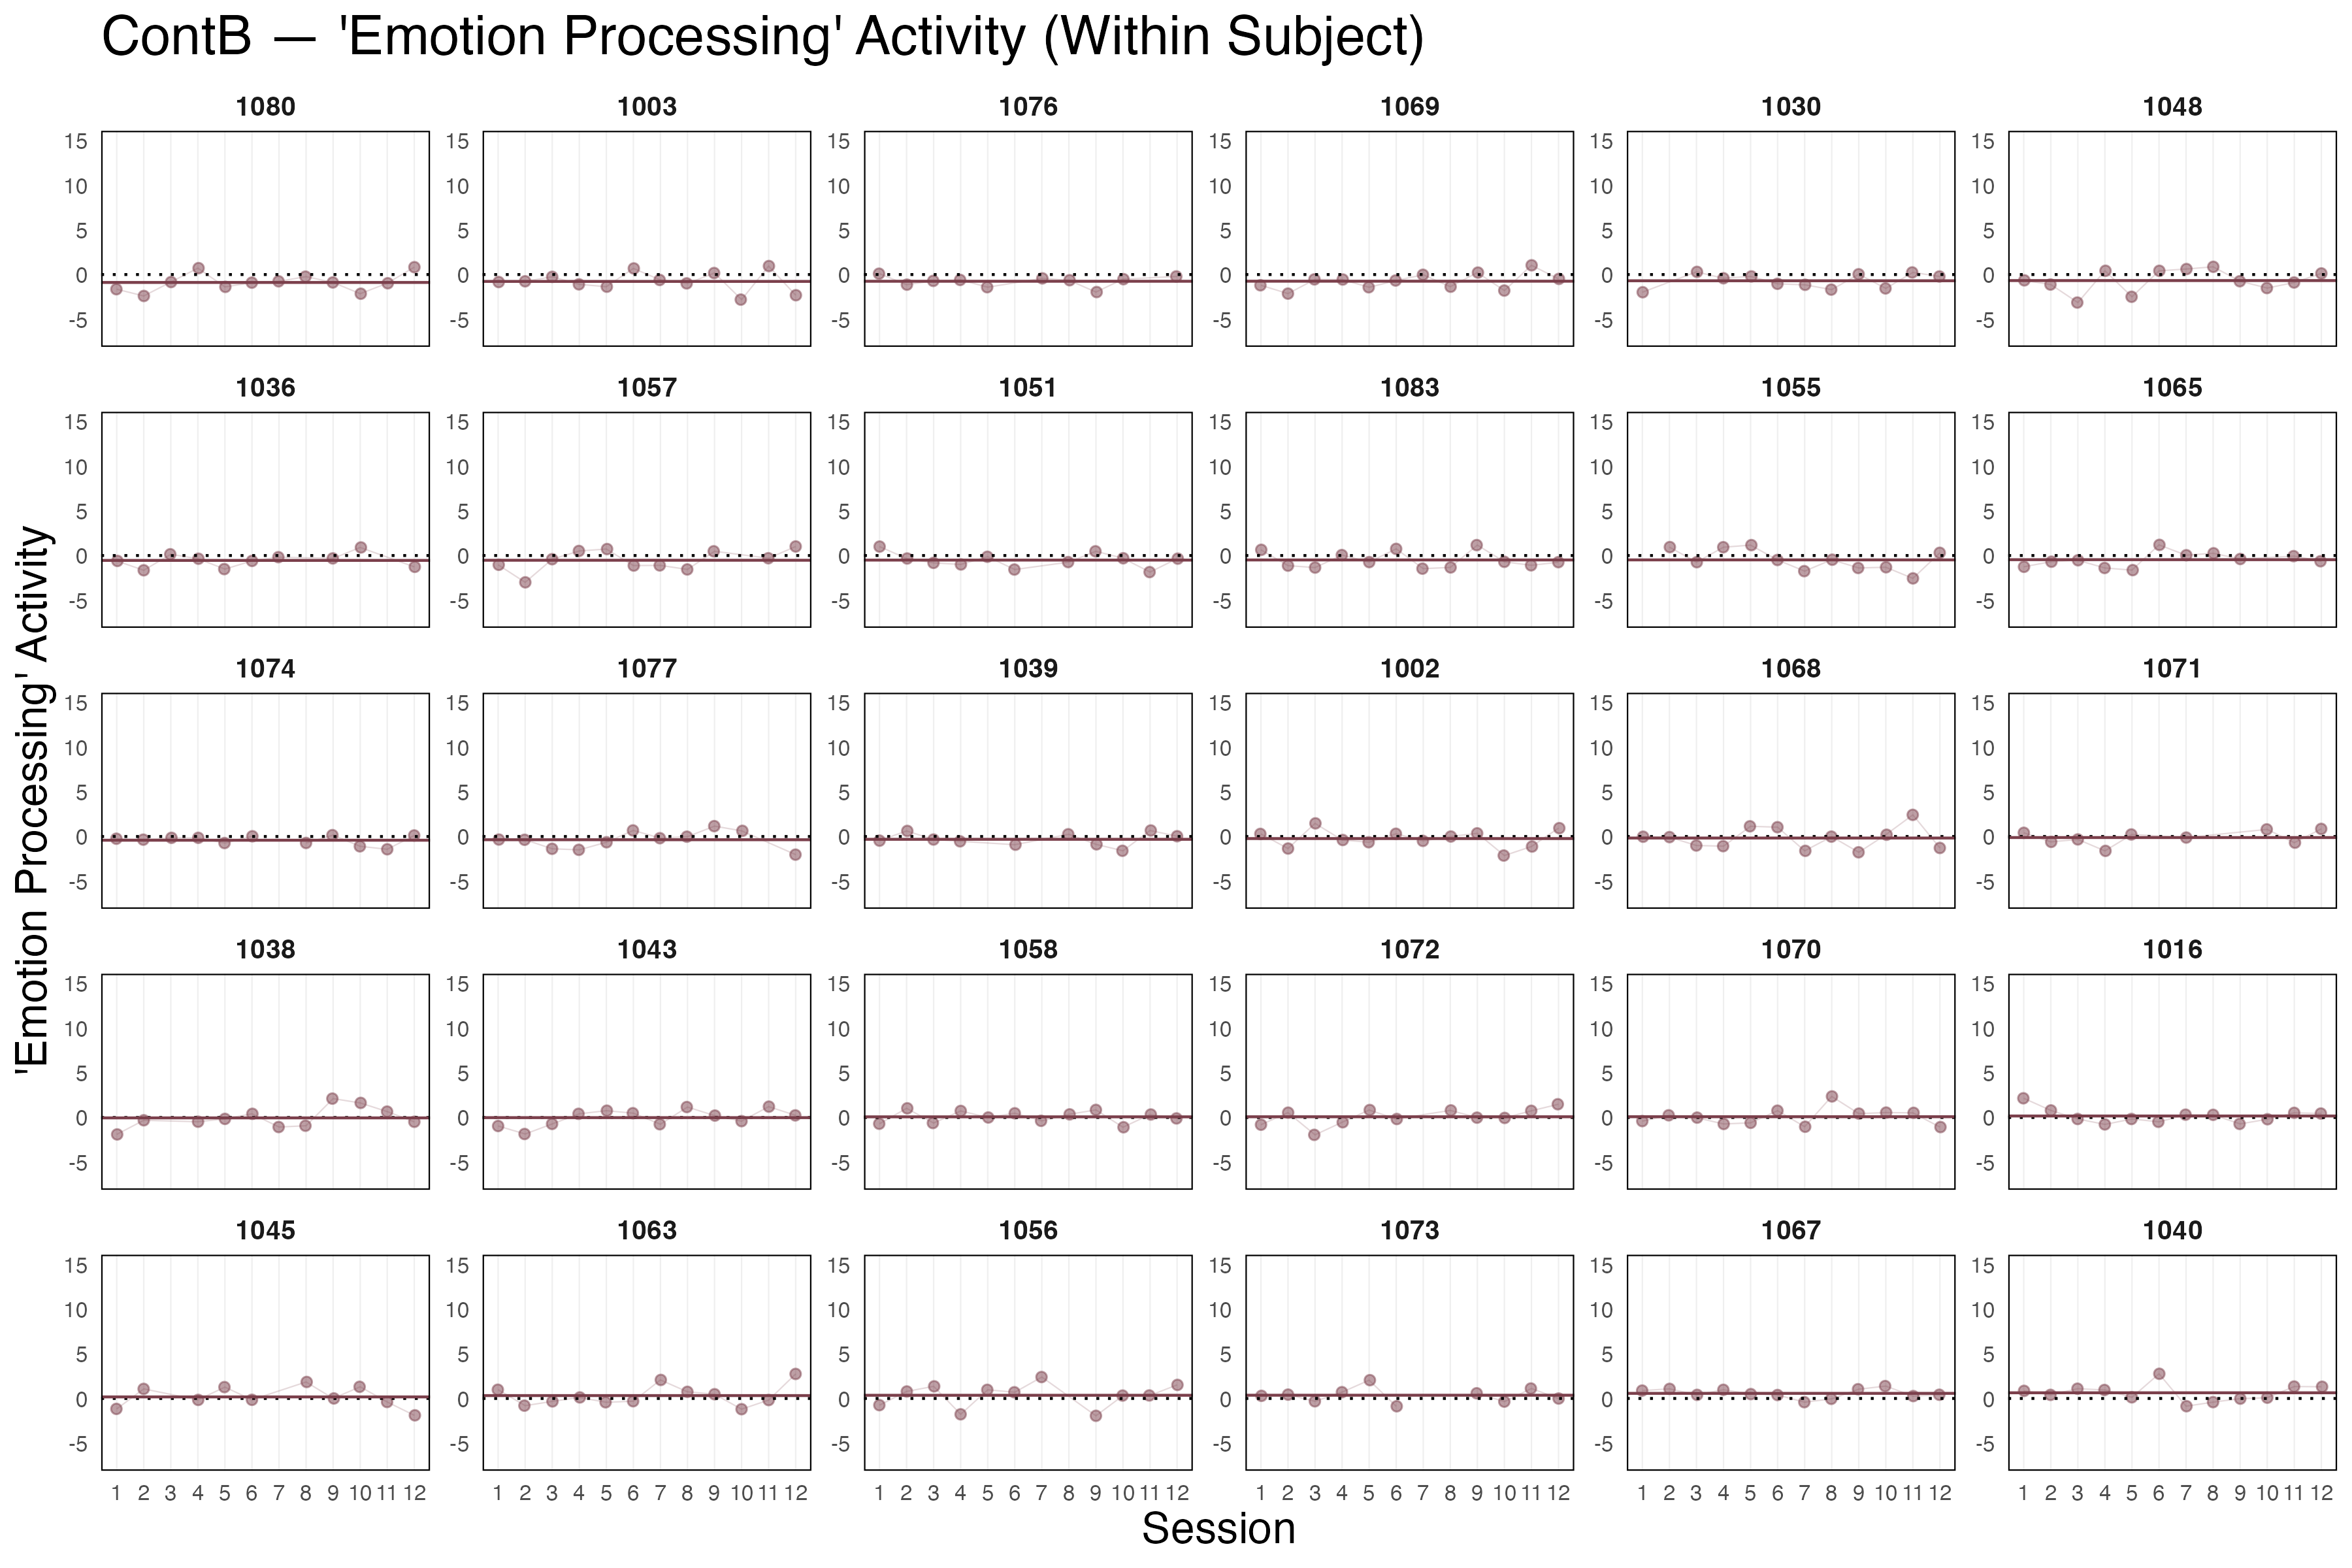
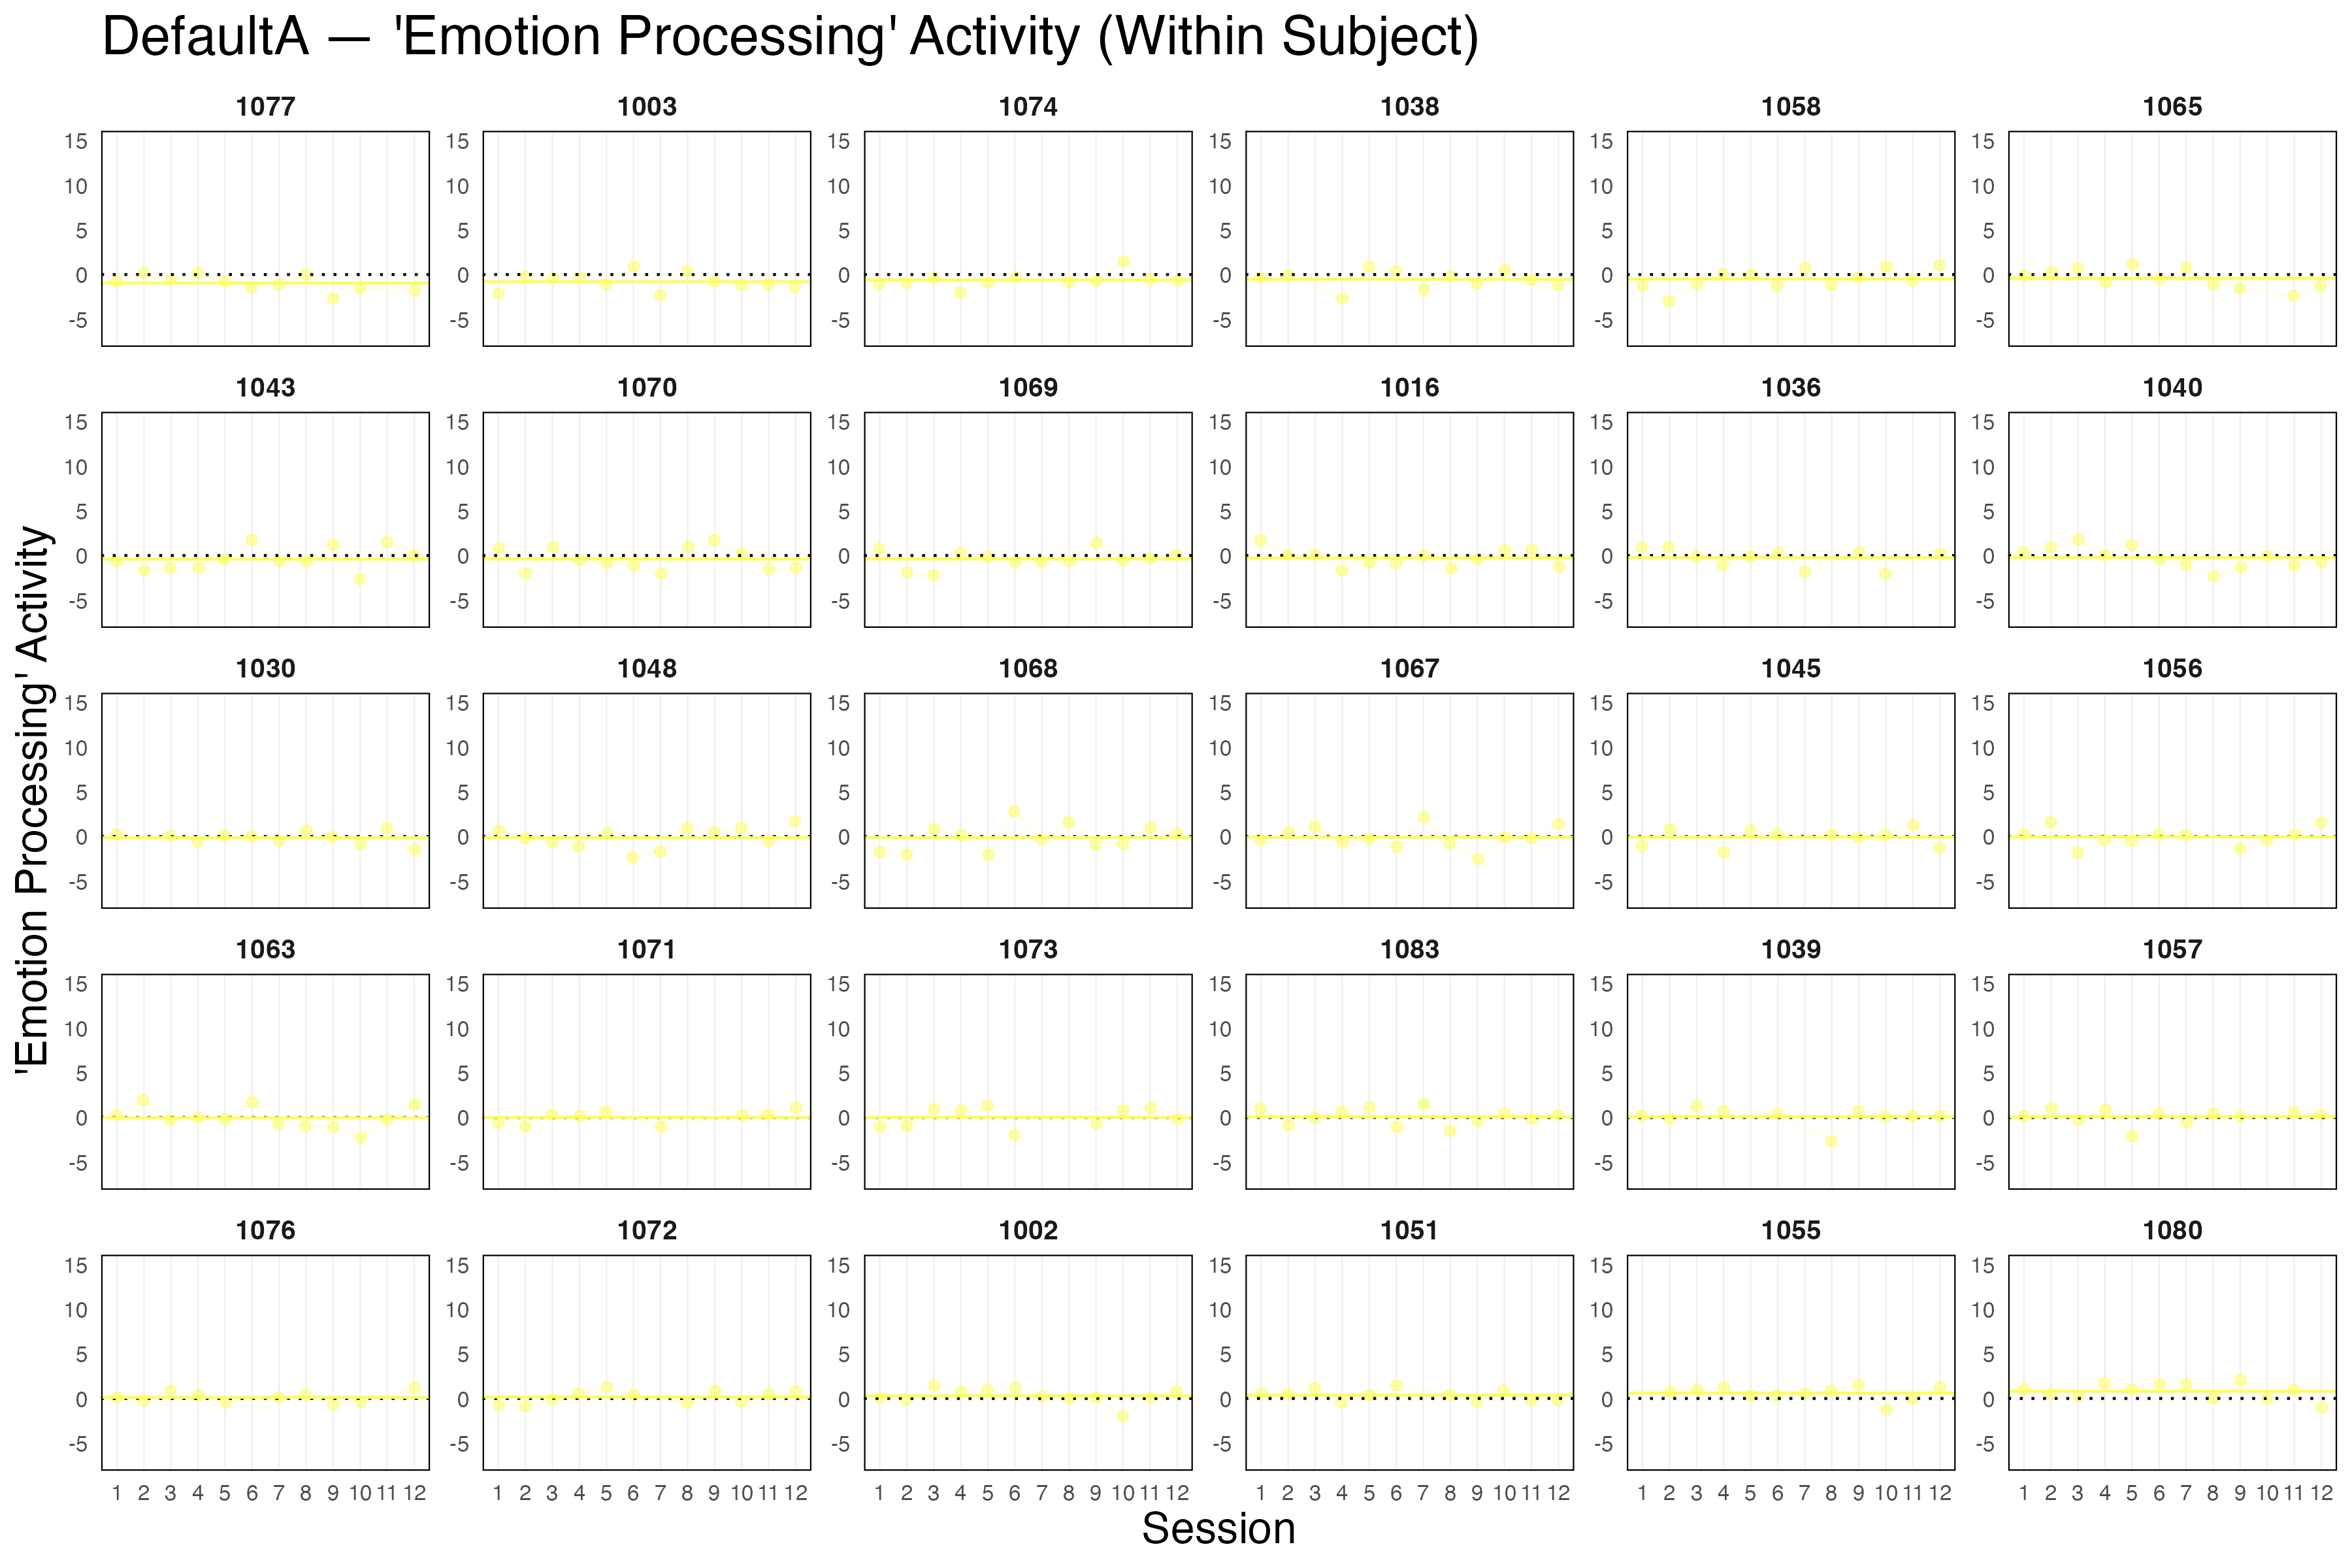
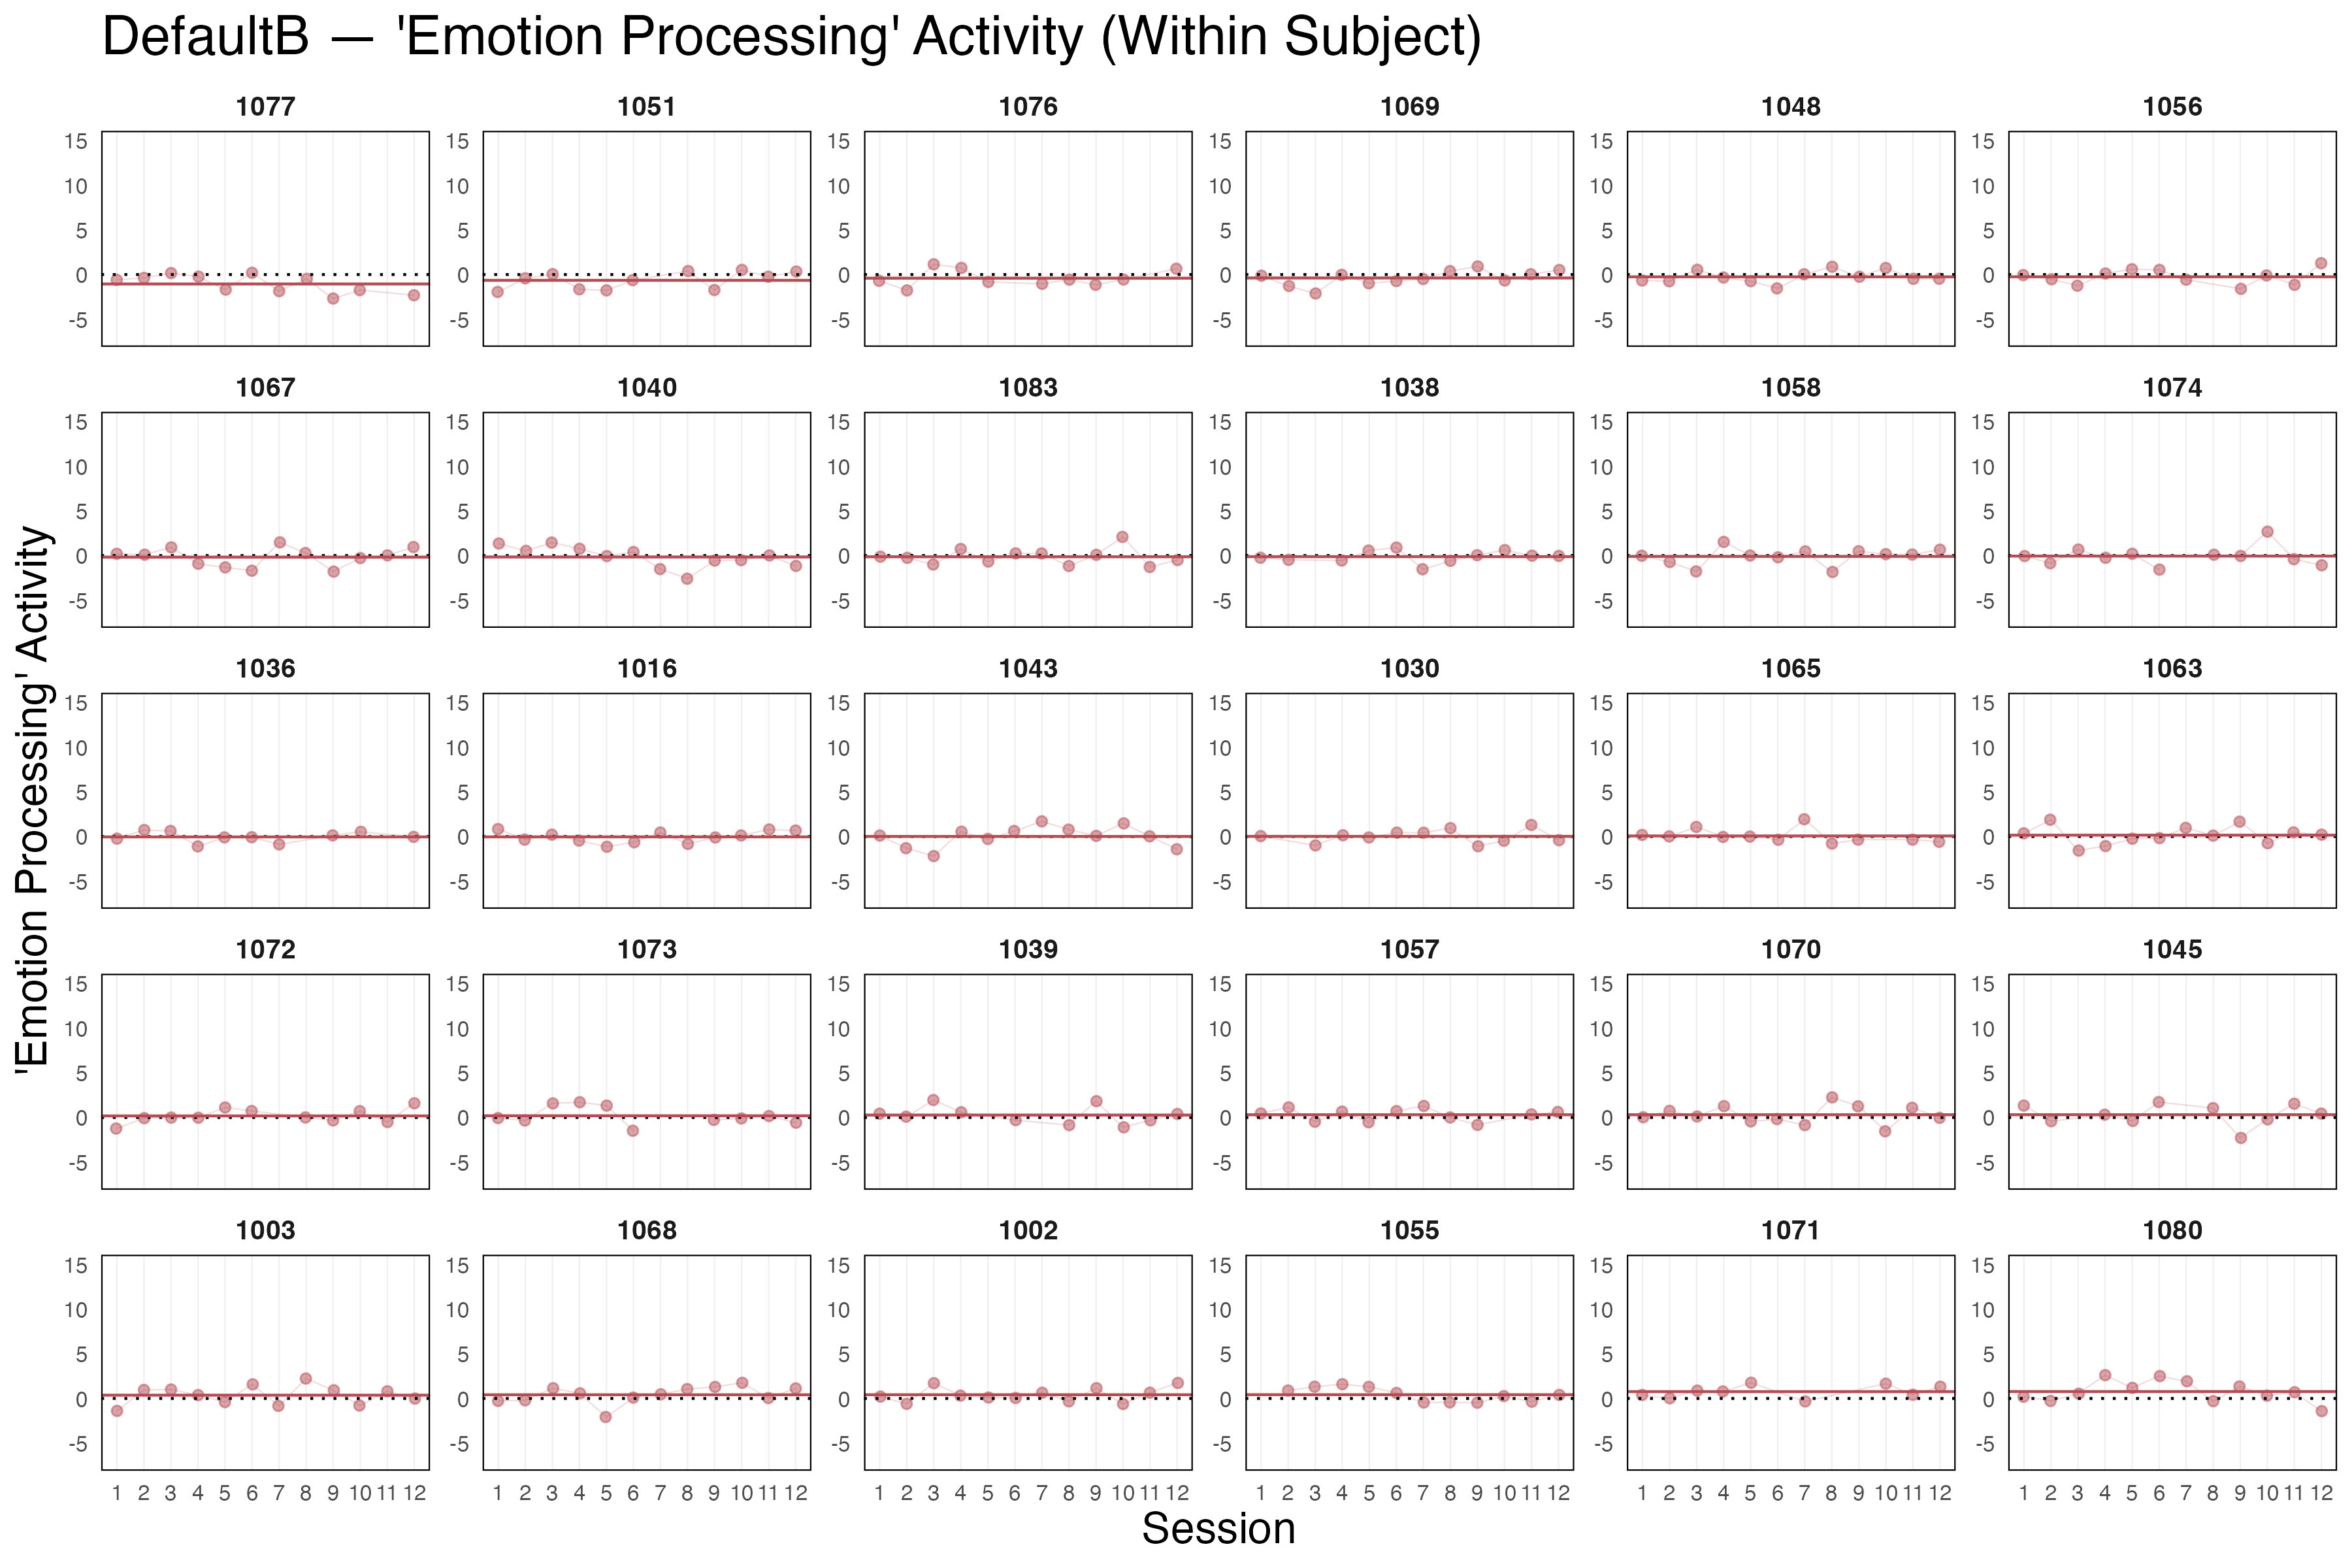
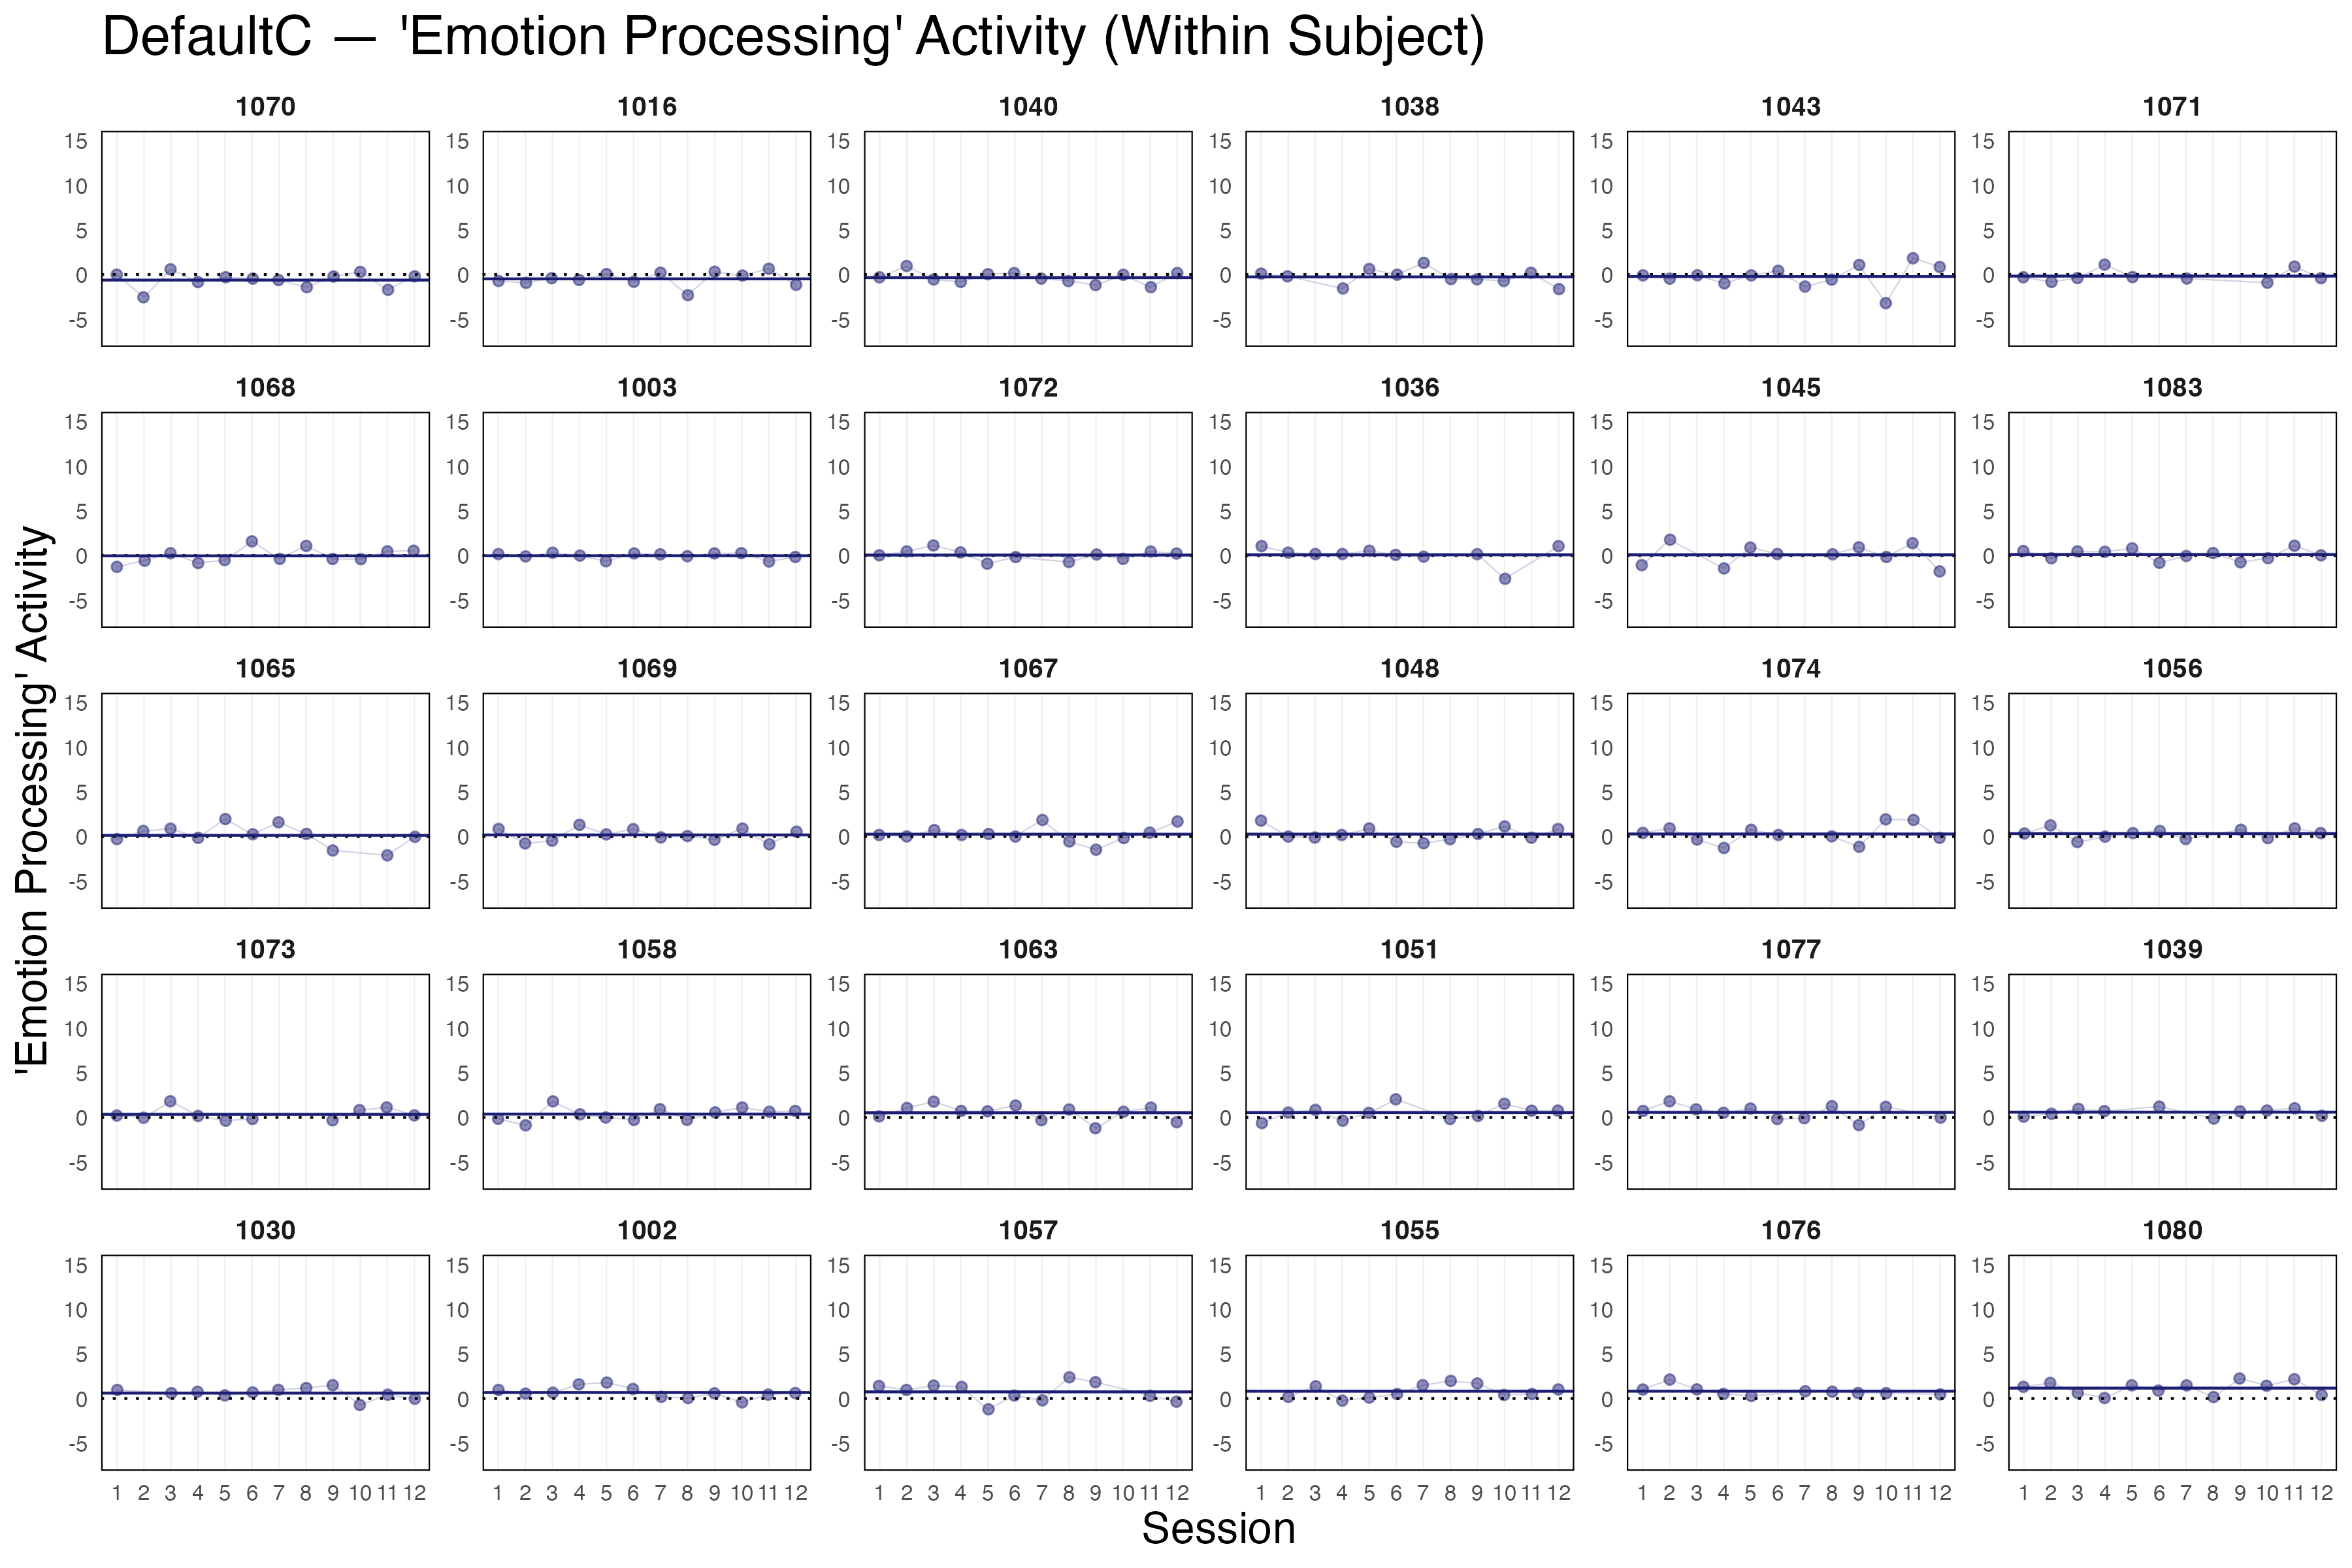
In the between-subjects plot, subjects are arranged from those showing the least ‘emotion processing’ activity on average to those showing the most. You can also see how much a subject’s activity varied about their mean across the sessions (transparent points displayed behind each subject’s average). This session level within-person variability is further visualized in the within-subject plots. These variability plots provide the opportunity to develop a visual intuition for what the ICC plots shown above are capturing. These plots have been organized in to two tabs — (Tab 1) boundaries with activity showed significant ‘emotion processing’ activity in project 2 and (Tab 2) all other boundaries.
[INSERT Amygdala IMAGE HERE]
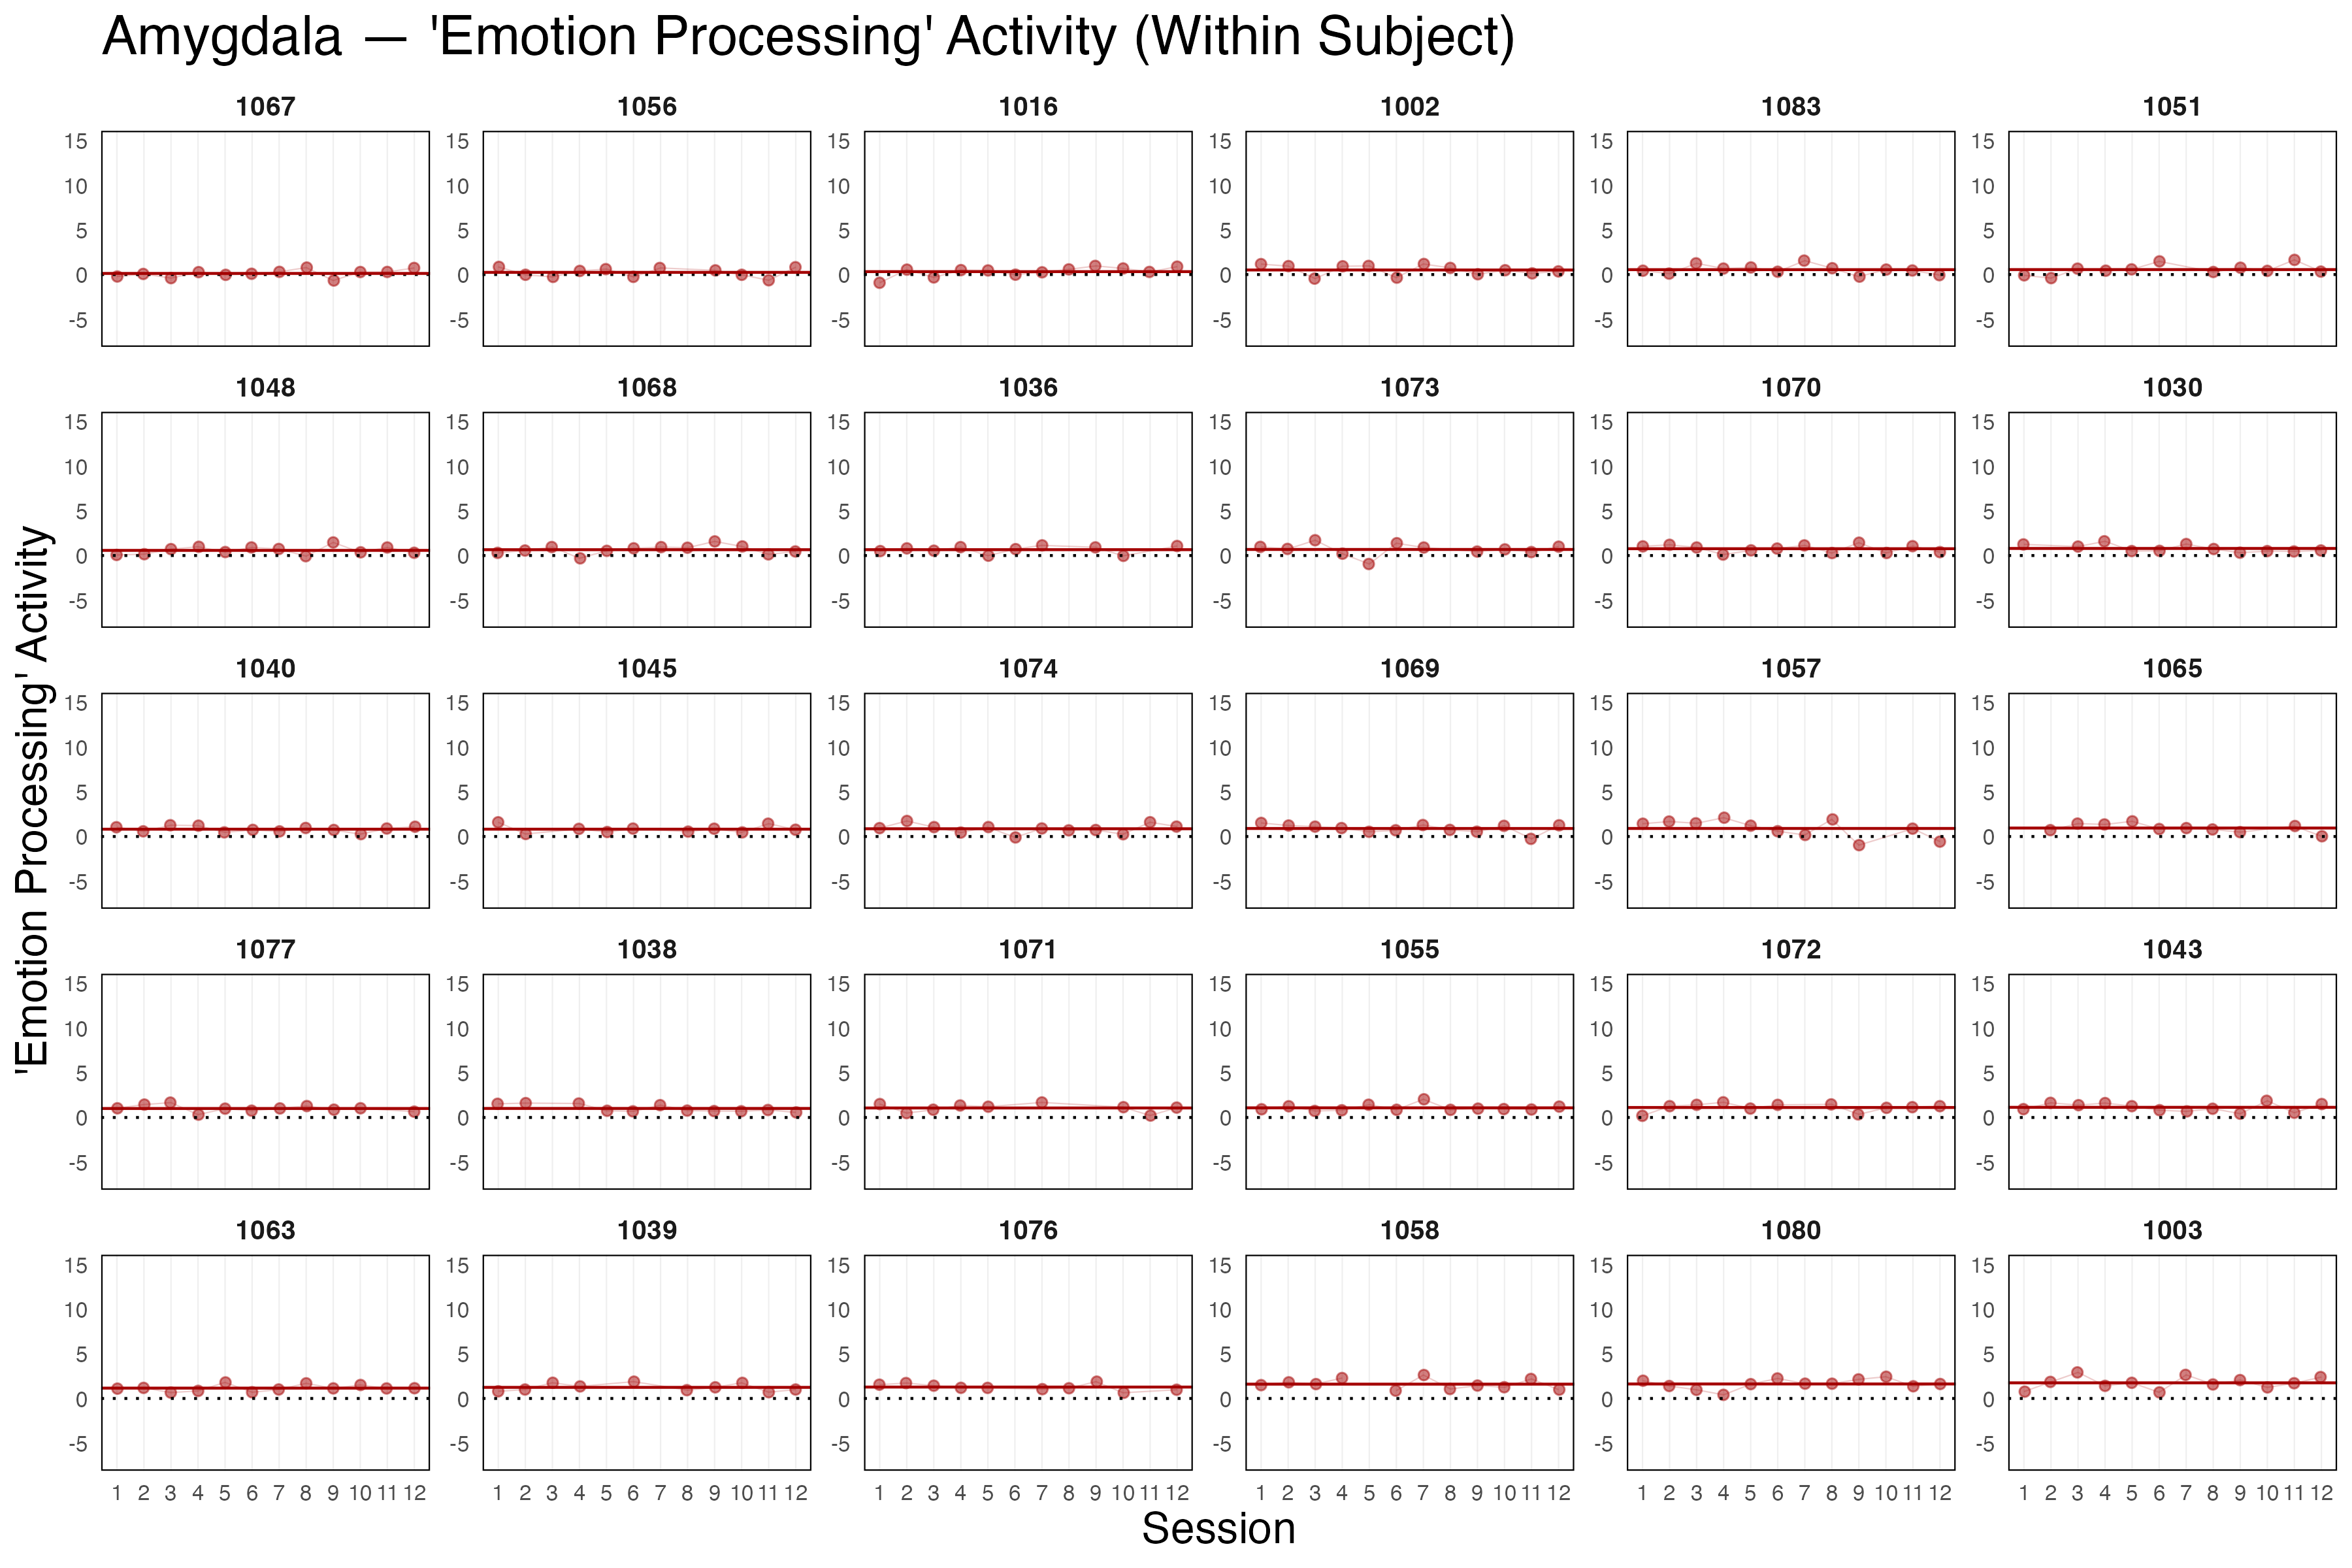
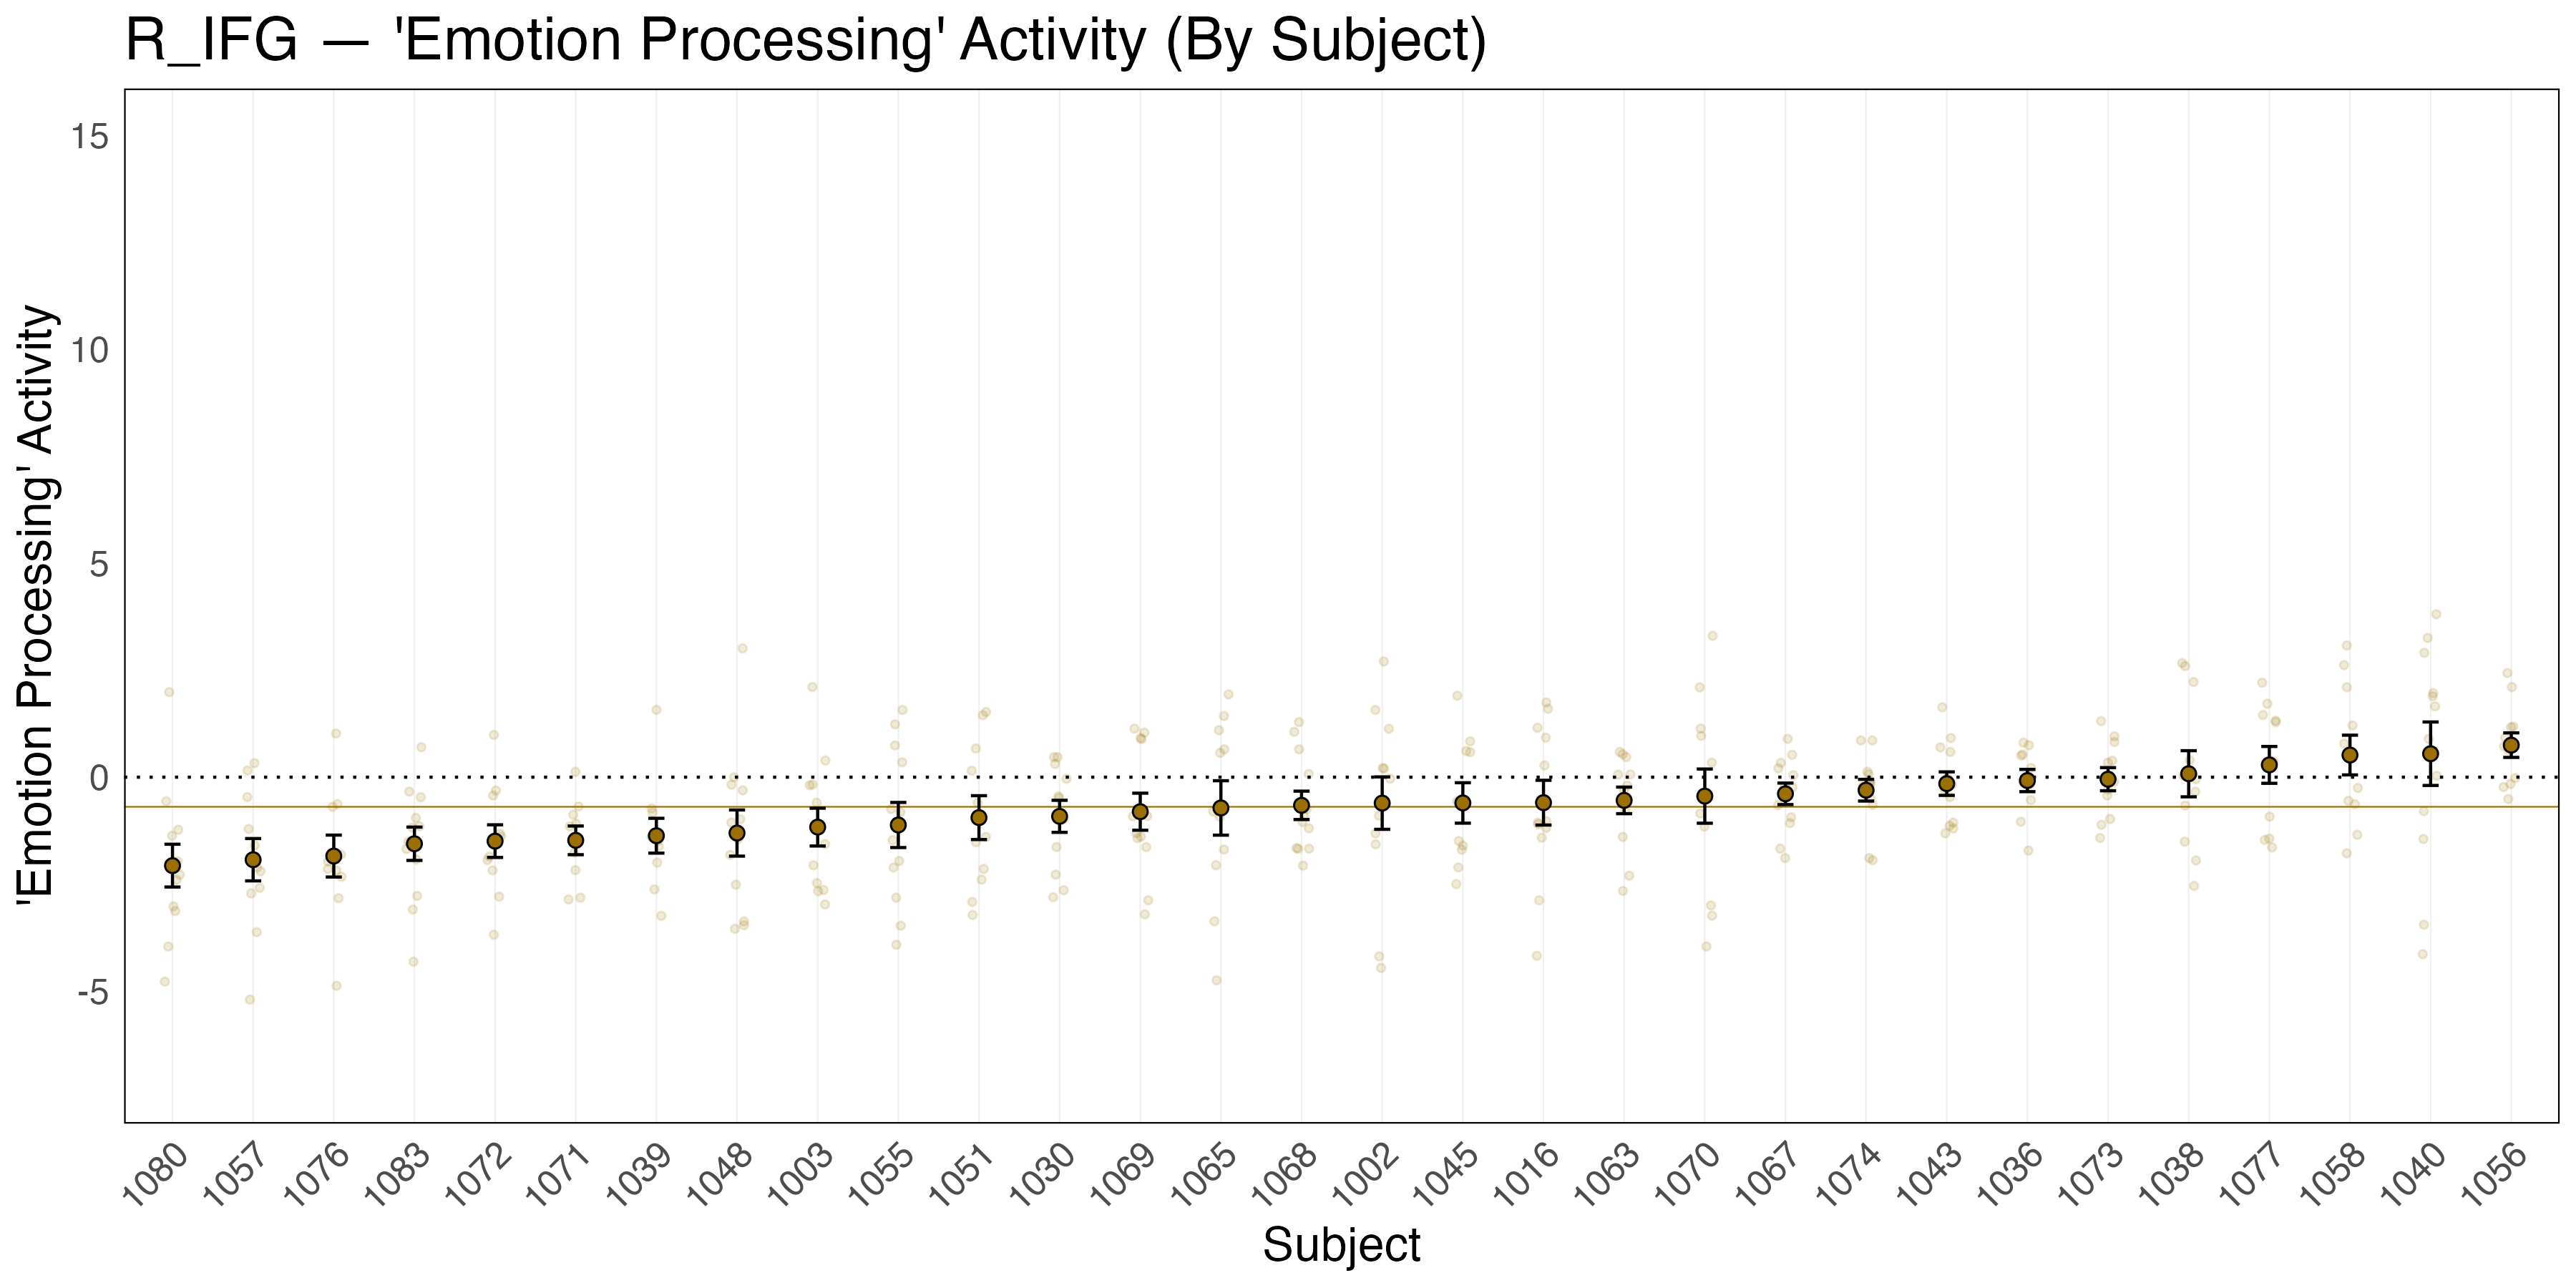
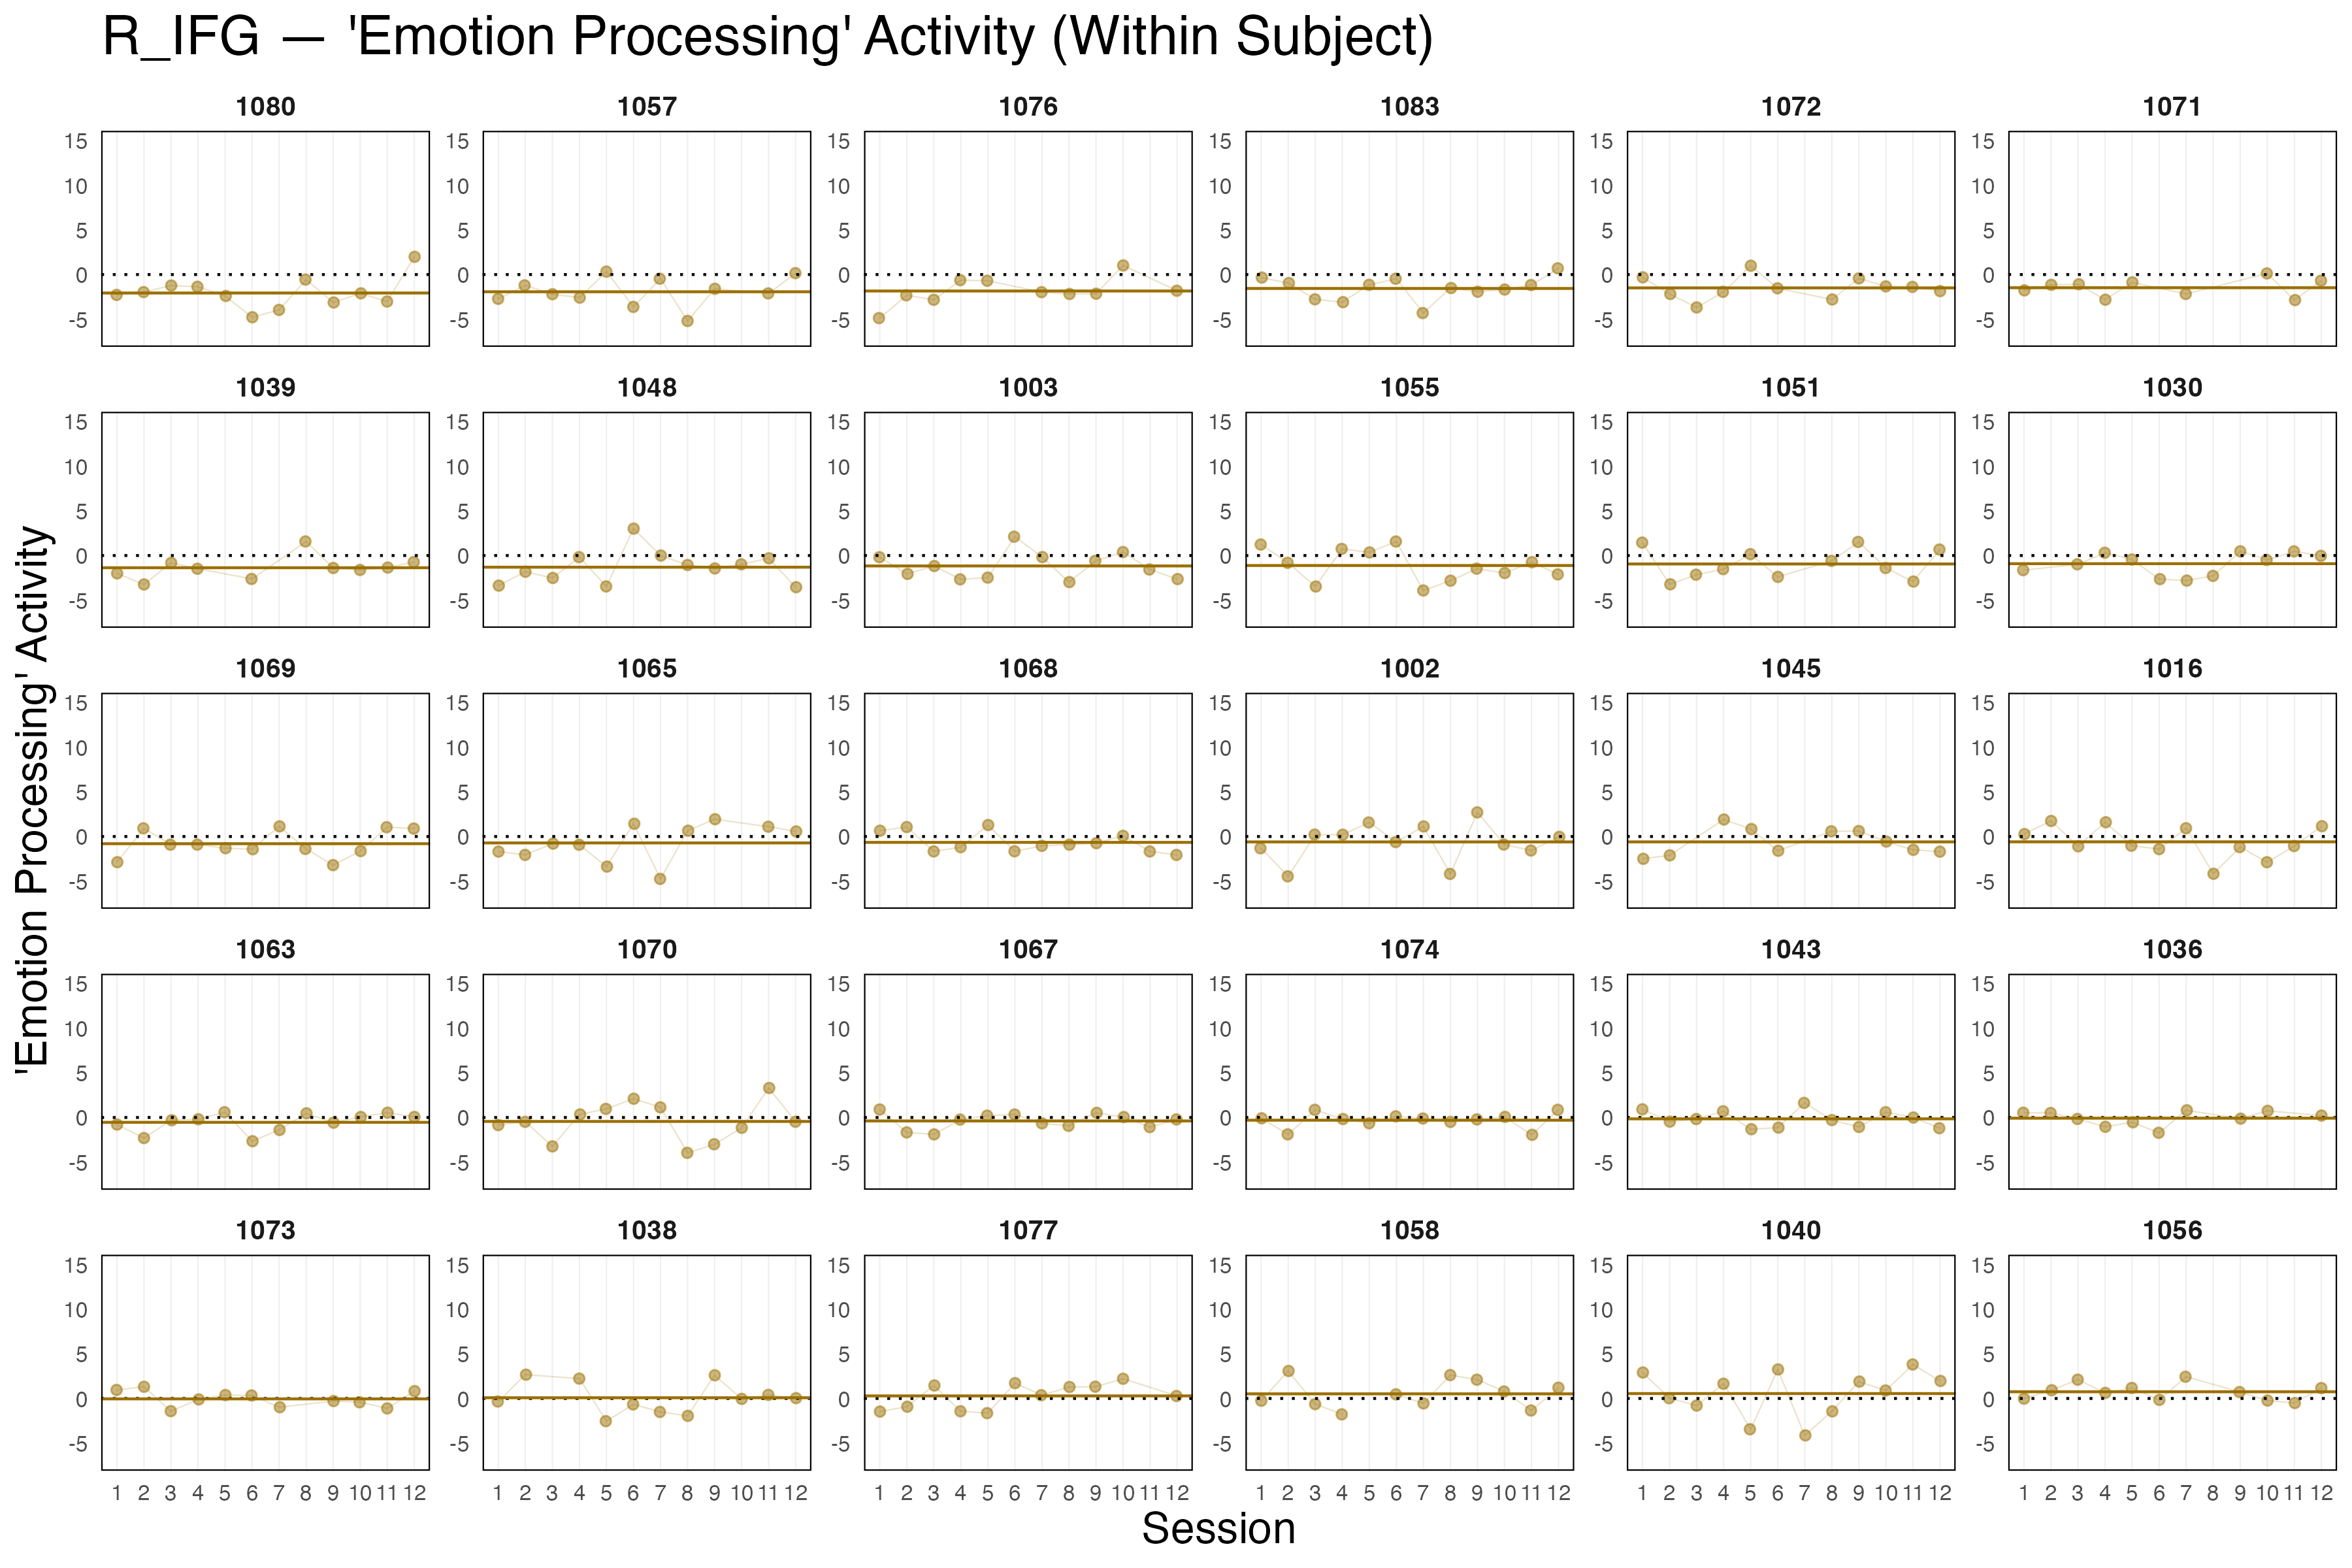
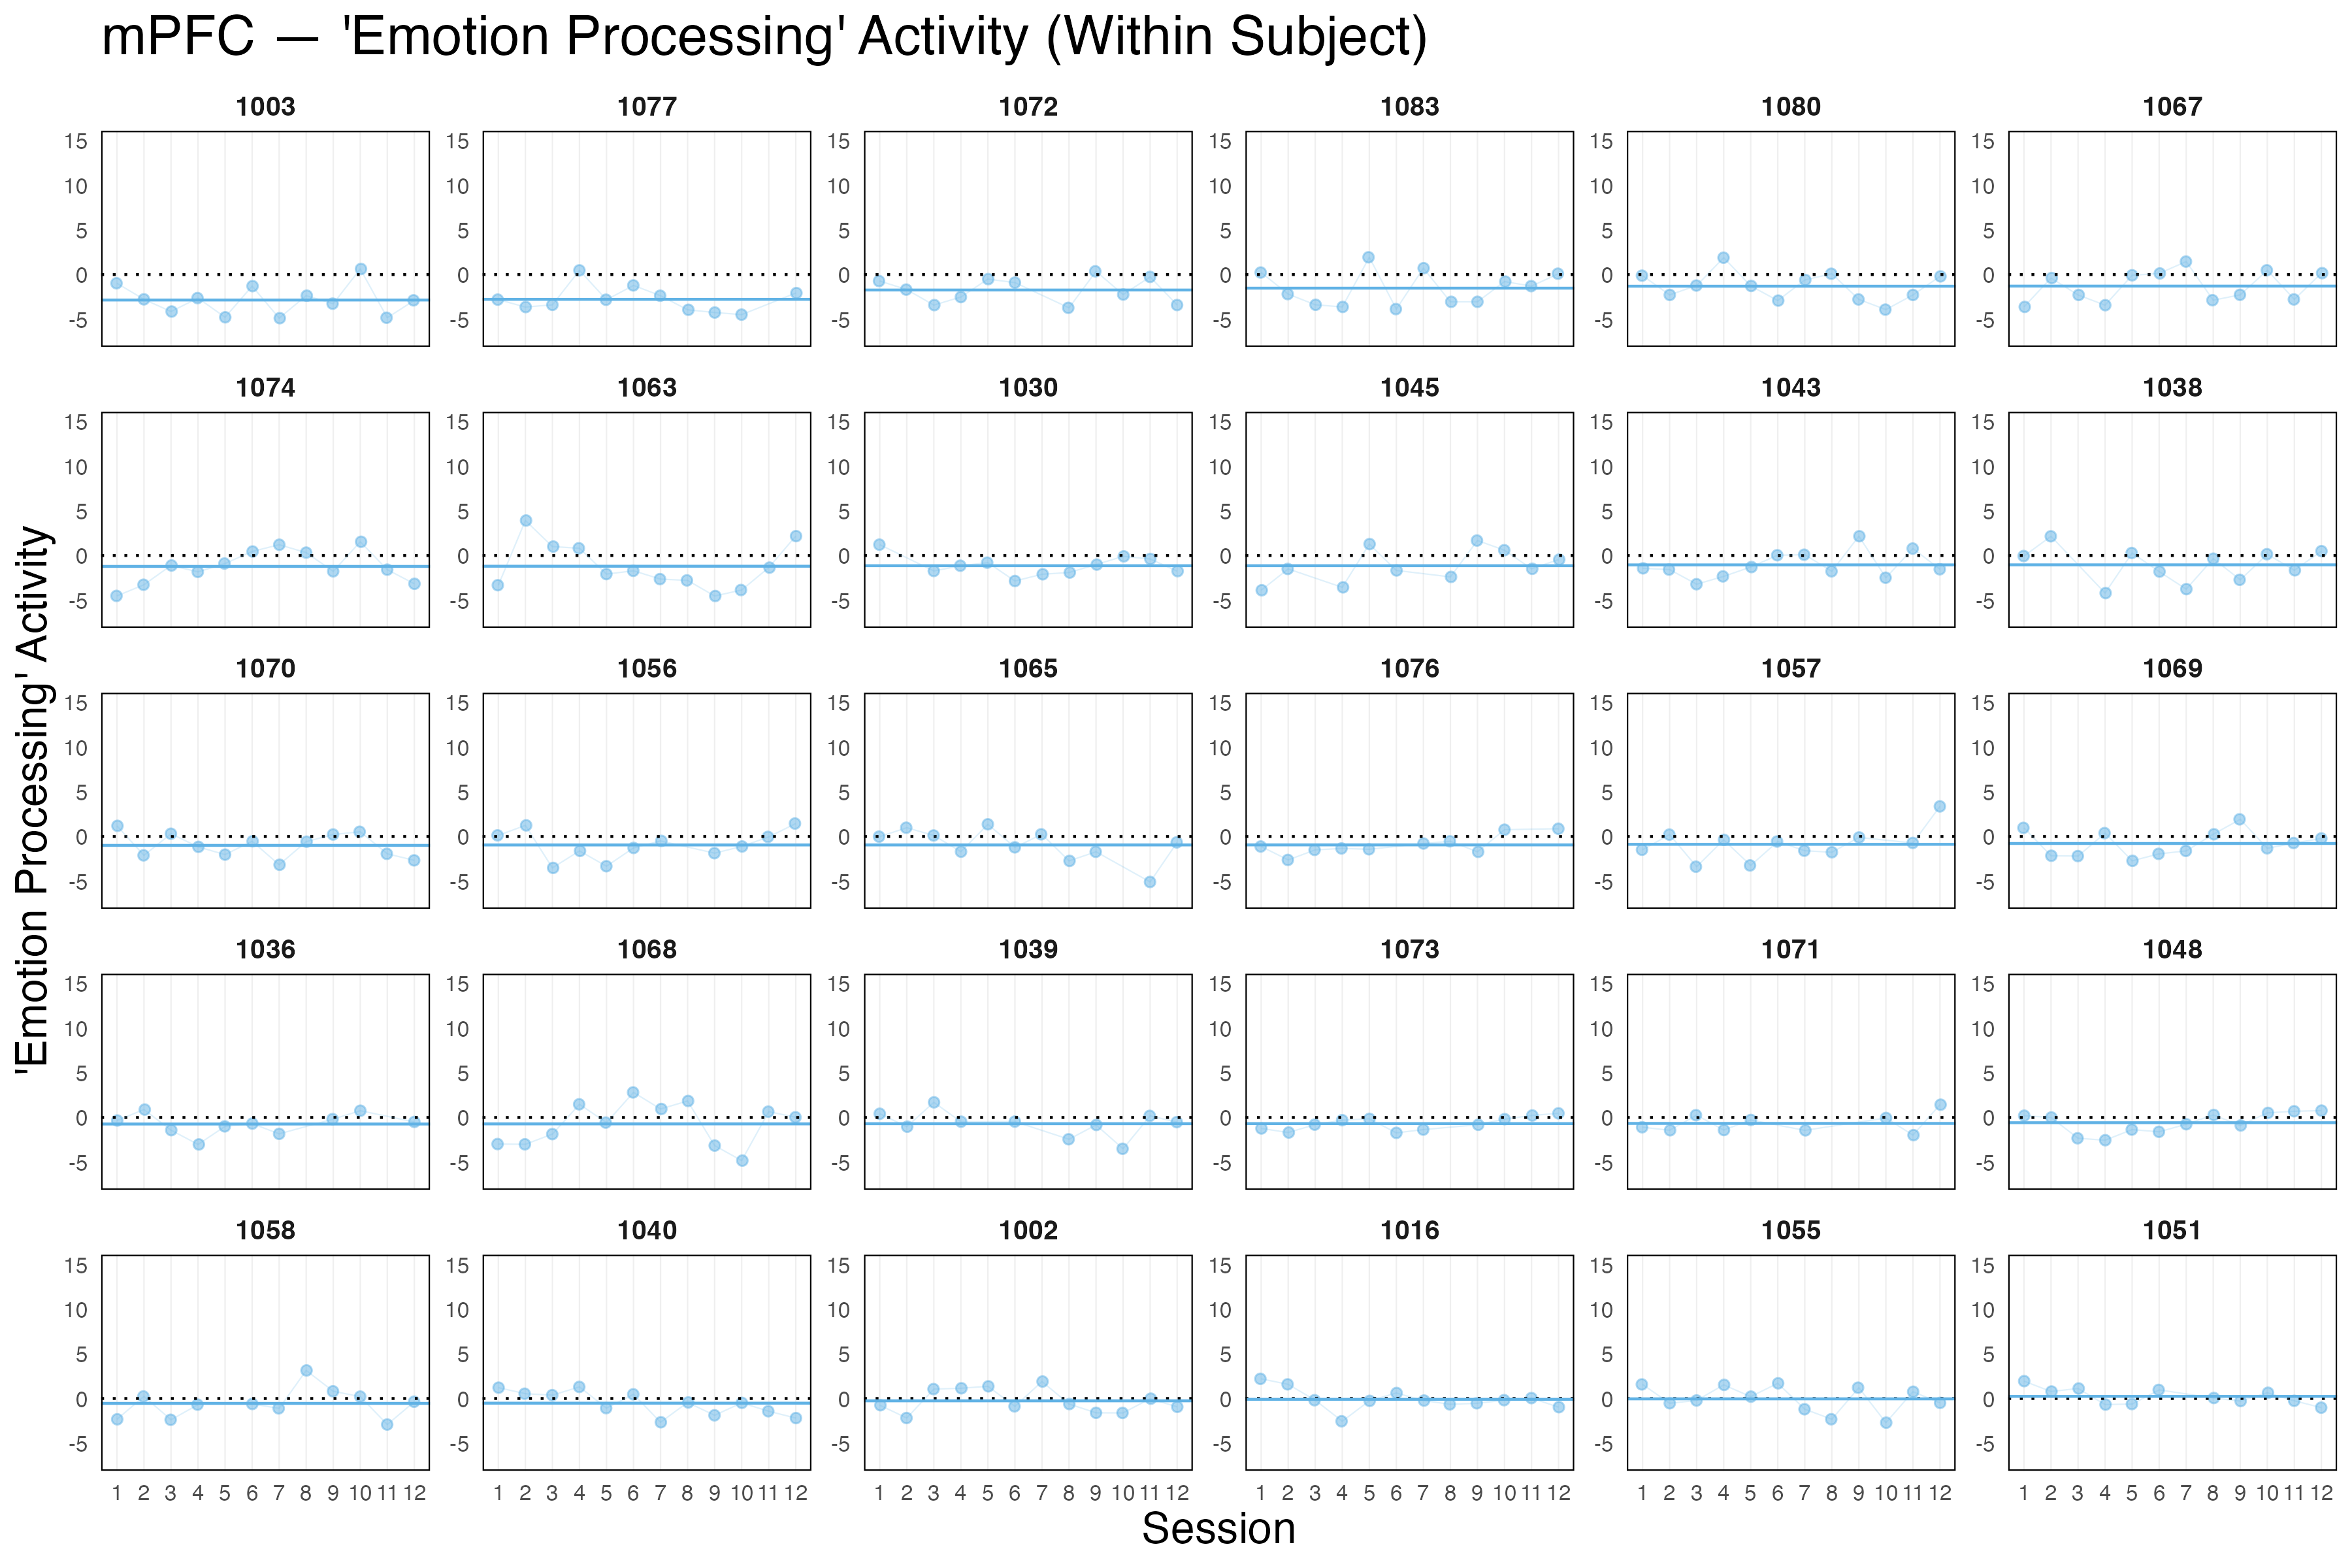

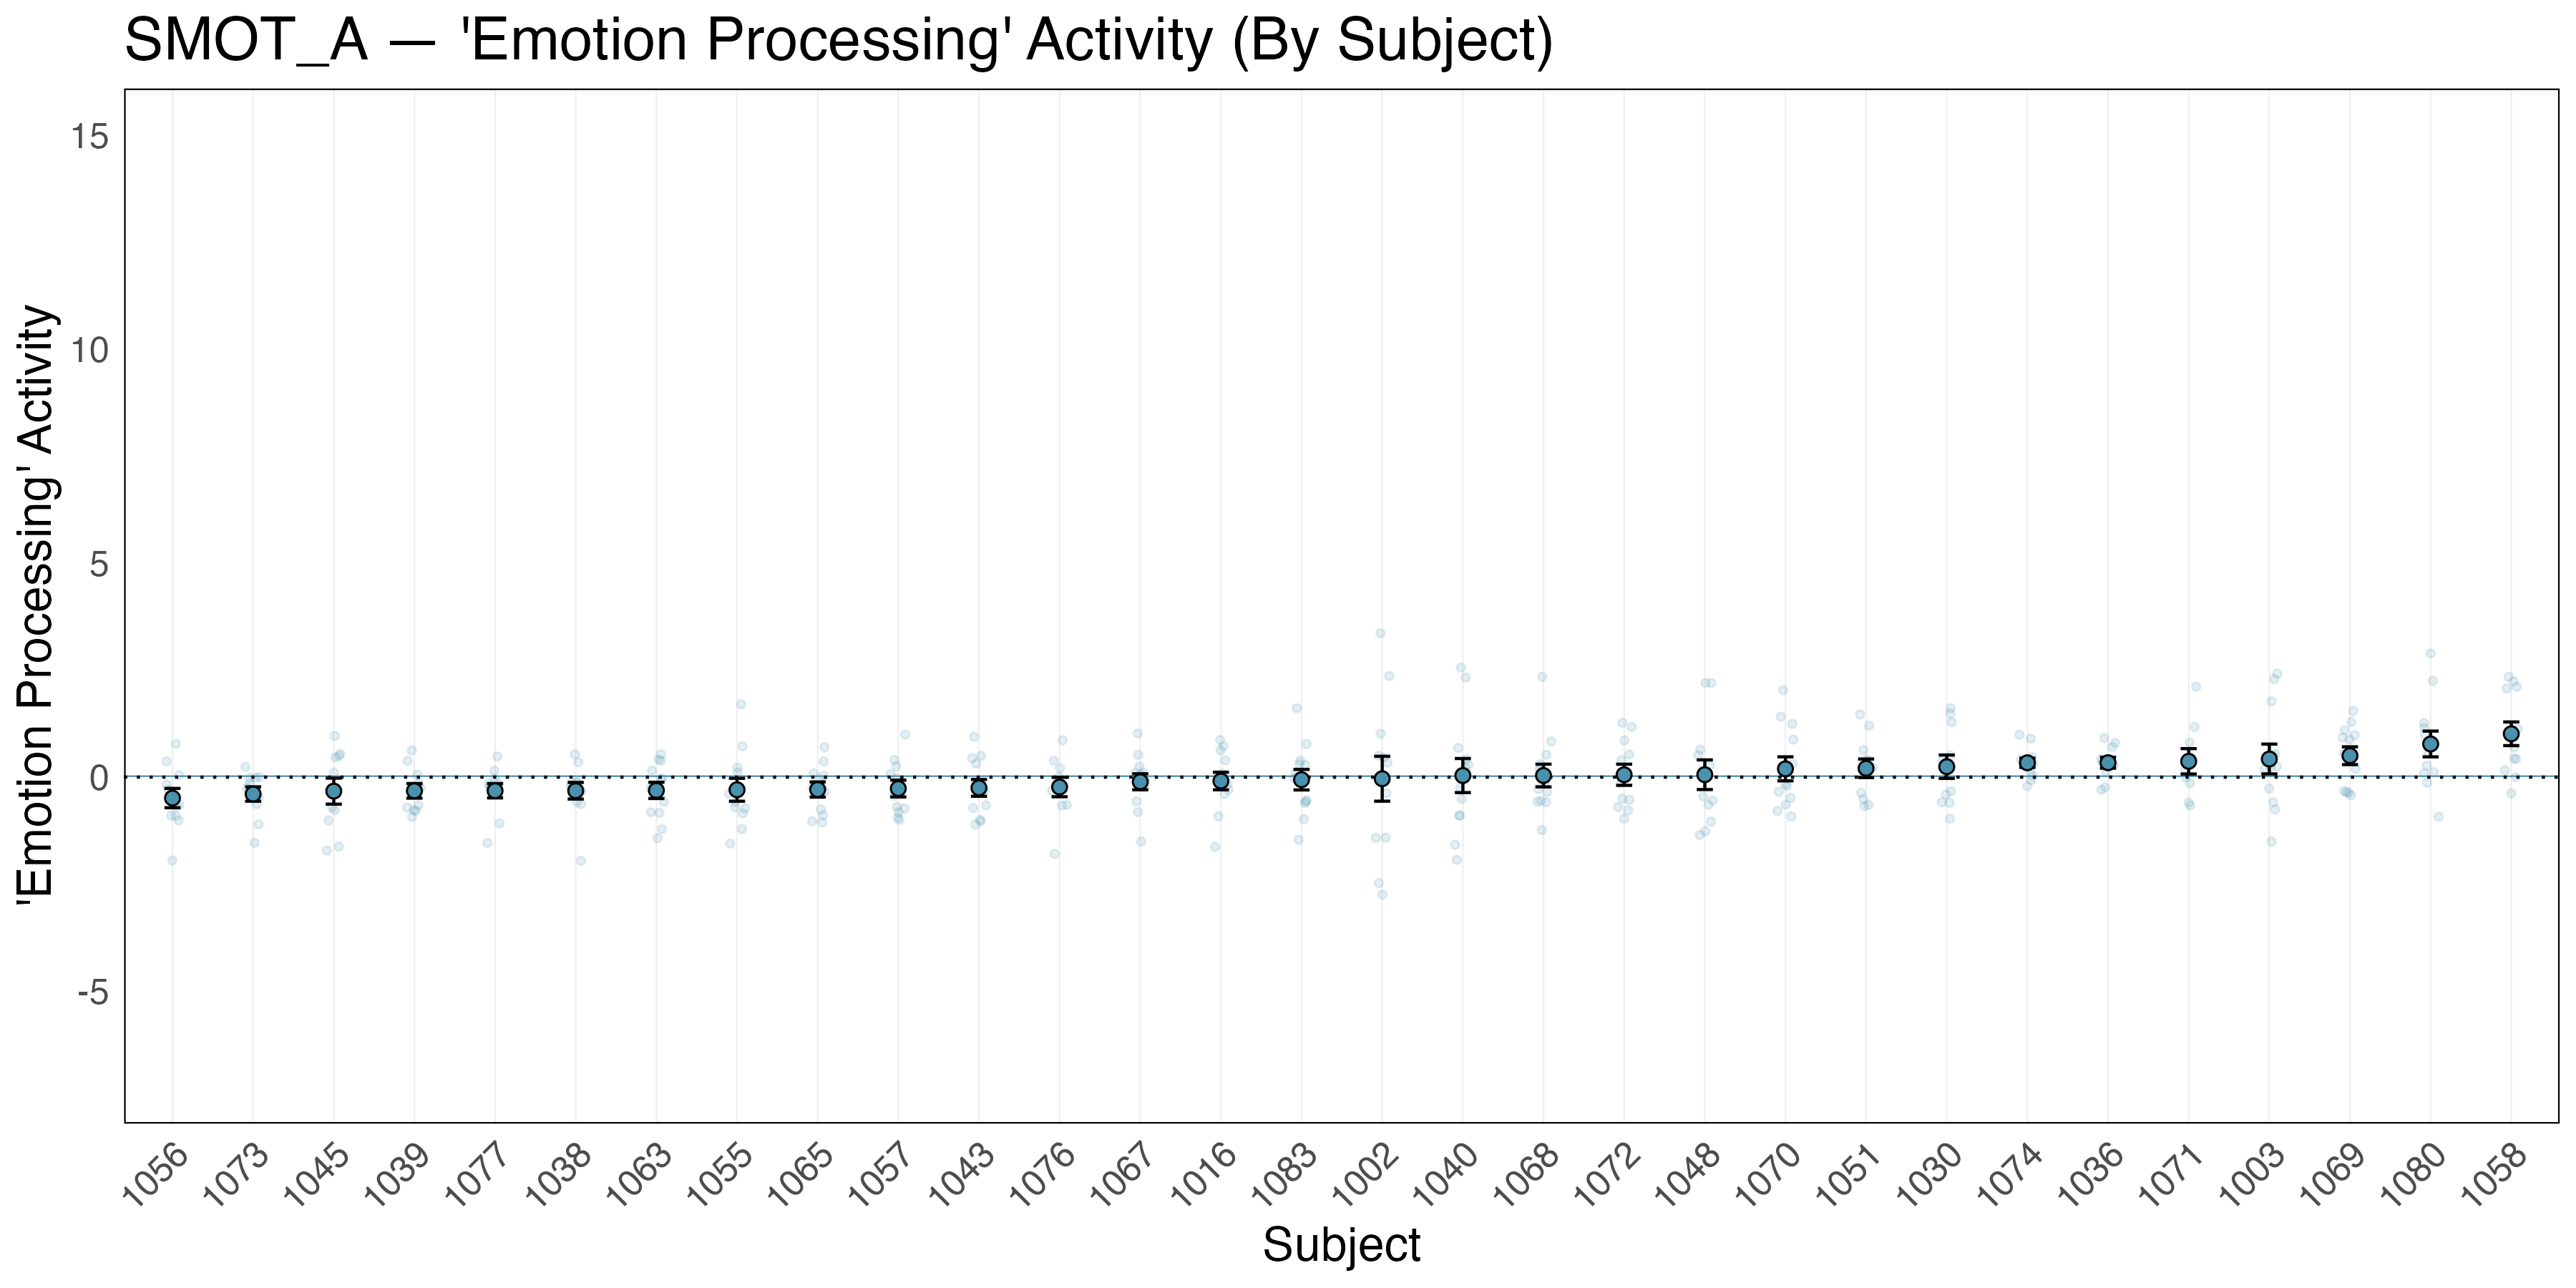


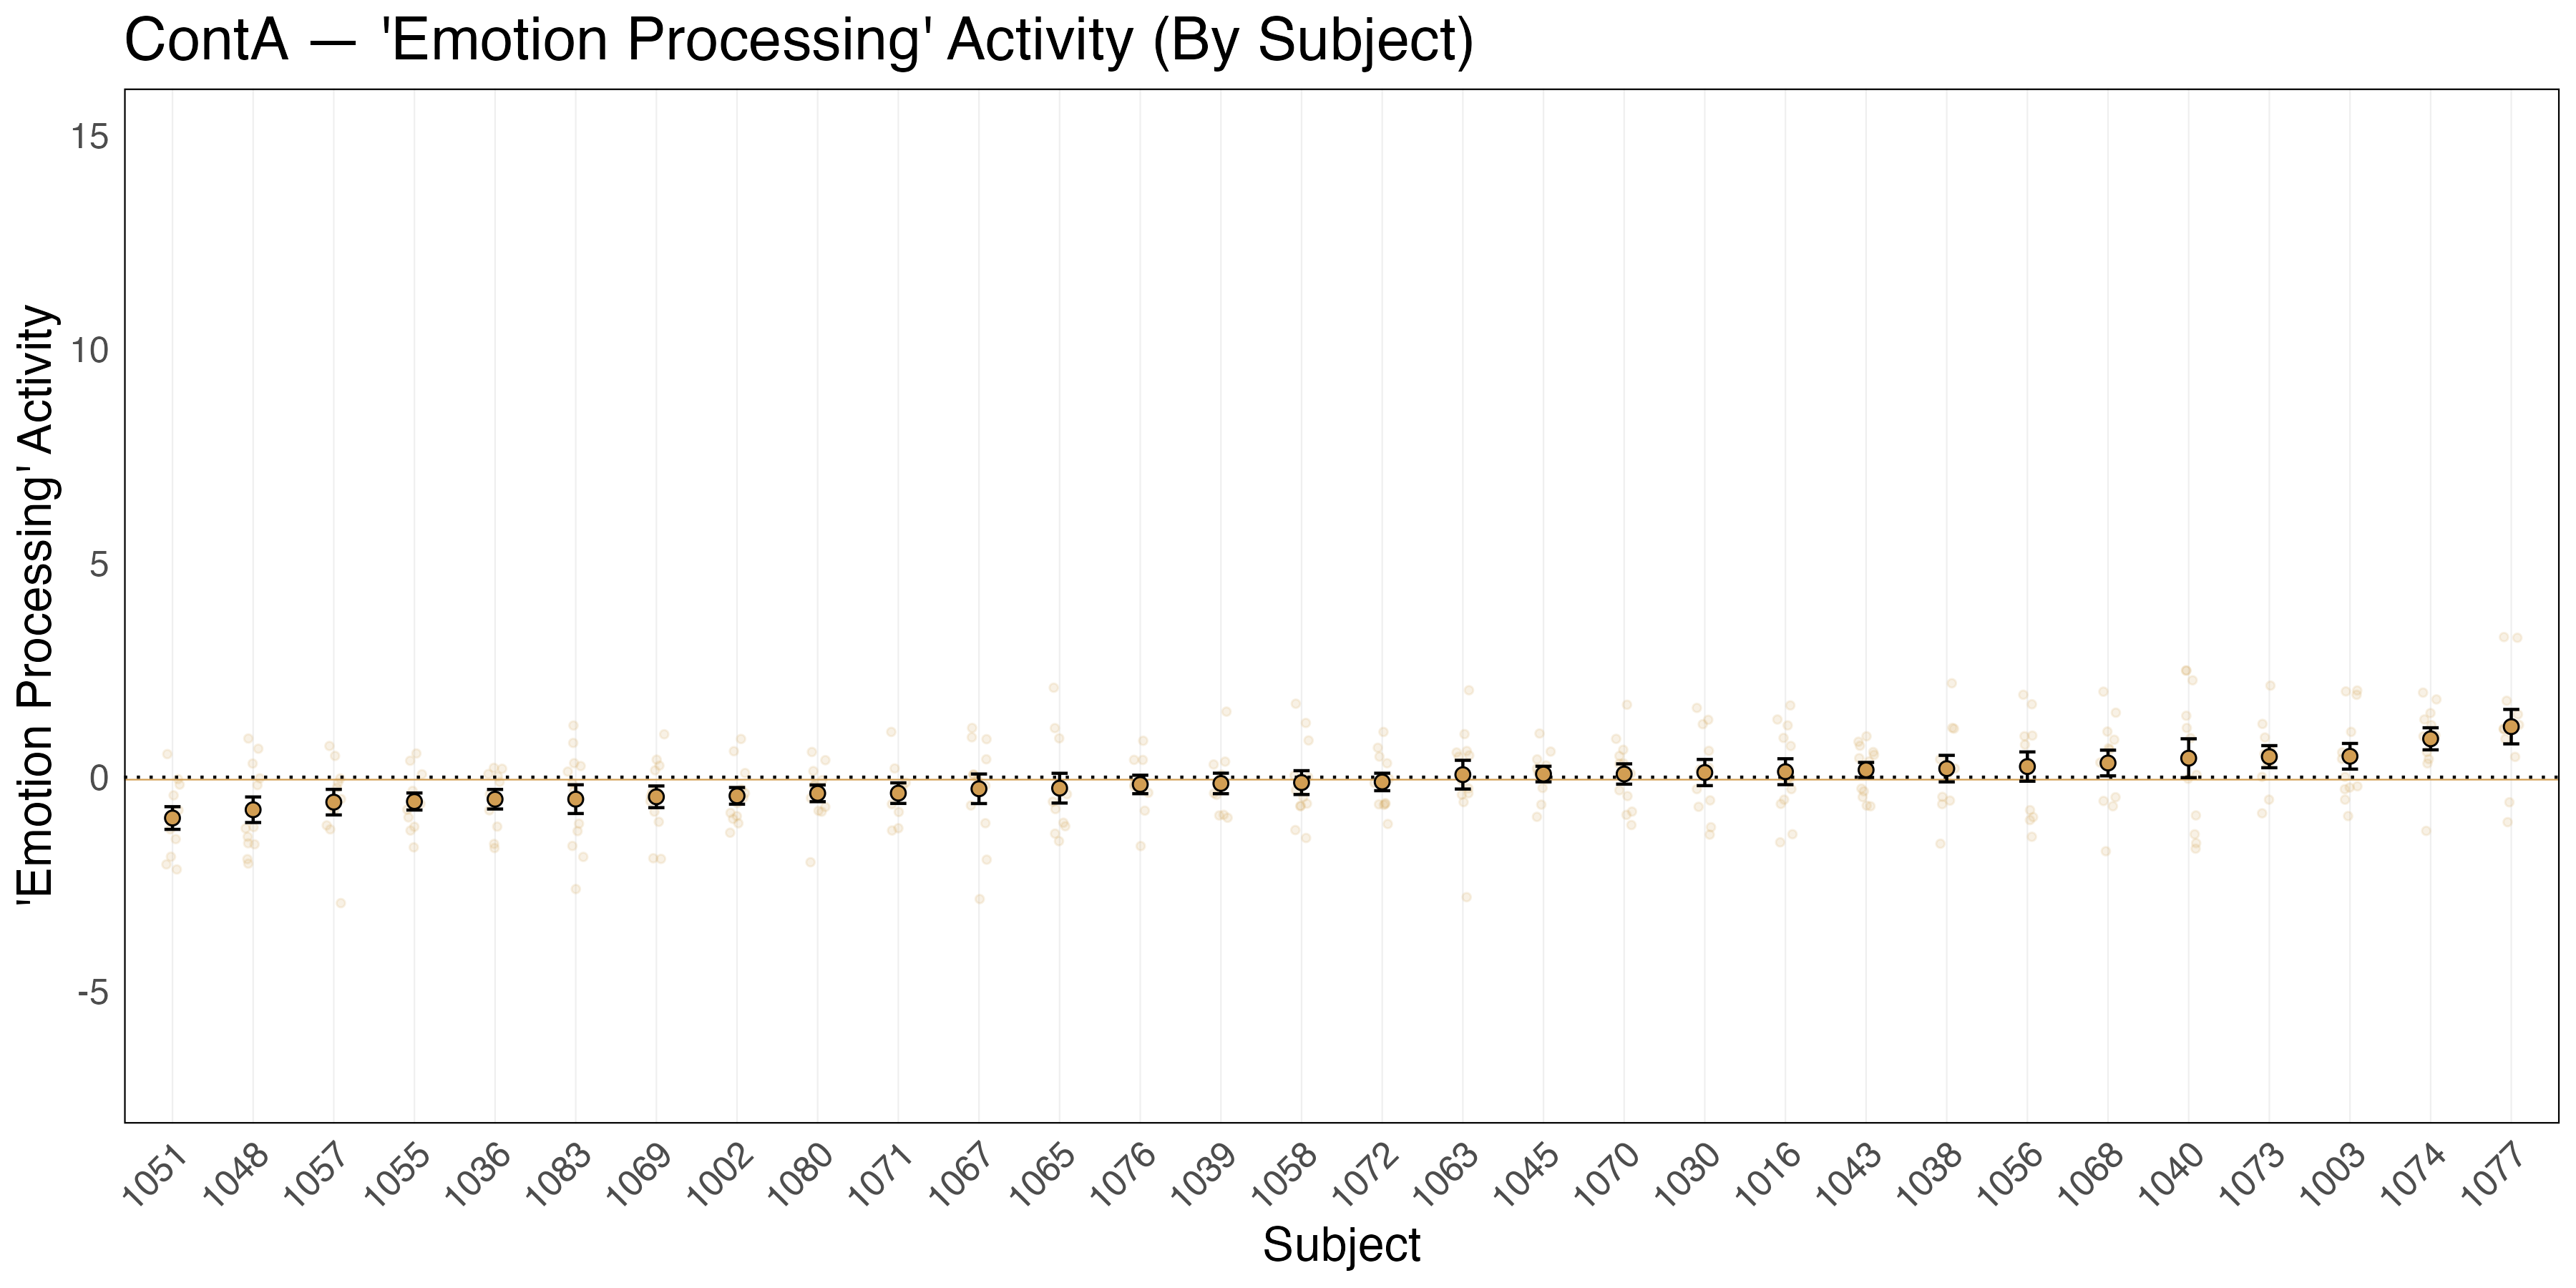
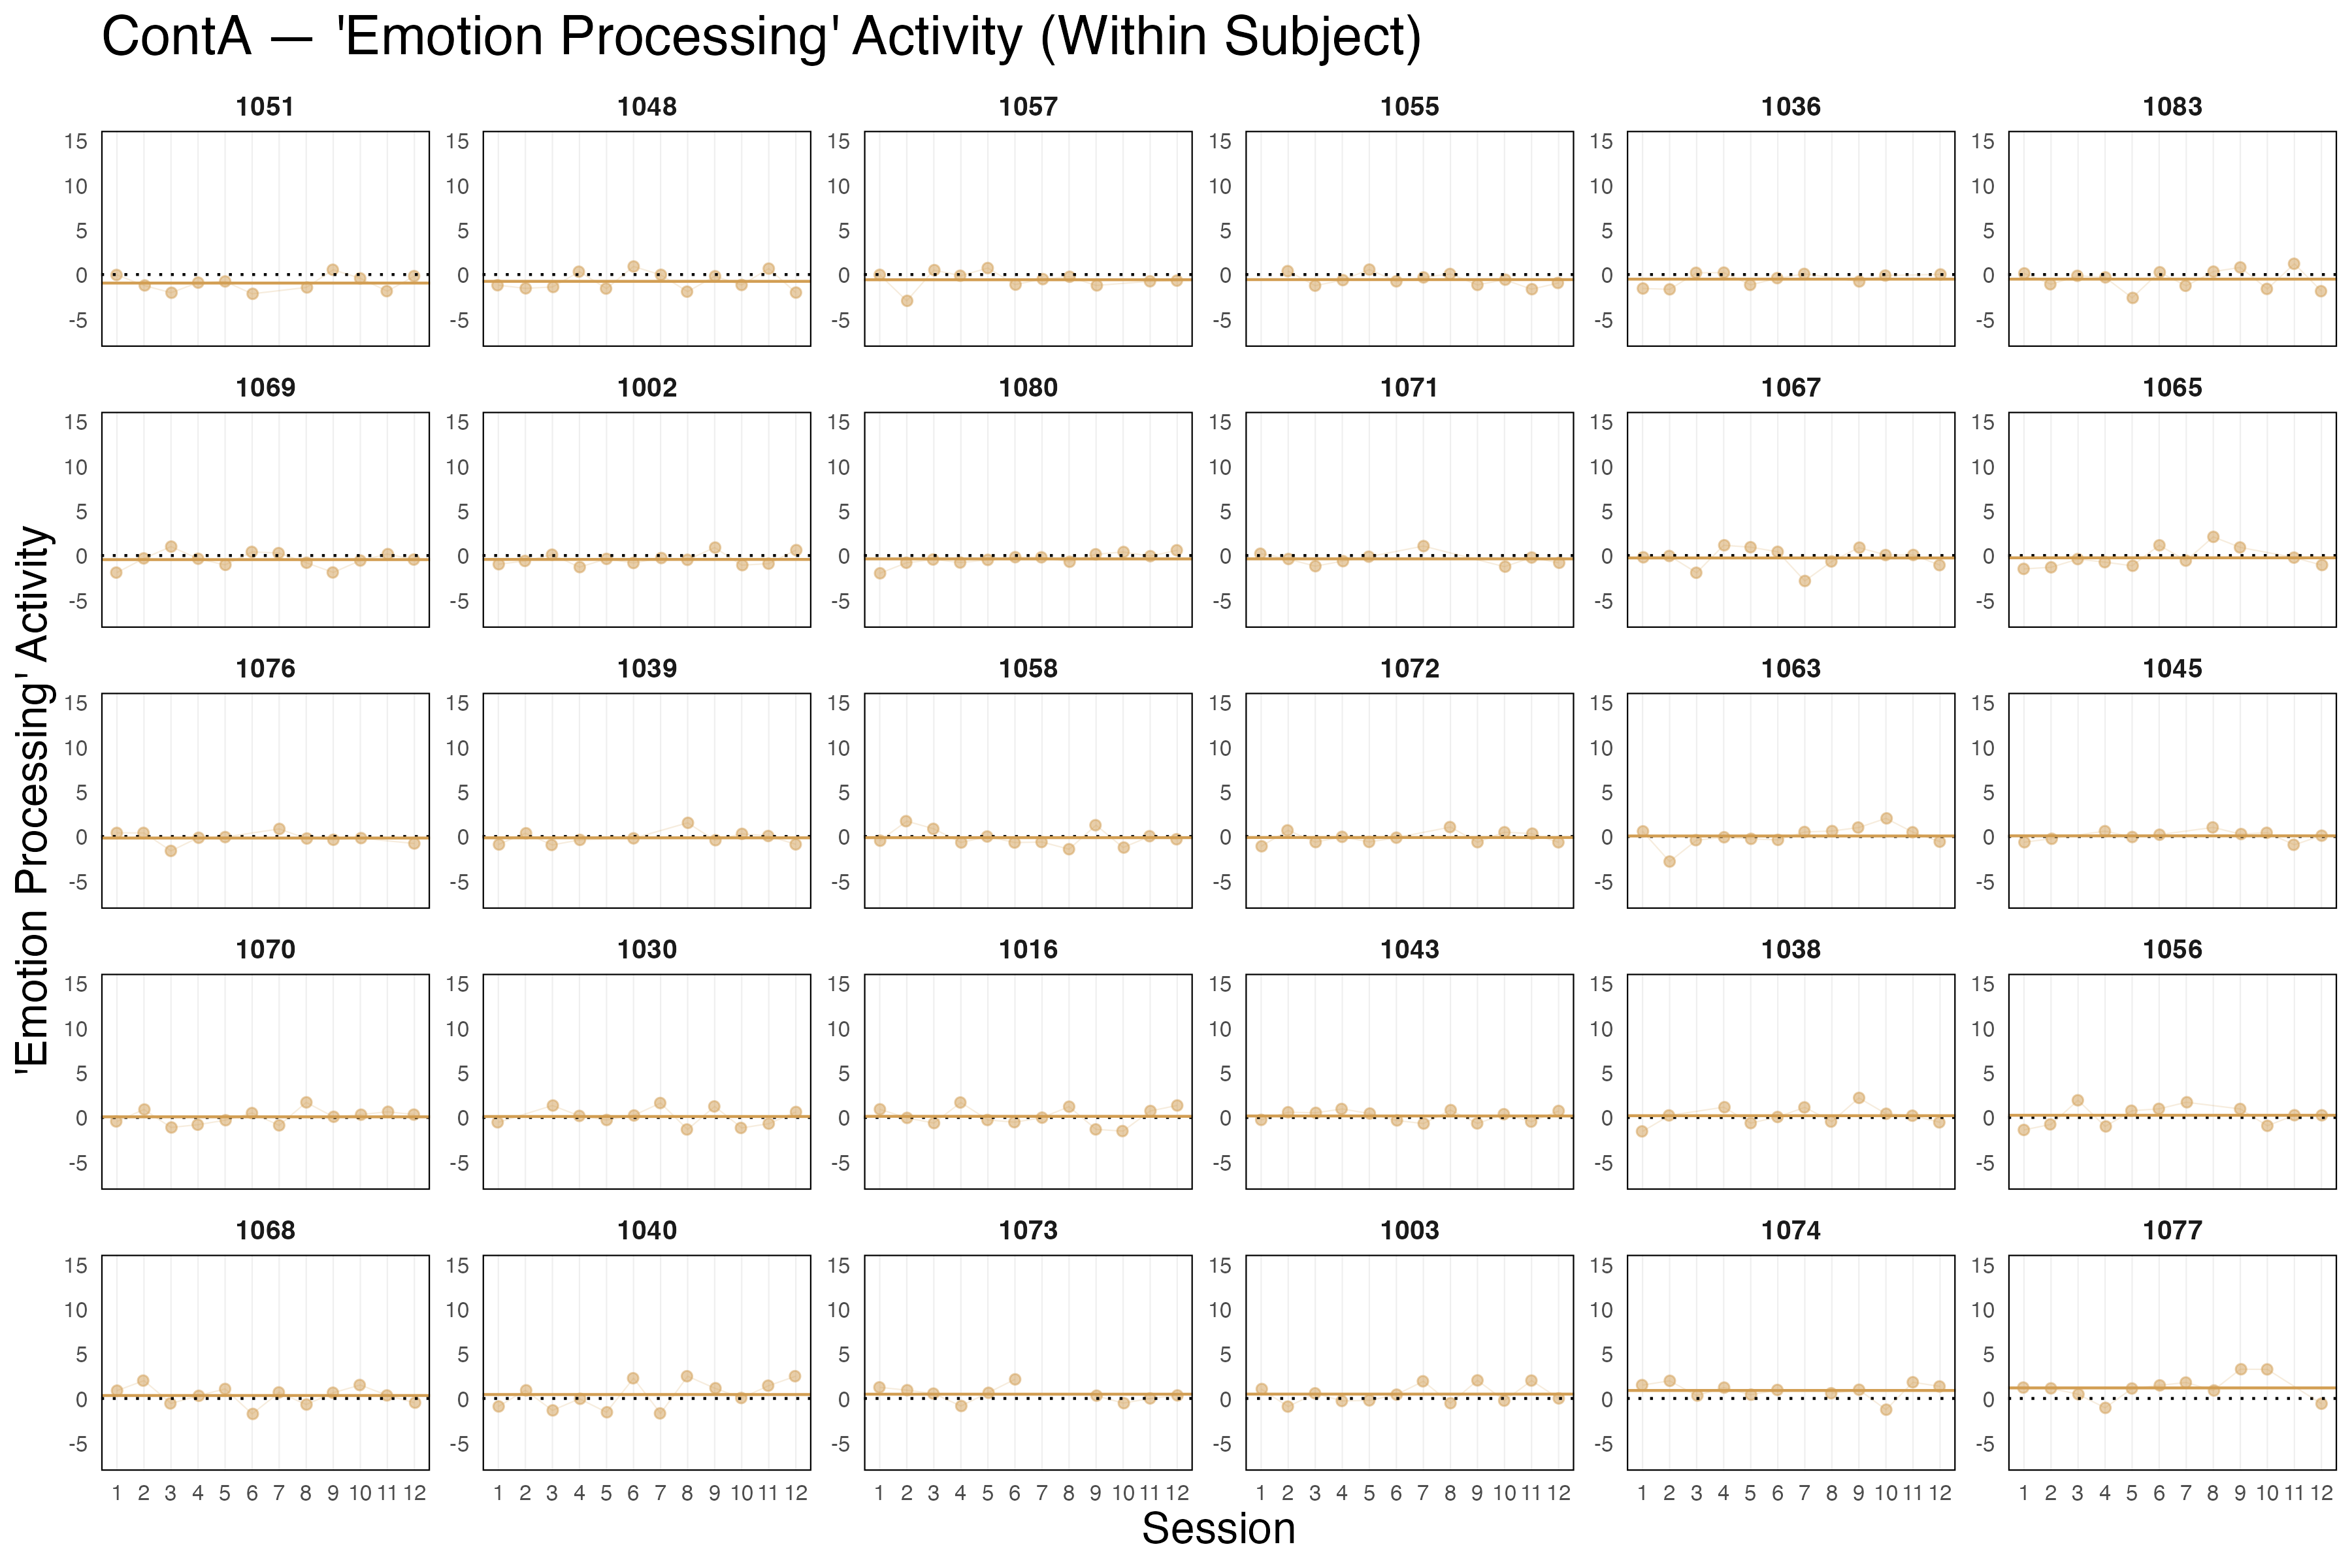
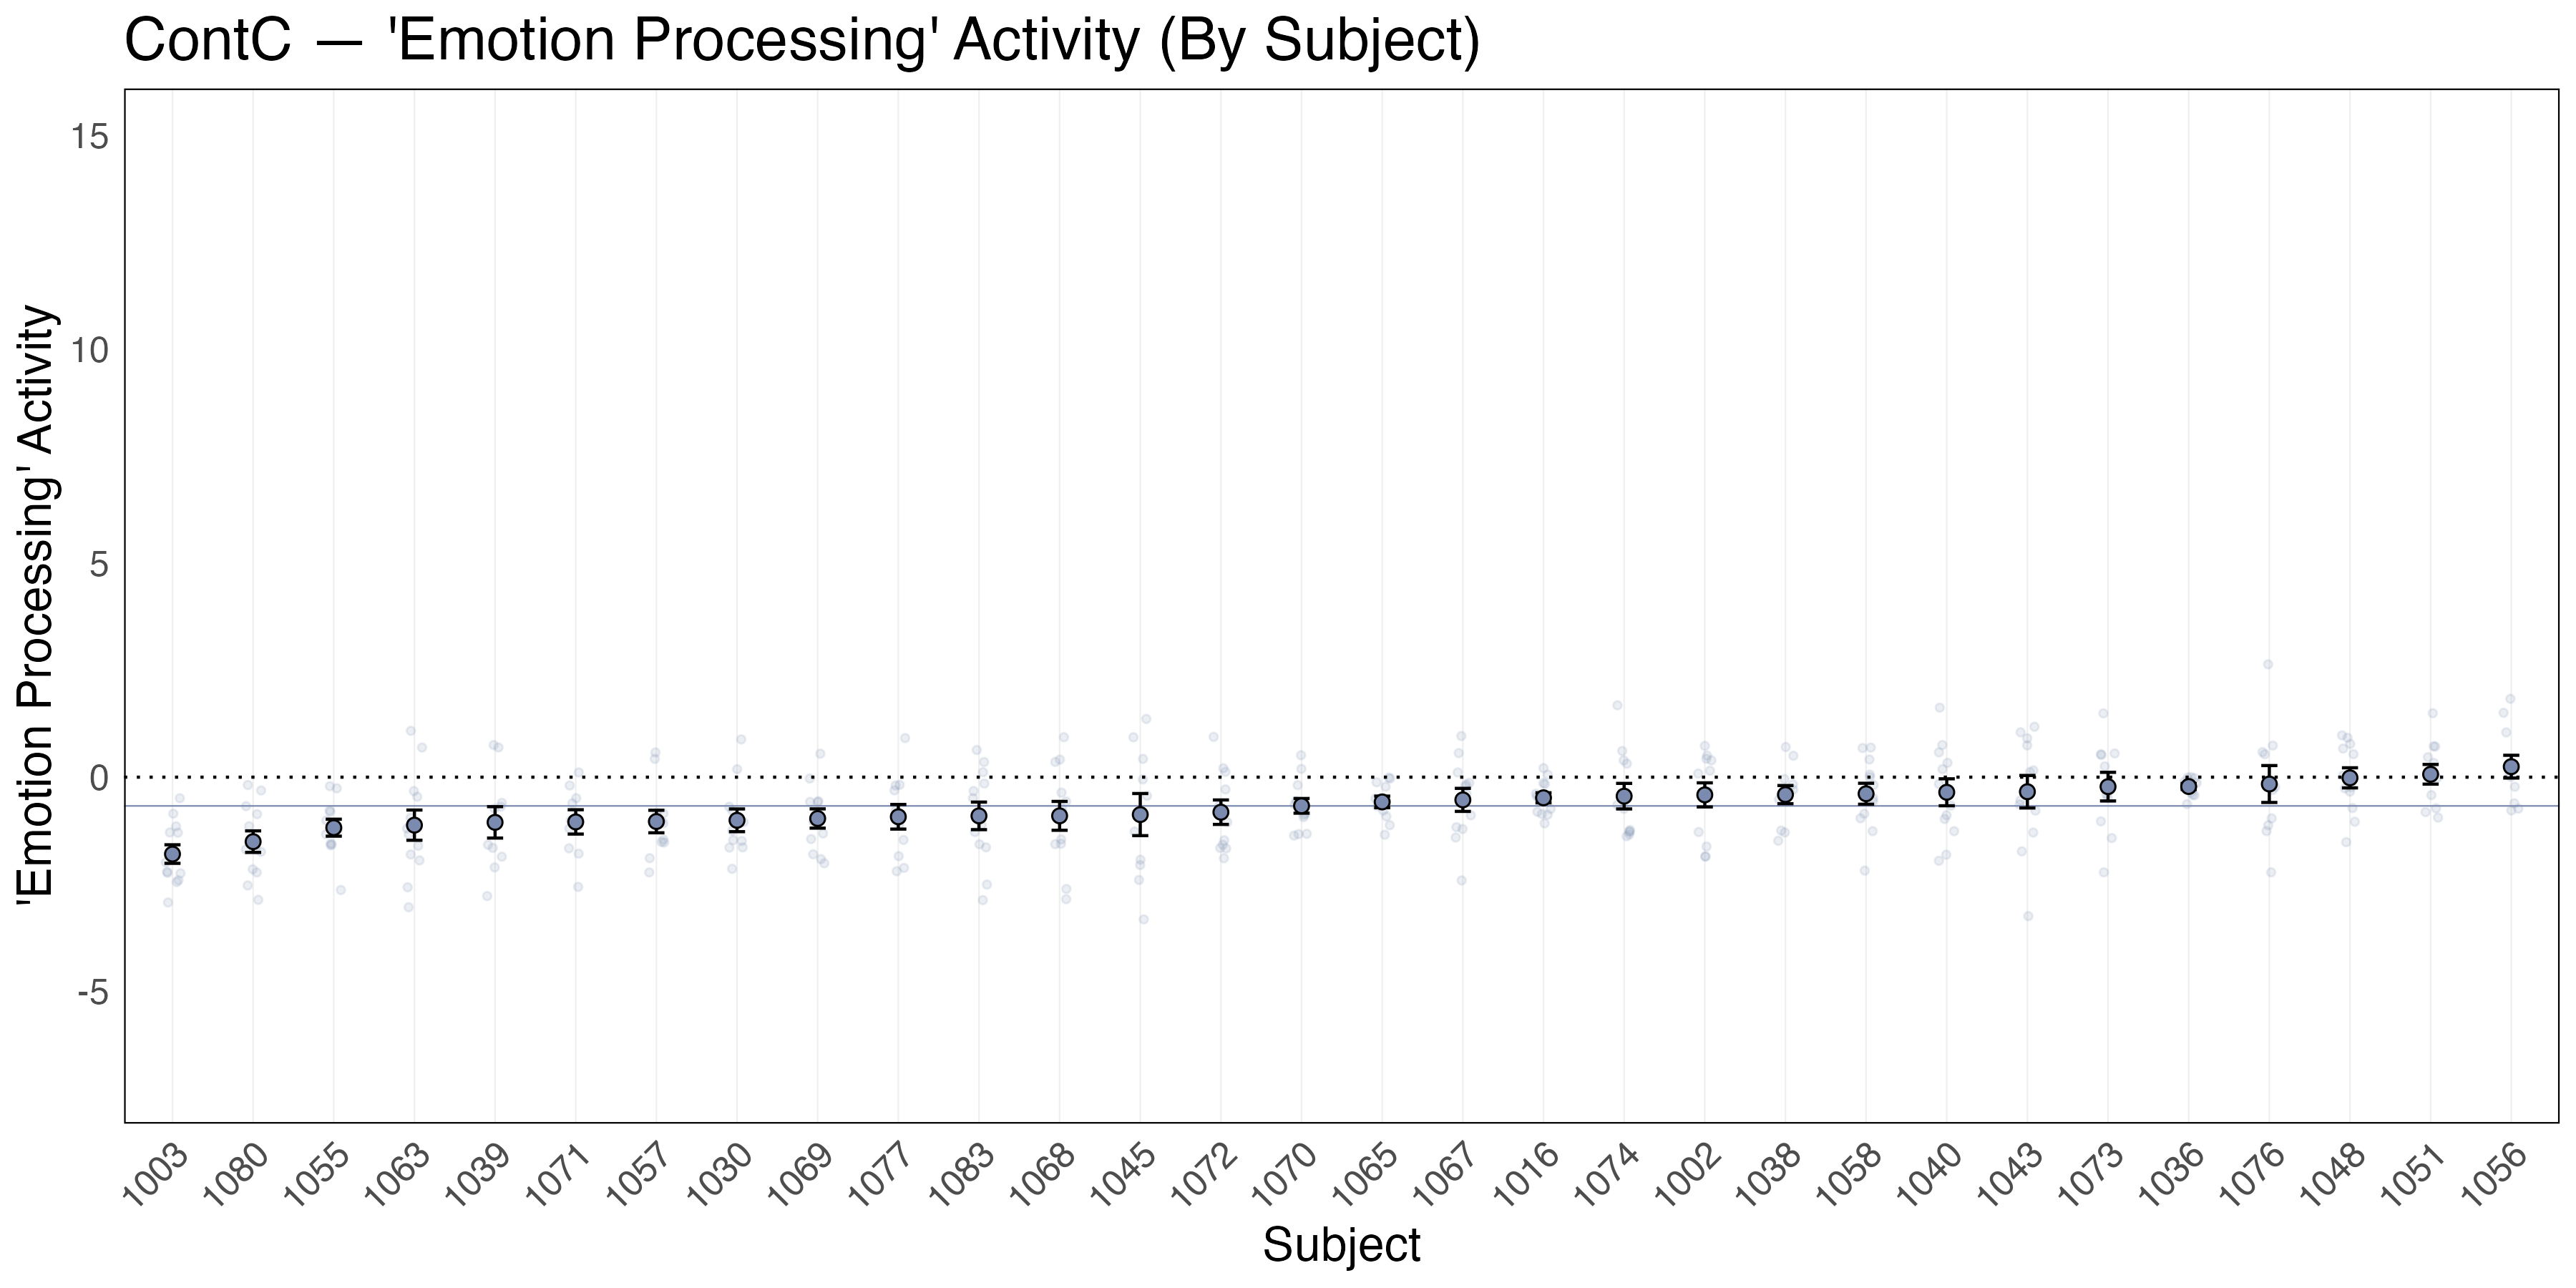
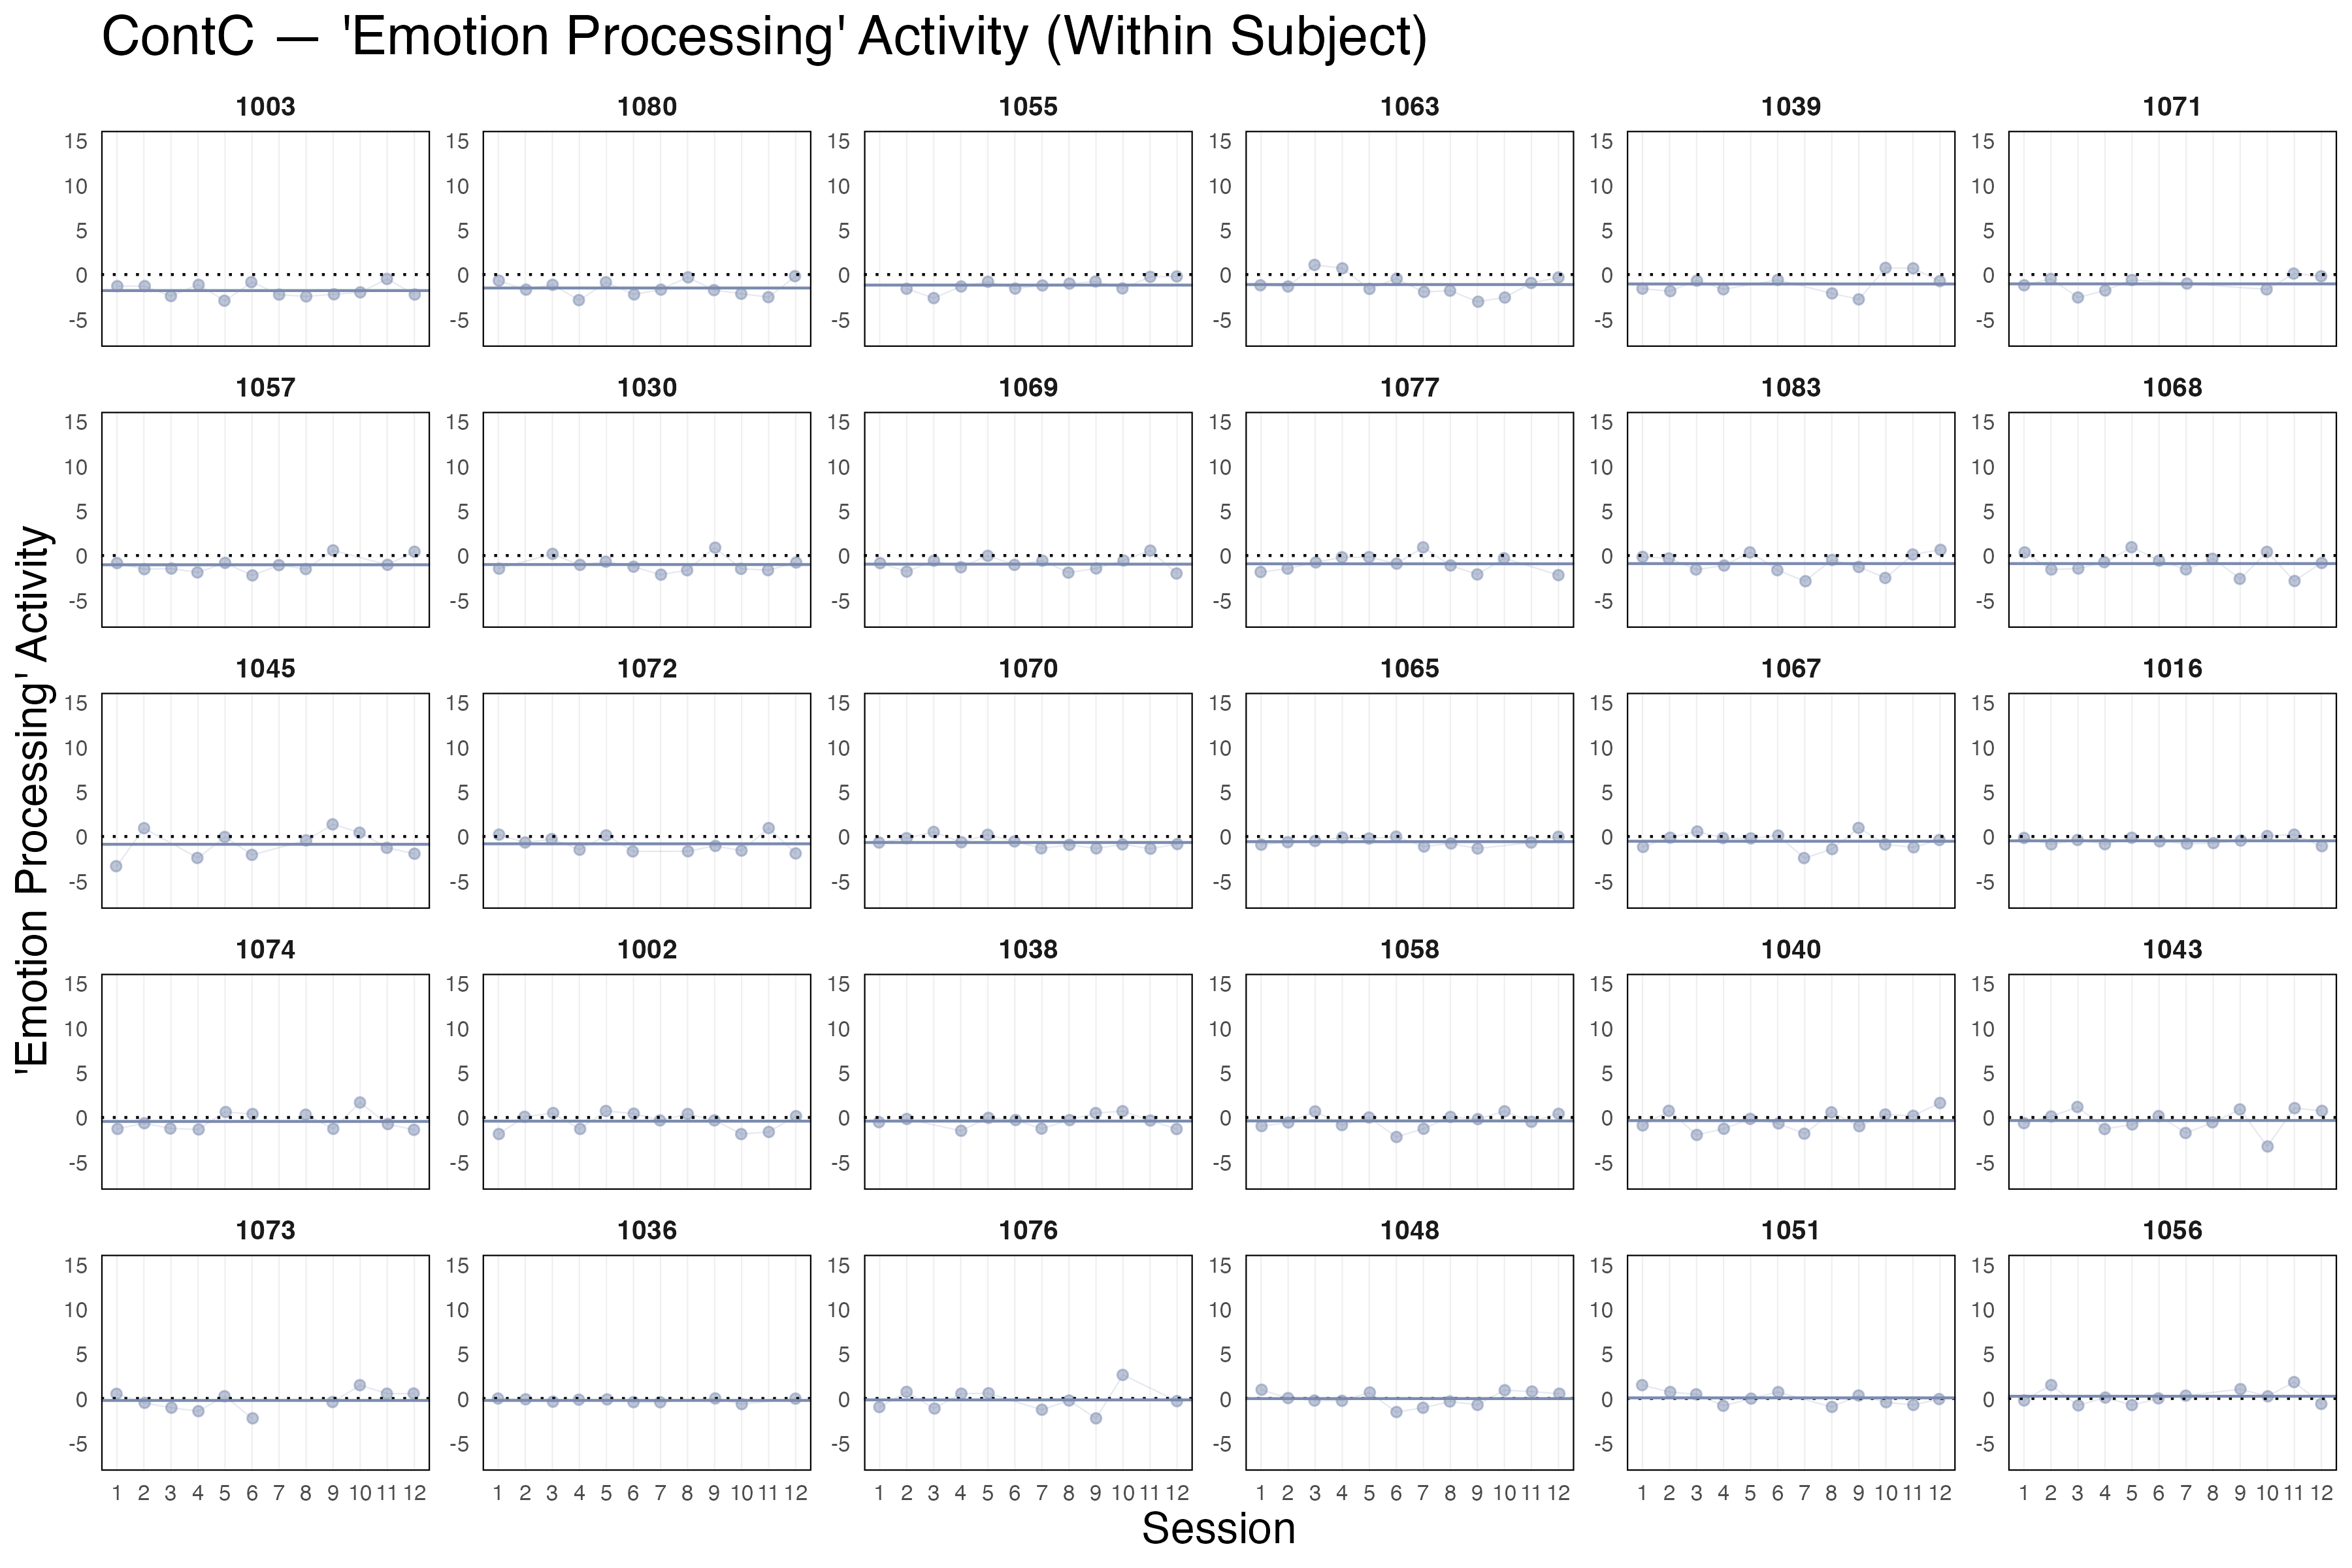
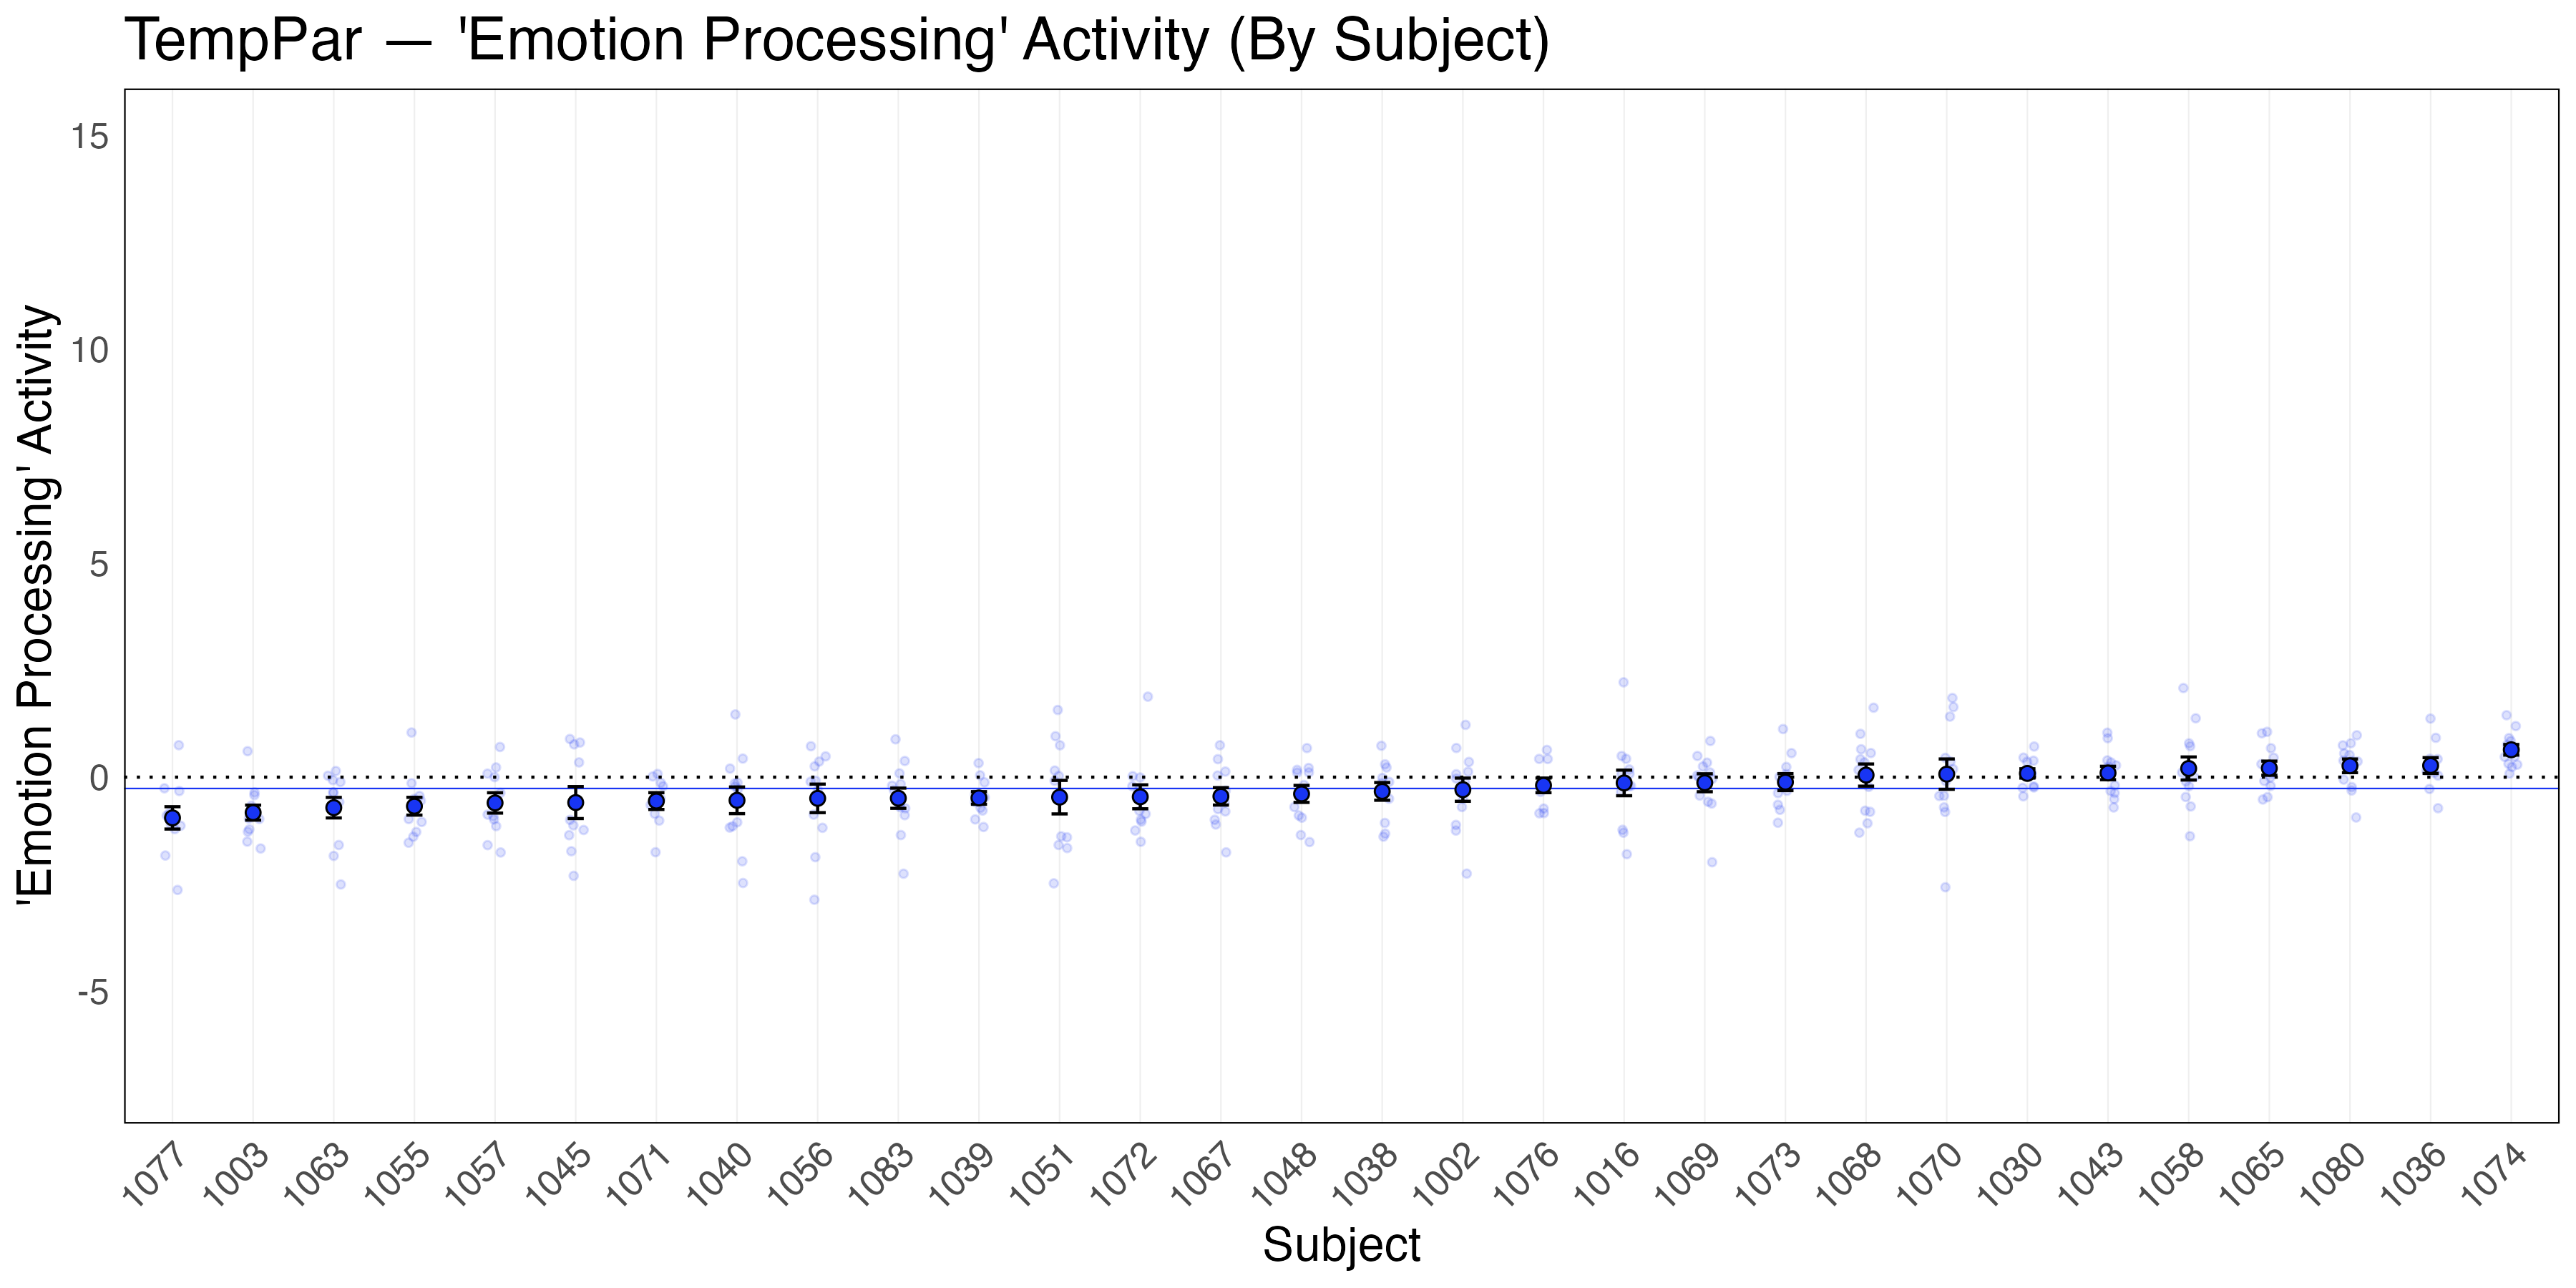
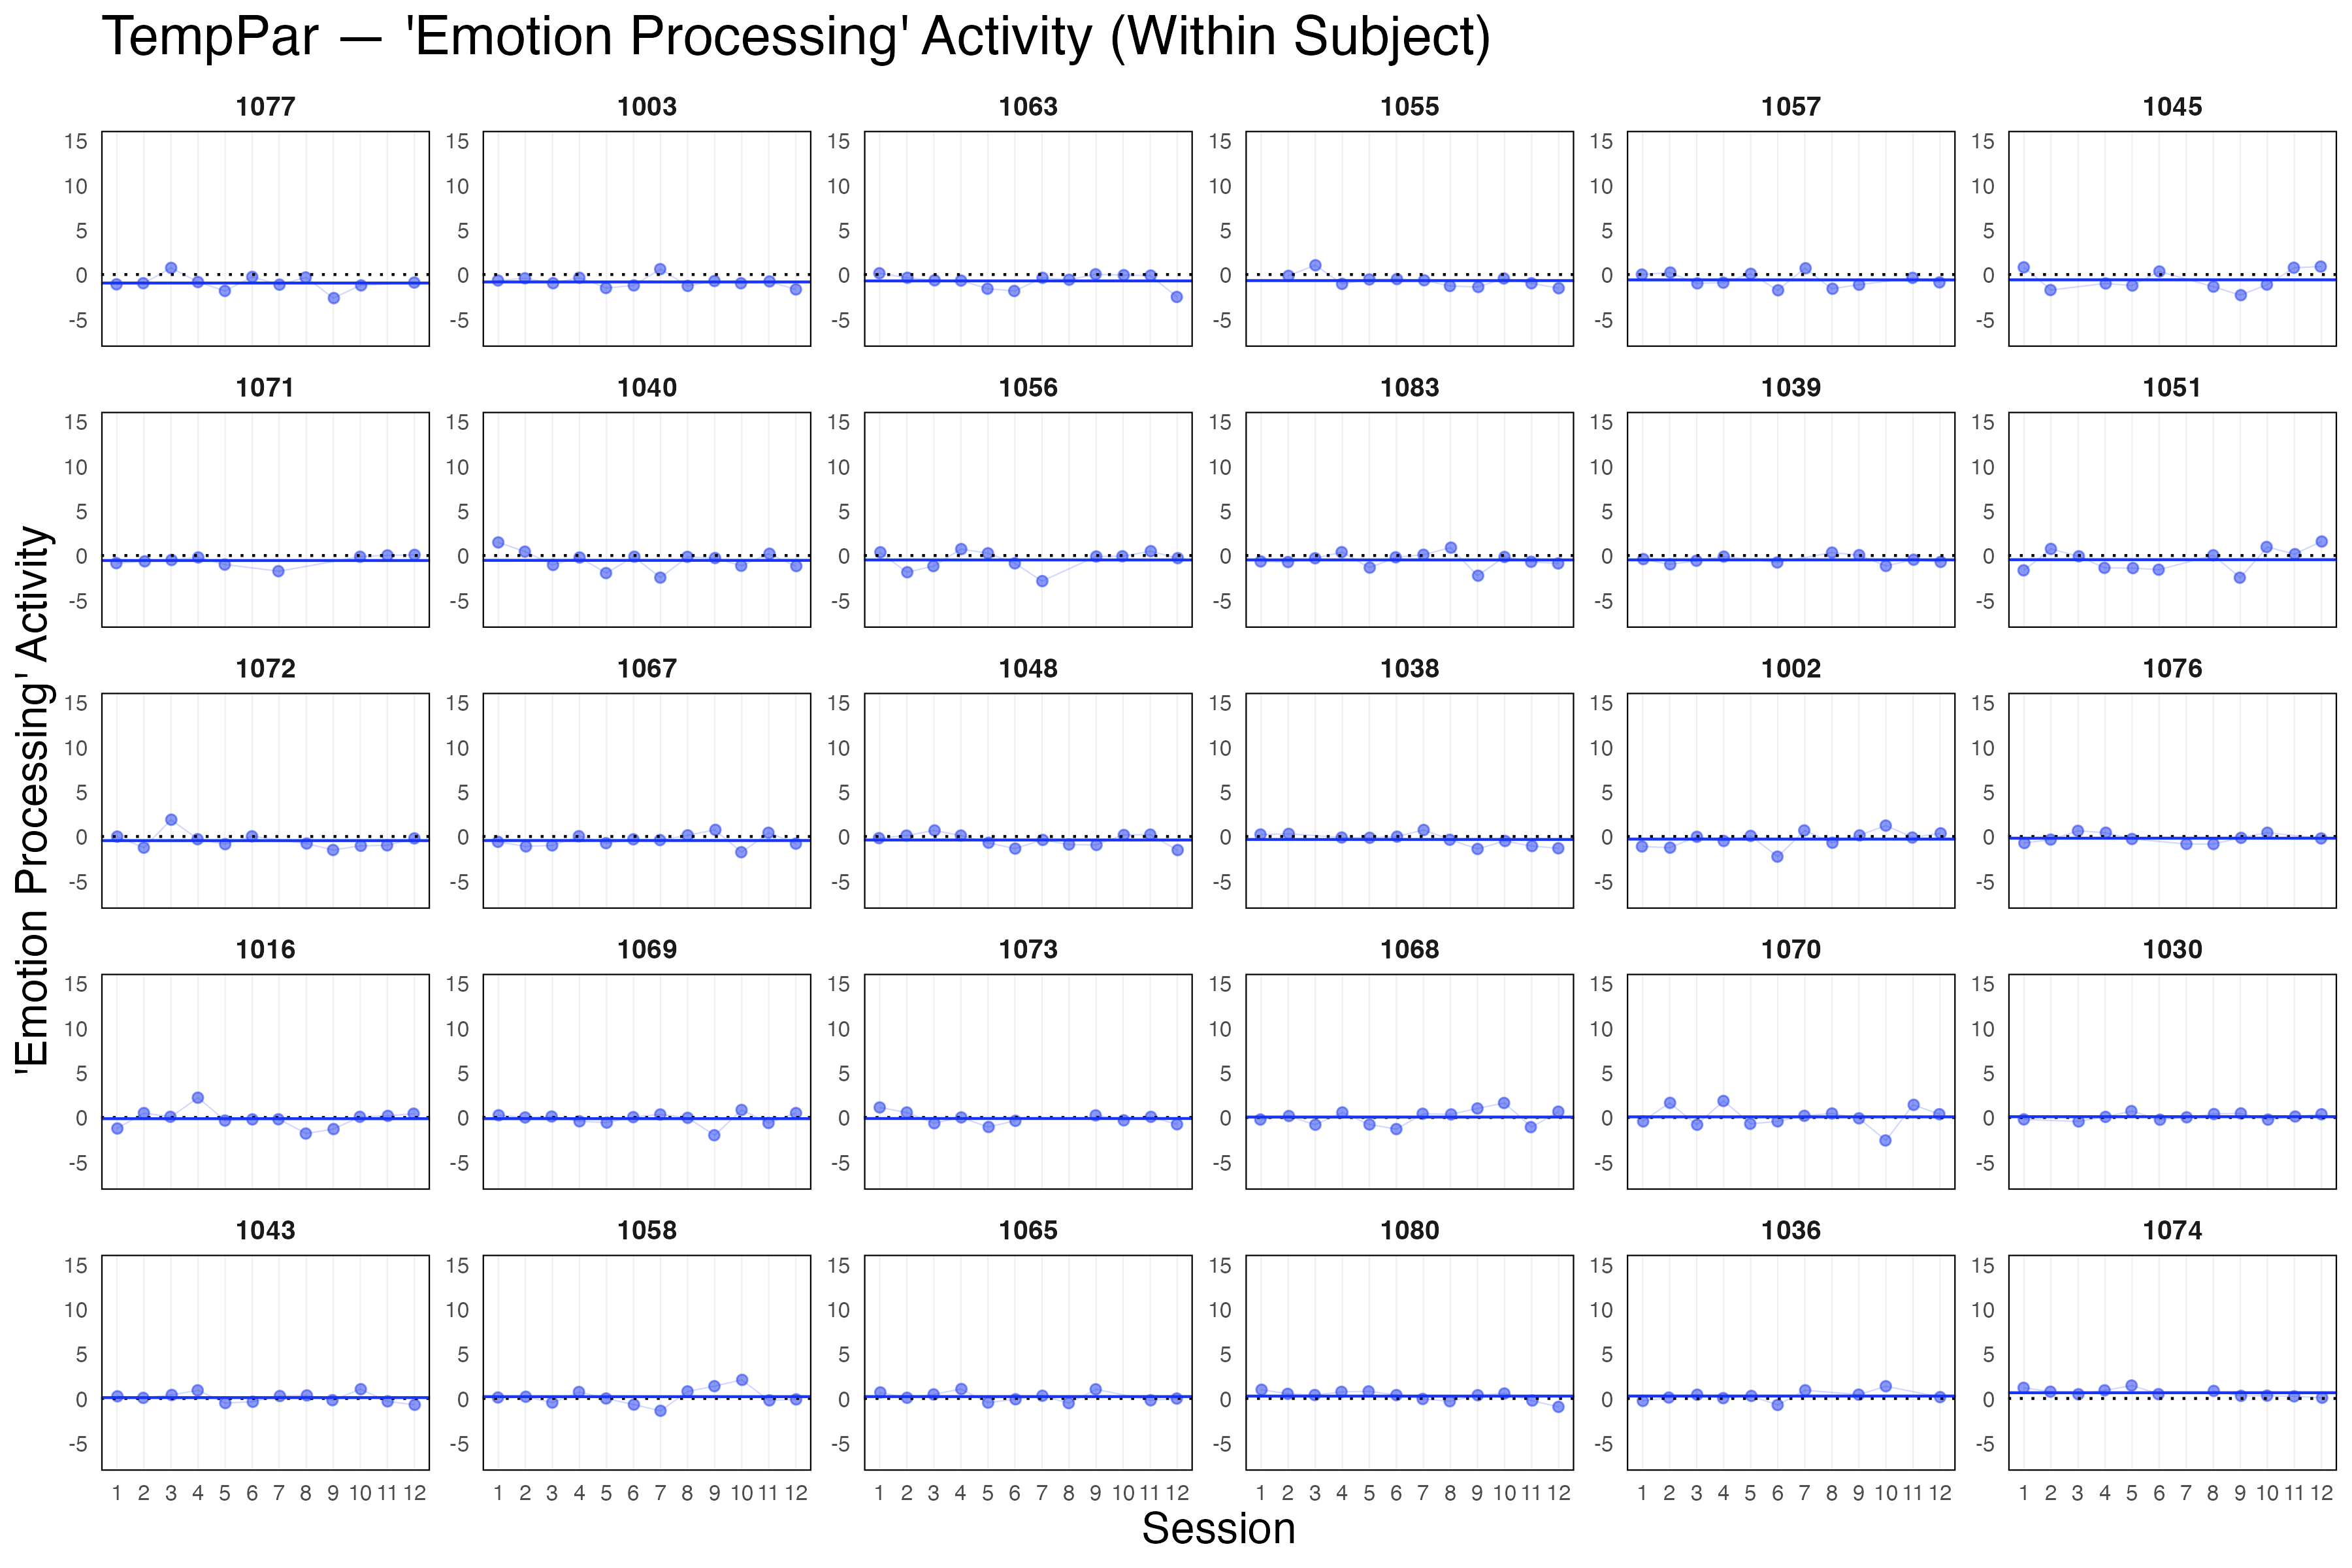
Variability Plots — Observations.
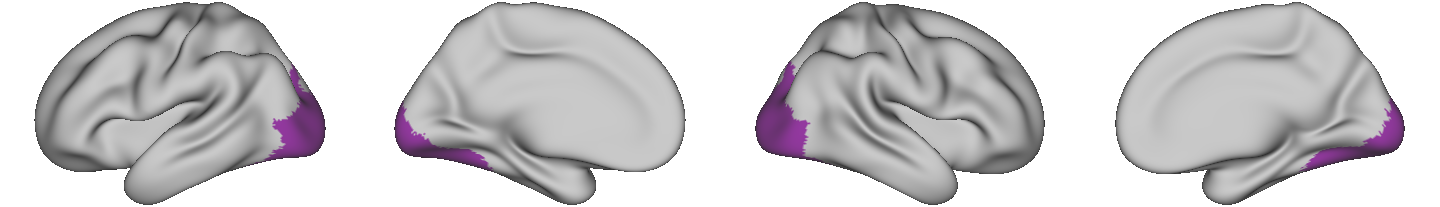
Amygdala. By reviewing the between-subject plots, we can see that the within-subject variability in ‘emotion processing’ activity in the amygdala (the transparent points) is as large or larger than the between-subject variability.
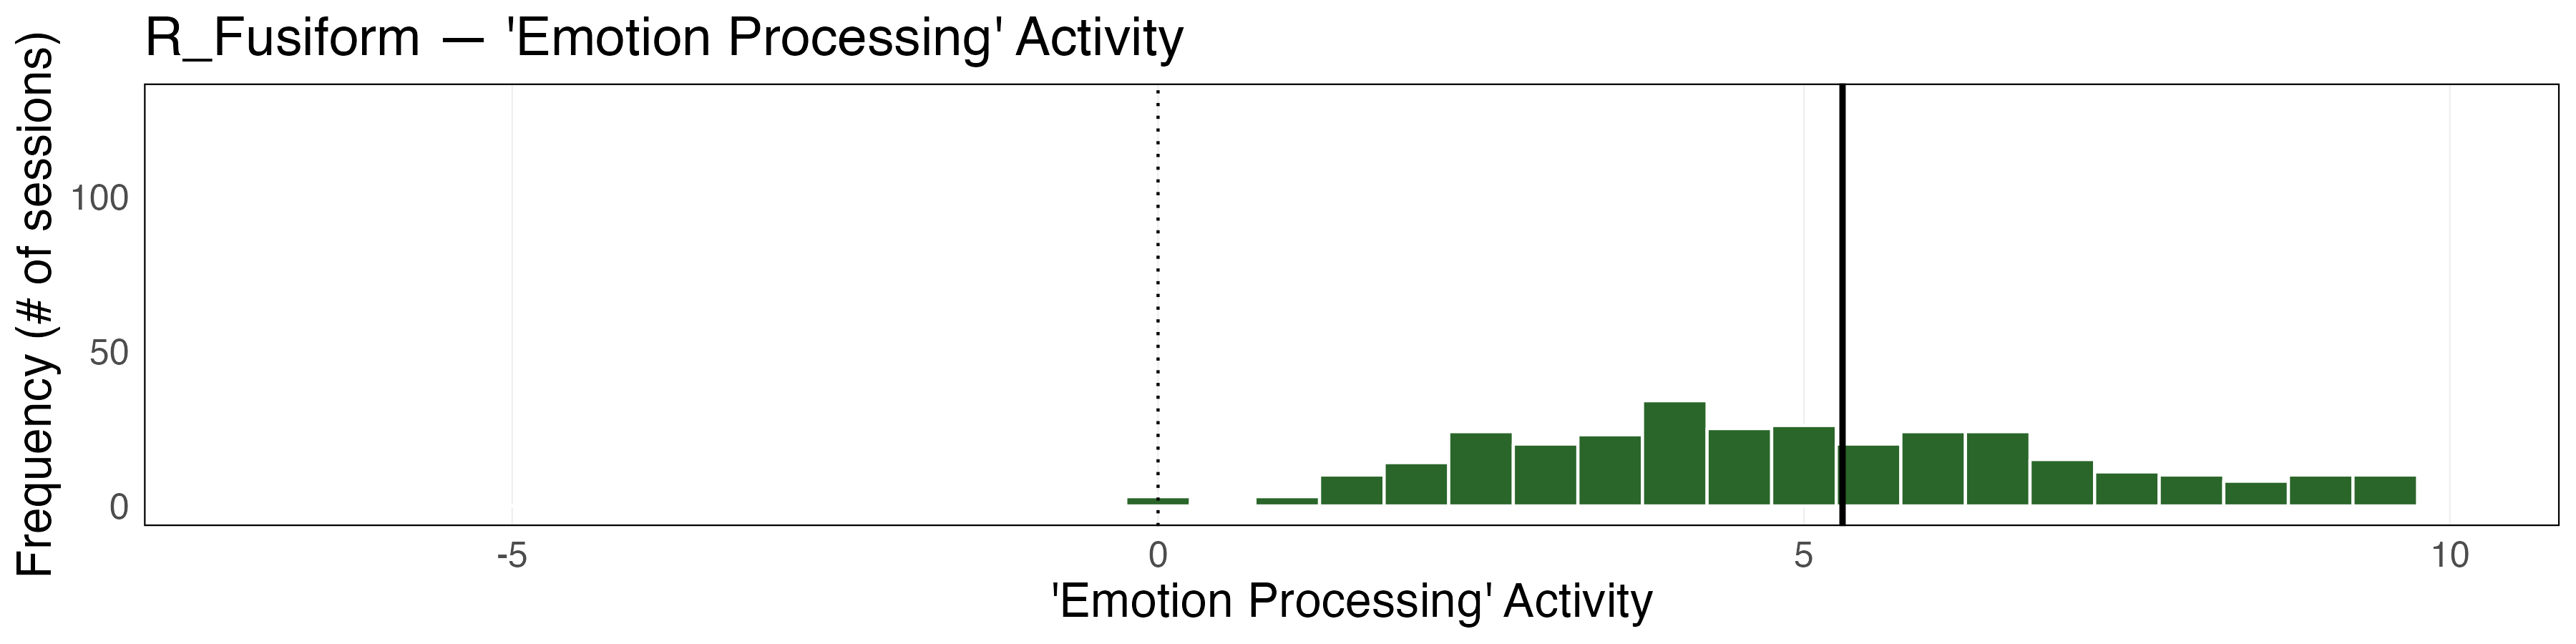
Right Fusiform. The between-subject plot for the right fusiform illustrates the high degree of between-subject variability of in ‘emotion processing’ activity observed. While subjects on average show increases in right fusifom during ‘emotion processing’, the extent to which subjects show this effect varies notably. Interestingly, while there is a notable between-subject variability, there is also notable within-person variability, suggesting that not all the variability in activity within this region is driven by between-subject differences — there is also notable within-person variability across the sessions.
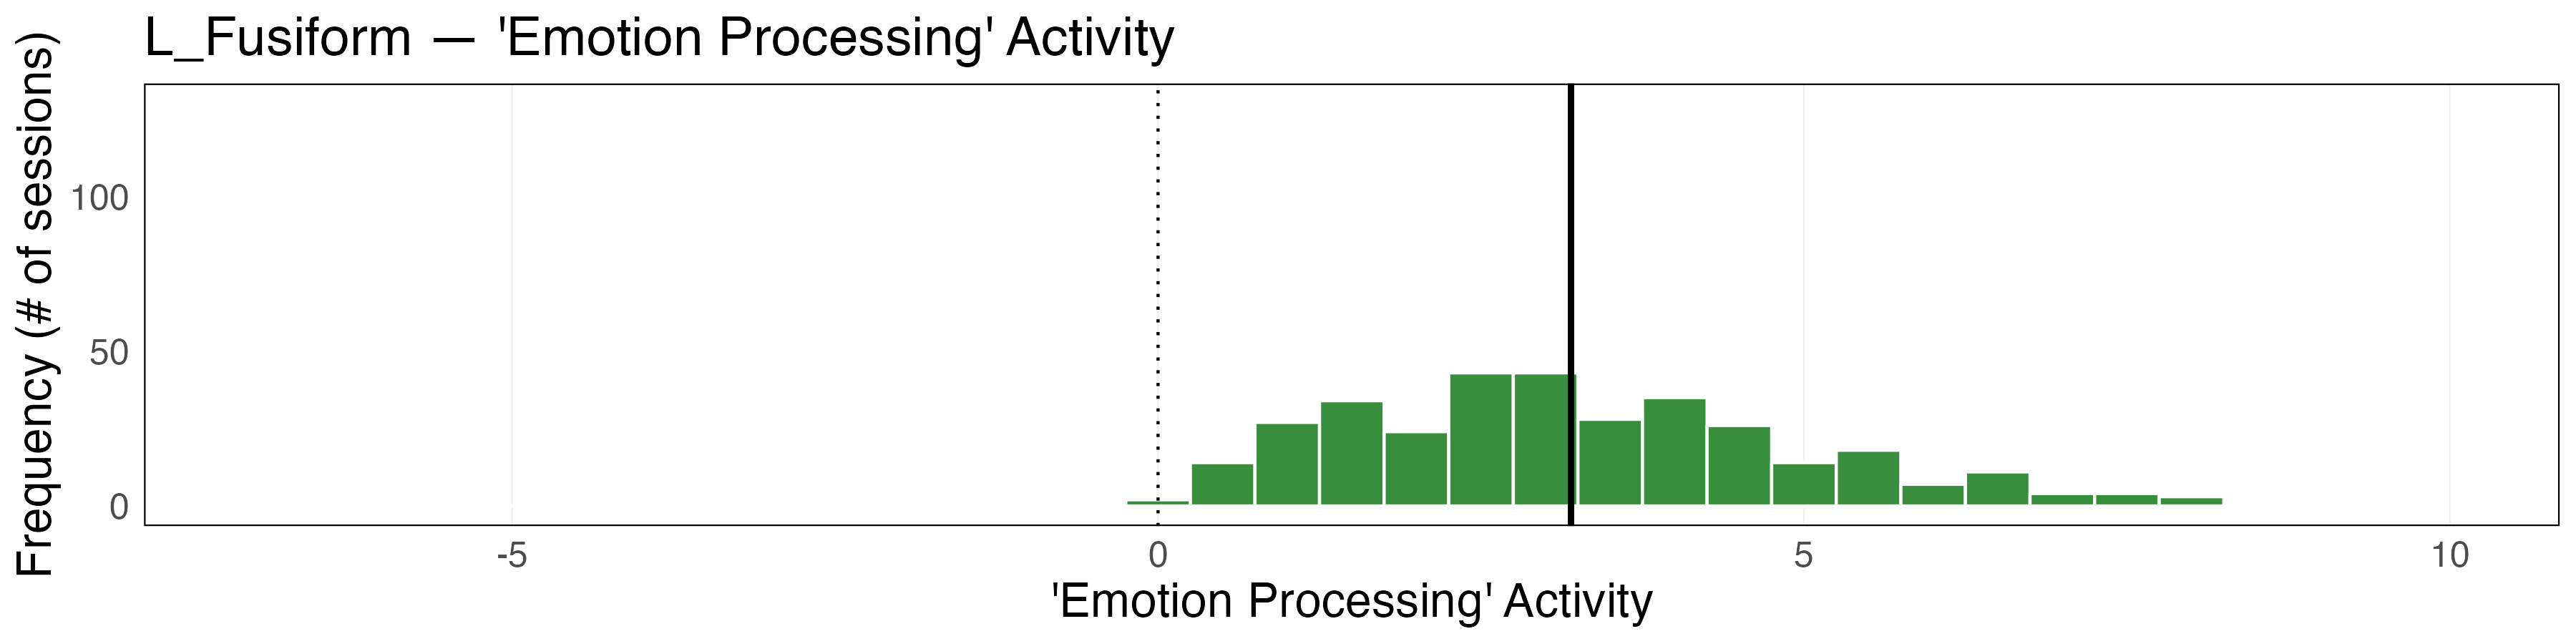
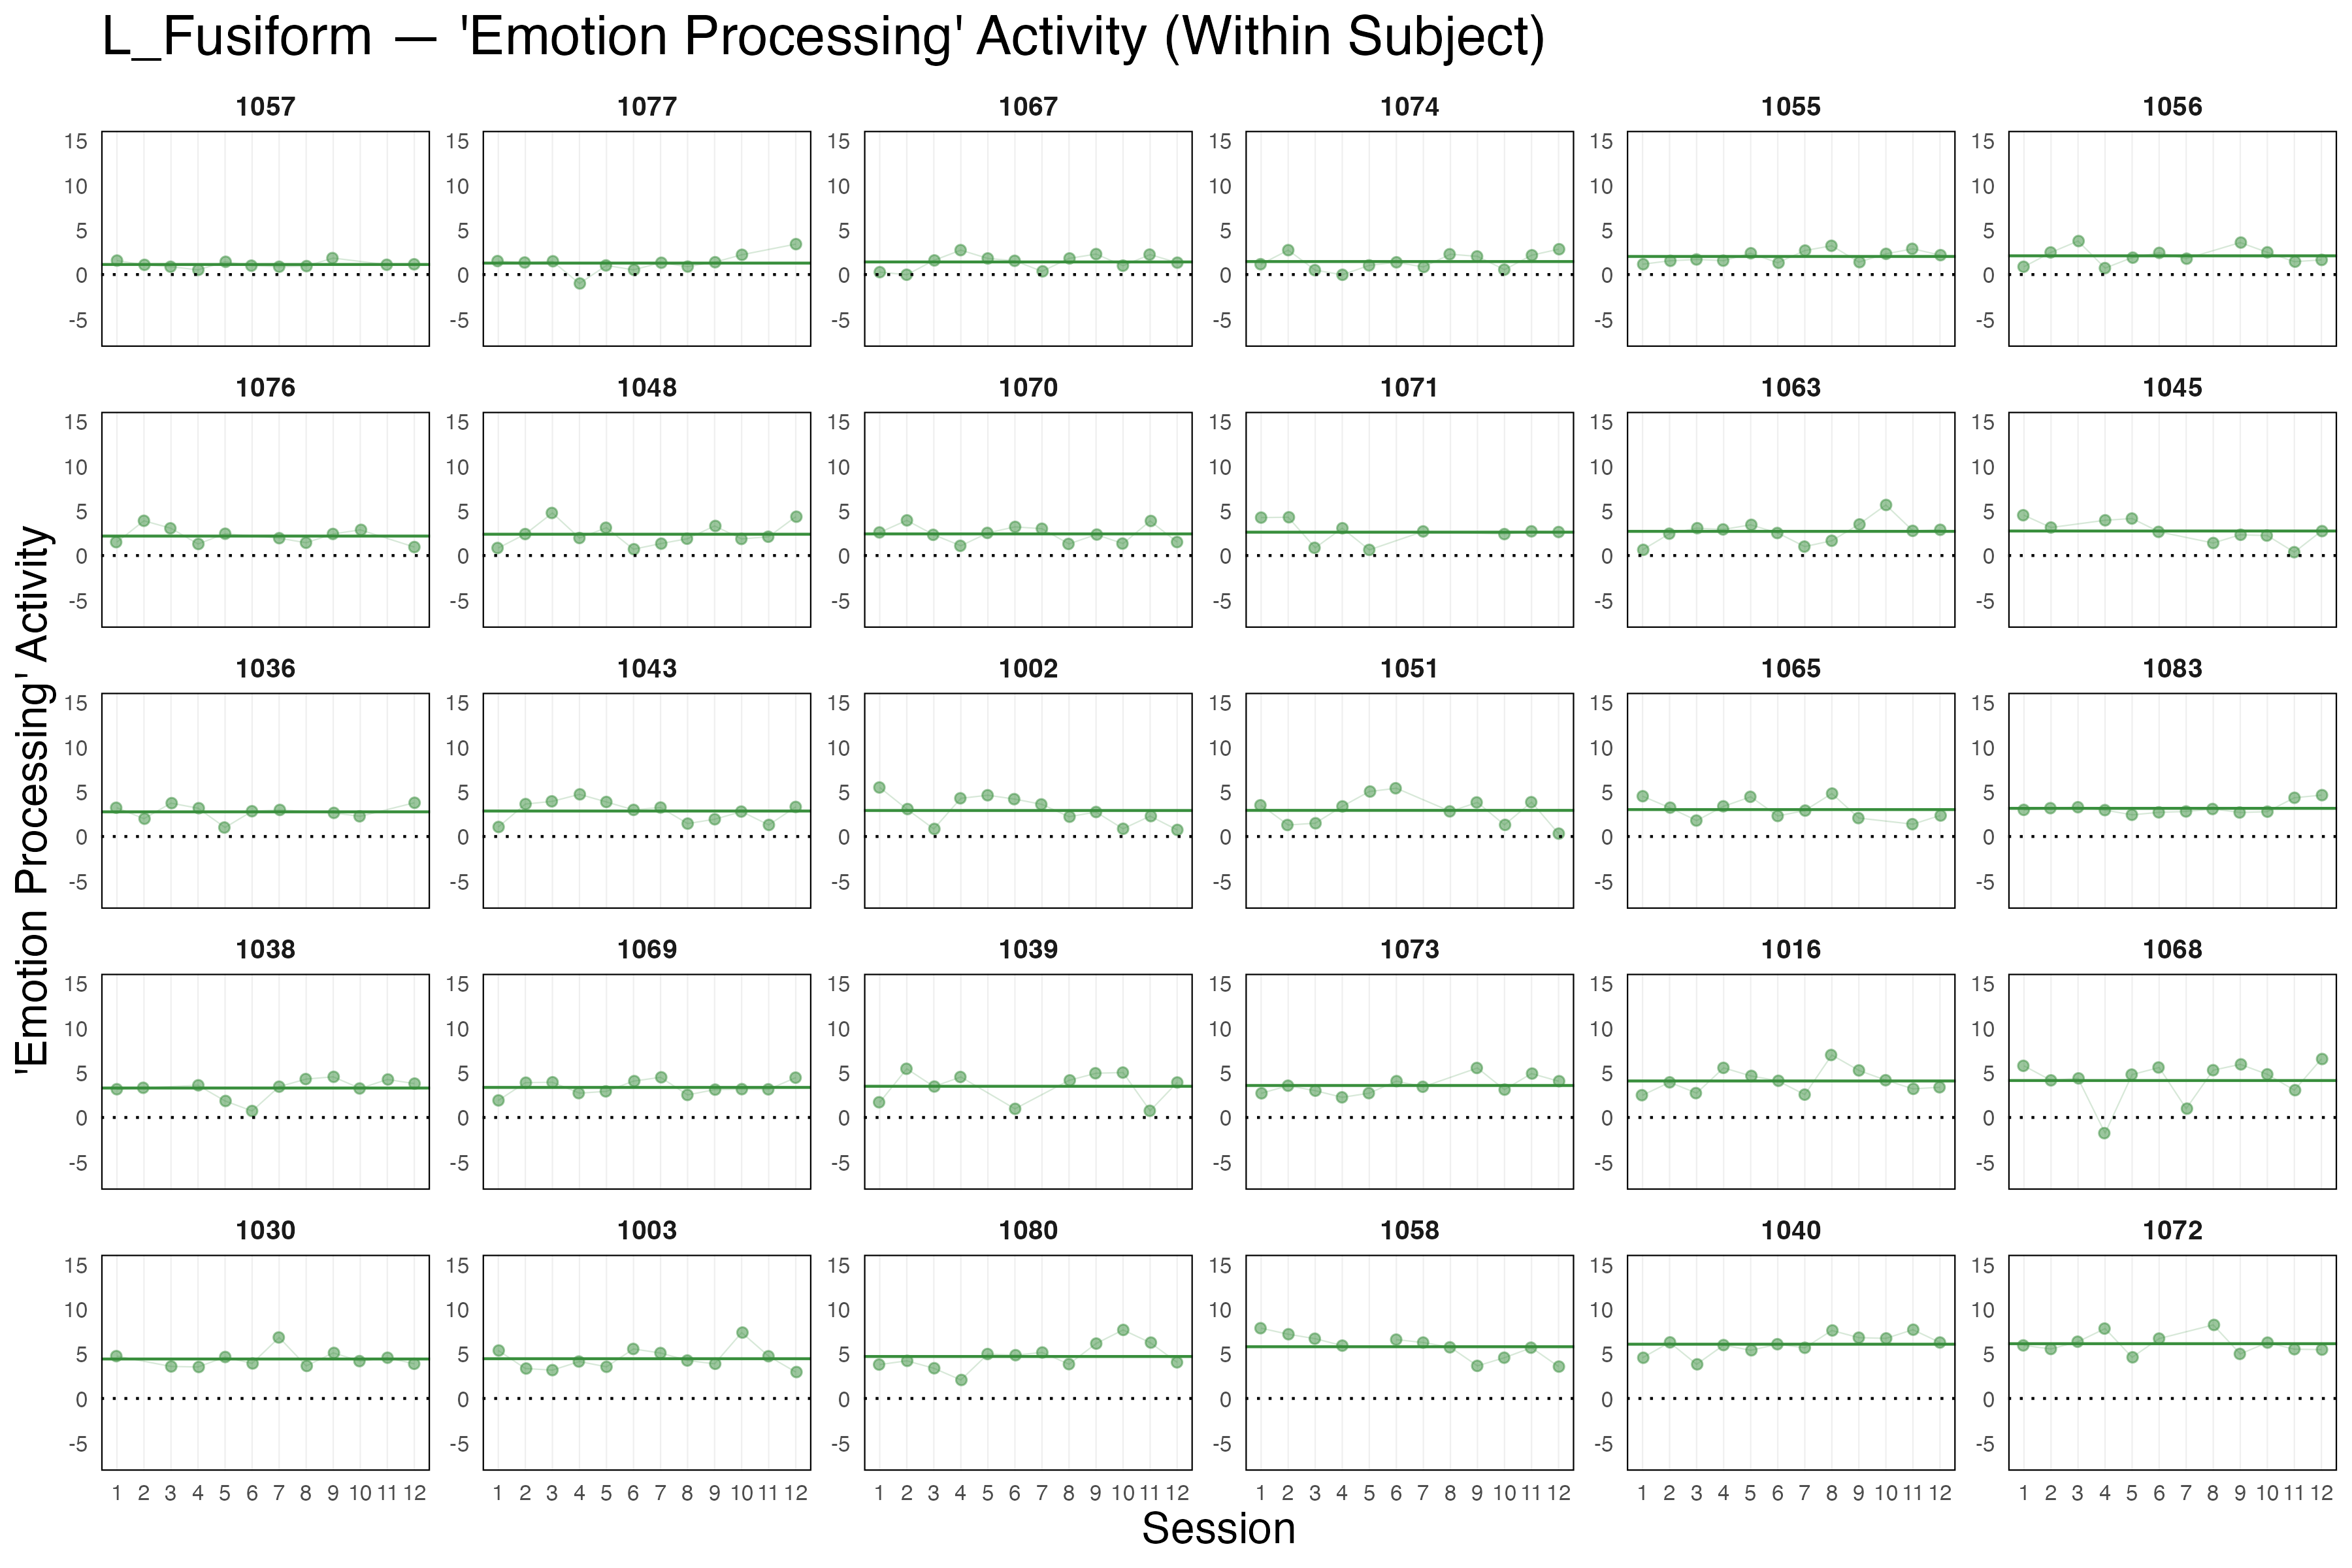
Left Fusiform. The left fusiform shows a similar pattern of between-subject variability as the right fusiform, though exhibits slightly lower ‘emotion processing’ activity in general.
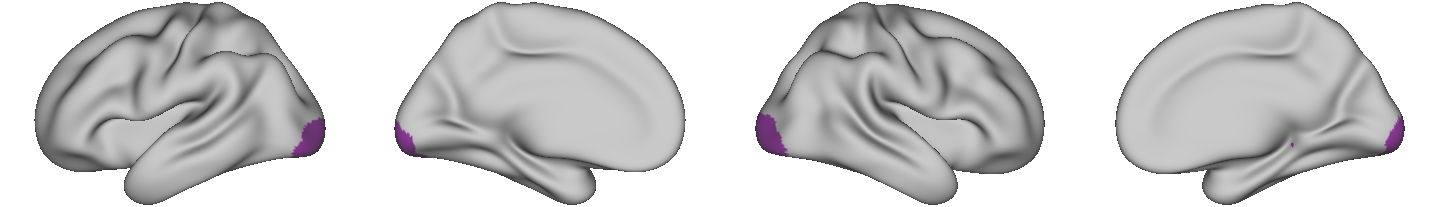
Visual-Central Network. While there is a similar level of between-subject difference in the visual-central network (VIS-C) as compared to that observed in the right and left fusiform, there is higher within-subject variance. Higher within-subject variance is leading to a reduced ICC value for activity within VIS-C relative to the ICC seen in the fusiform.
Dorsal Attention Network B. There is limited between-subject variability within dorsal attention network B (dATN-B). These between-subject variability plots illustrate that there is almost as much within-subject variability as there is between subject — making it clear why the ICC for activity within this network is poor.
Page in Review:
I did not find evidence of improved test-retest reliability of activity within the individualized networks, as compared to ROIs or networks identified in group averaged data. However, for the purposes of this project we will continue to explore the individualized networks in the context of individual differences in emotion processing, as well as within-person fluctuations. In the following analysis I will examine the association of activity in individualized networks with experiences of stress and psychopathology between-subjects and within-individuals over time.