The Boundaries
For full methodological details of fMRI data preprocessing please click here.
Here the boundaries used to examine ‘emotion processing’ activity during the emotion task are reviewed: the amygdala, meta-analytic regions of interest, individualized networks, and group-based networks.
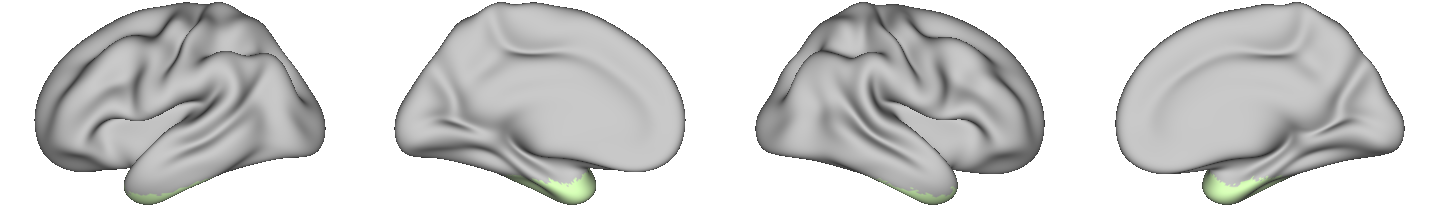
INSERT IMAGE OF amygdala here
The amygdala was defined anatomically based on the Harvard-Oxford Atlas (50% threshold).
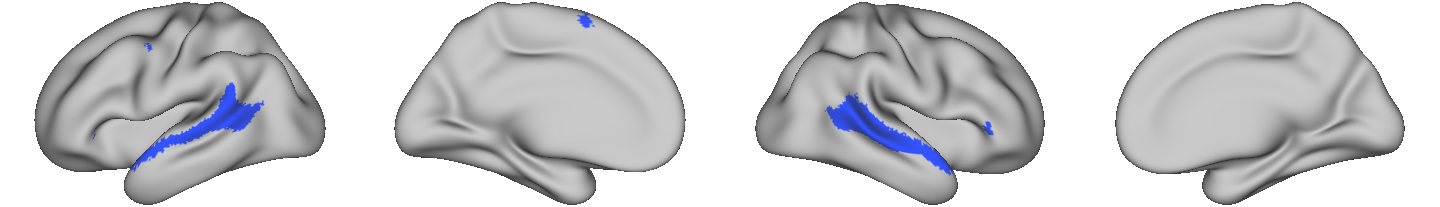
INSERT IMAGE OF ROIs here
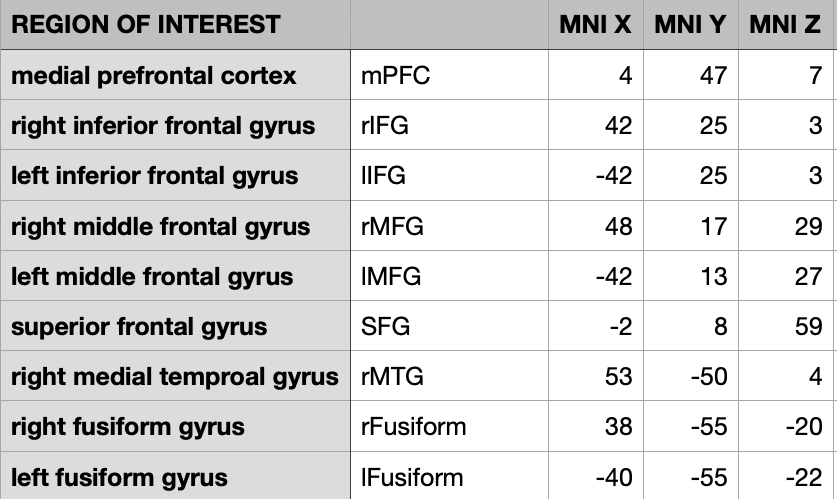
The meta-analytic regions of interest (ROIs) were defined based on anatomically constrained 5mm spheres centered on meta-analytically identified peak activations (Sabatinelli et al., 2011). The Meta-Analytic ROIs included are the medial prefrontal cortex, insula, middle frontal gyrus, inferior frontal gyrus, posterior cingulate, the parietal lobule, medial temporal gyrus, and the fusiform gyrus. See above for the peak coordinates used to define the ROIs.
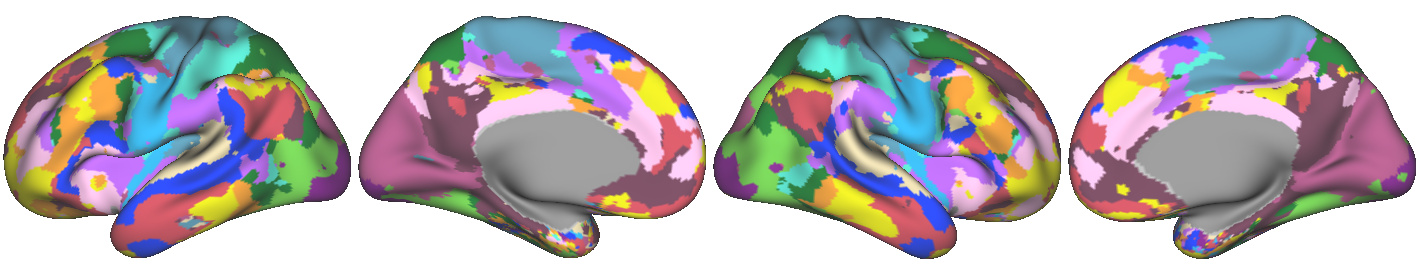
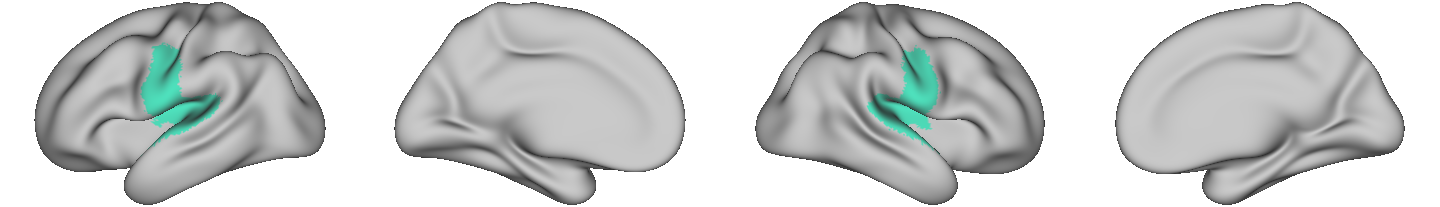
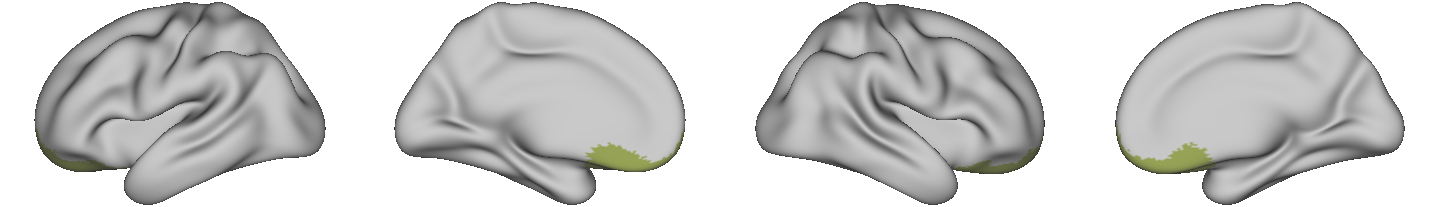
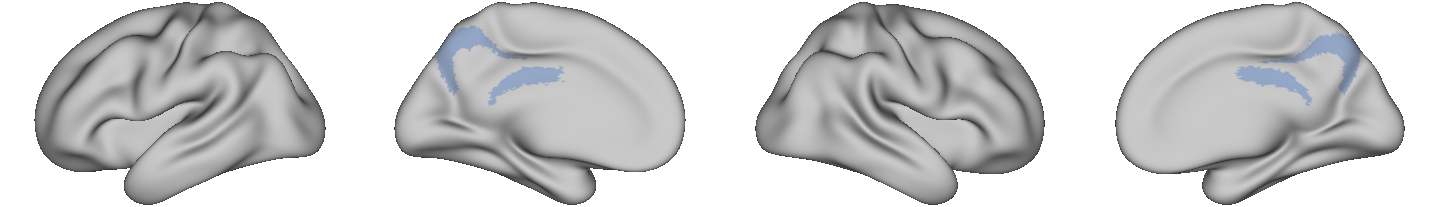
The group average anchor (aka. “prior”):
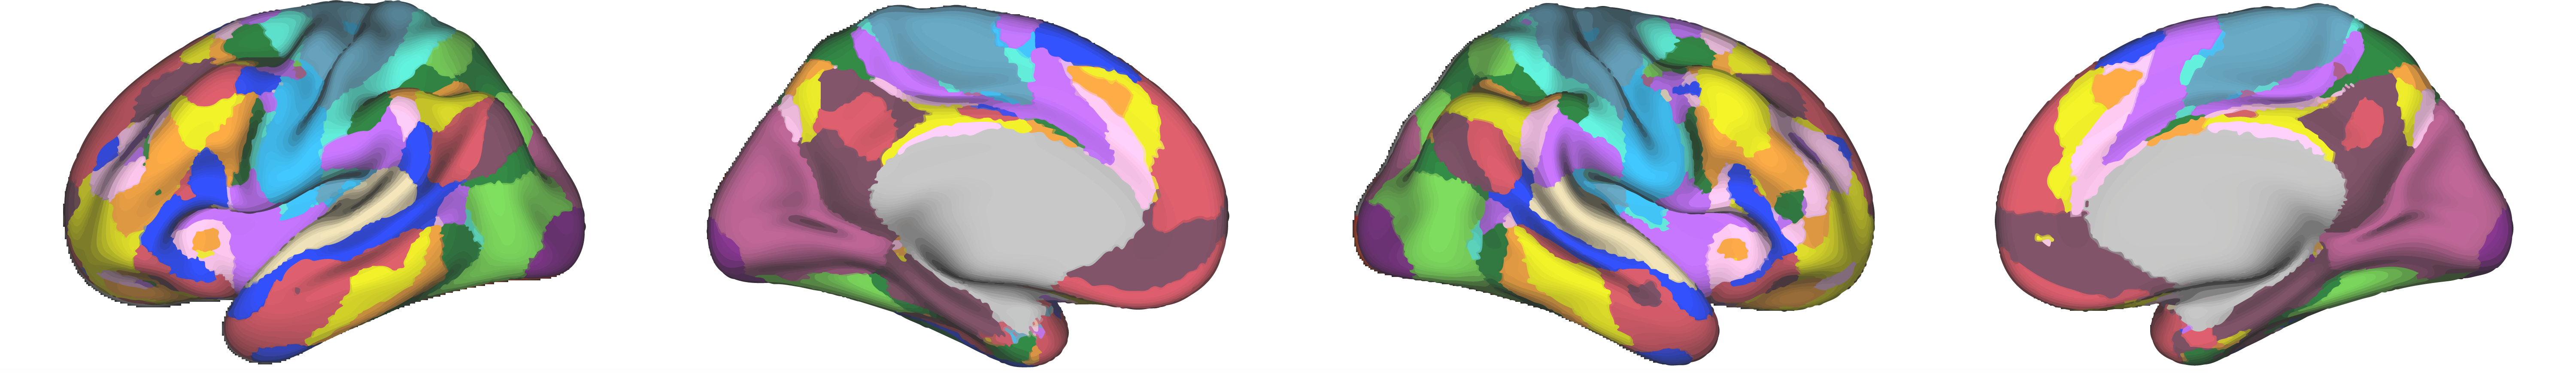
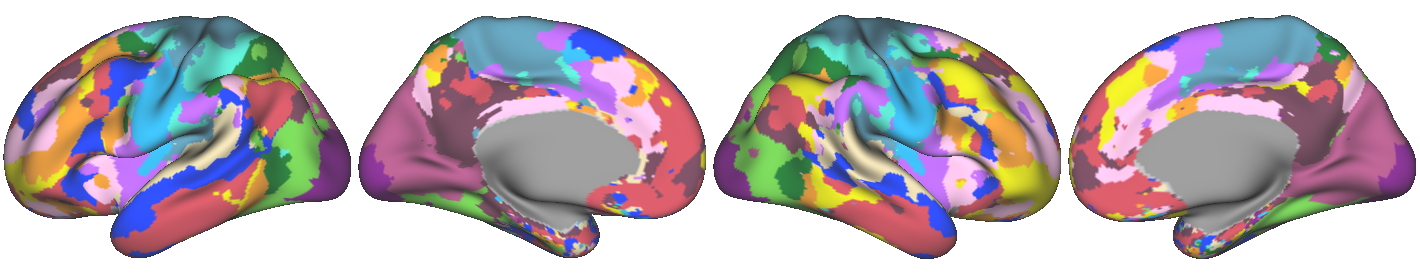
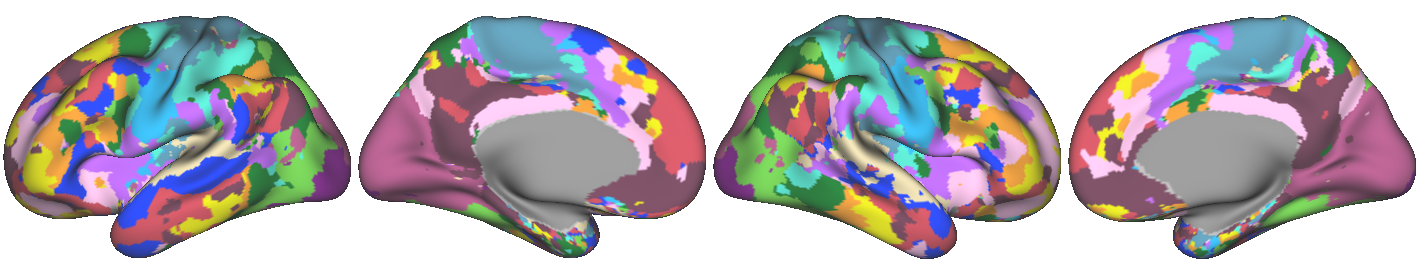
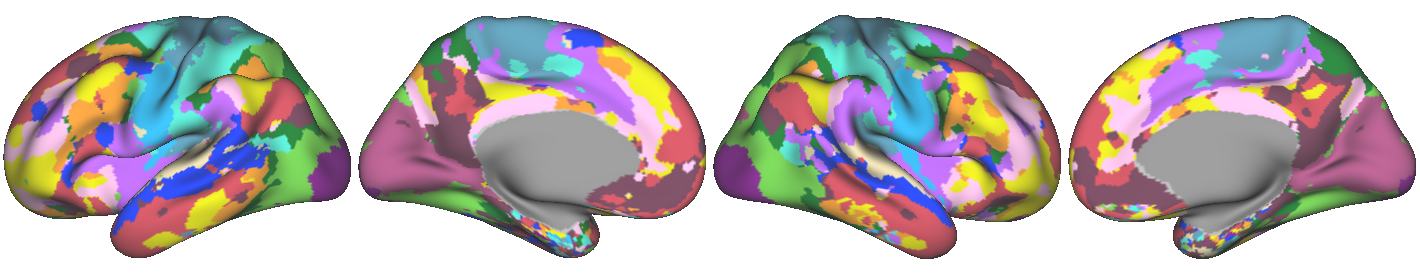
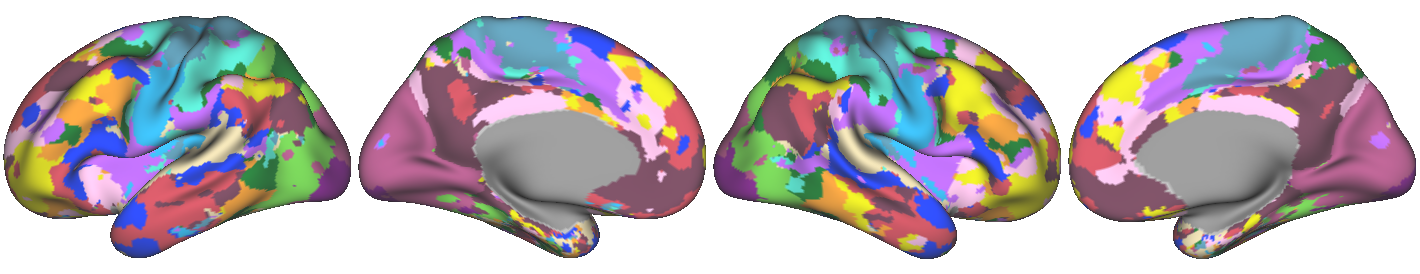
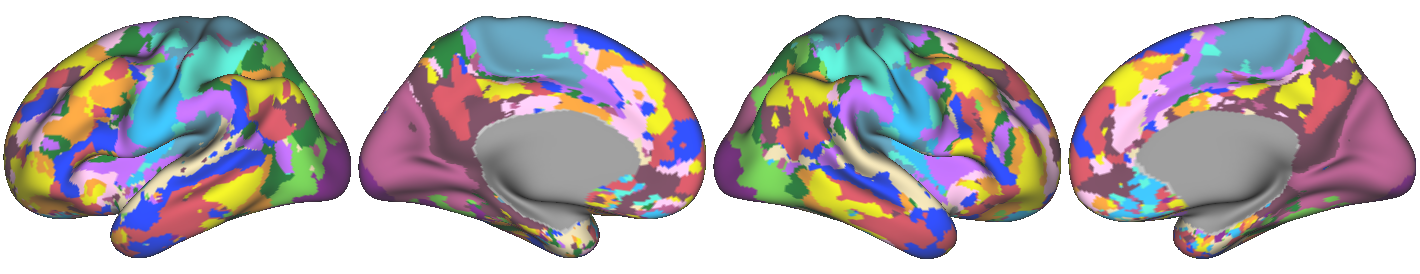
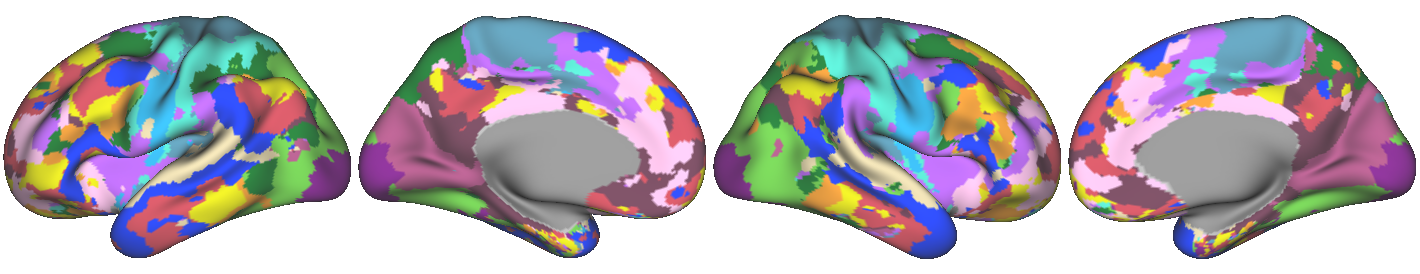
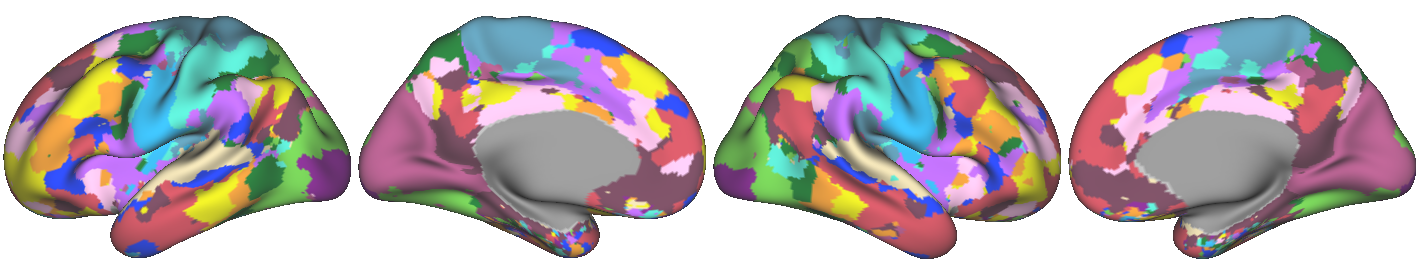
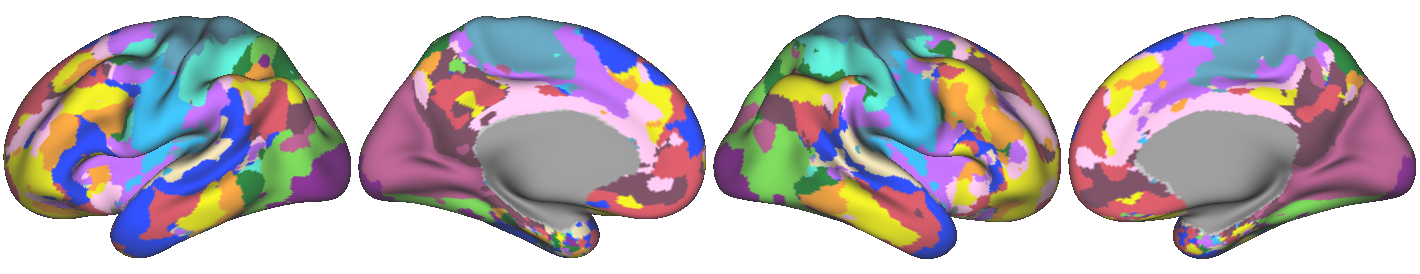
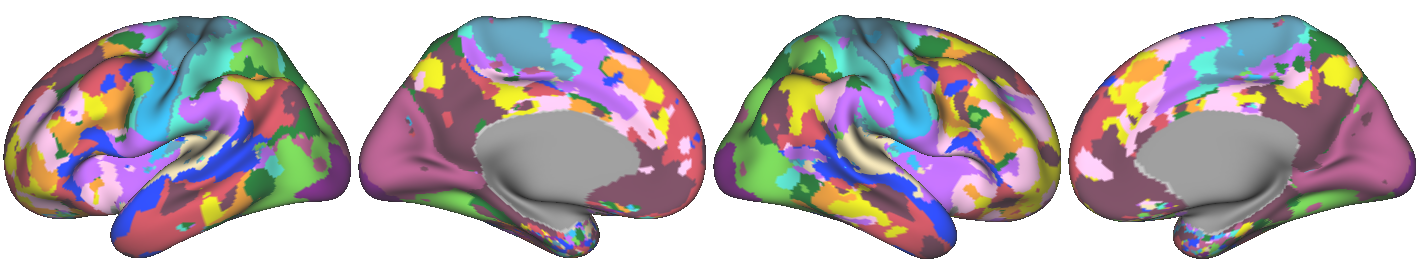
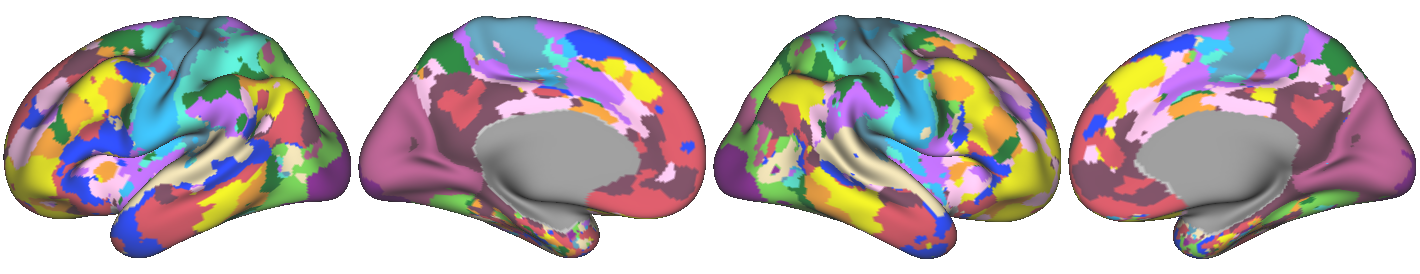
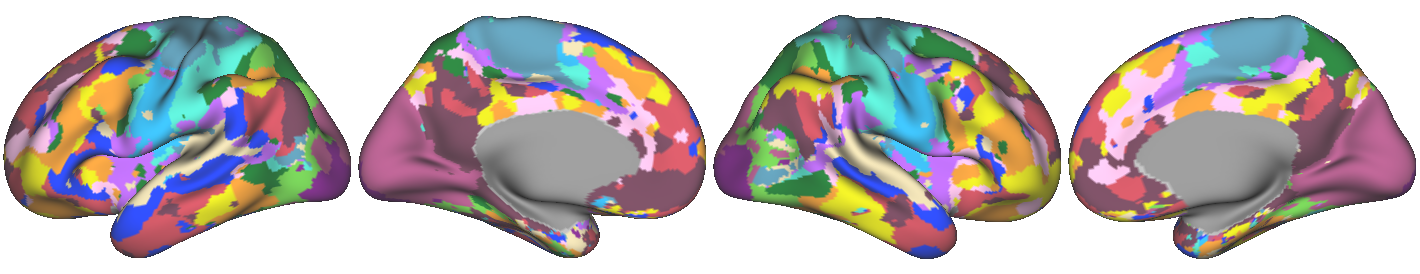
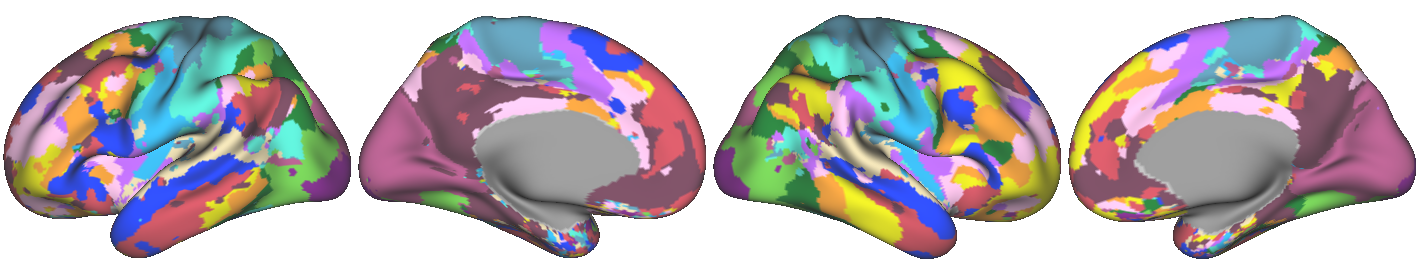
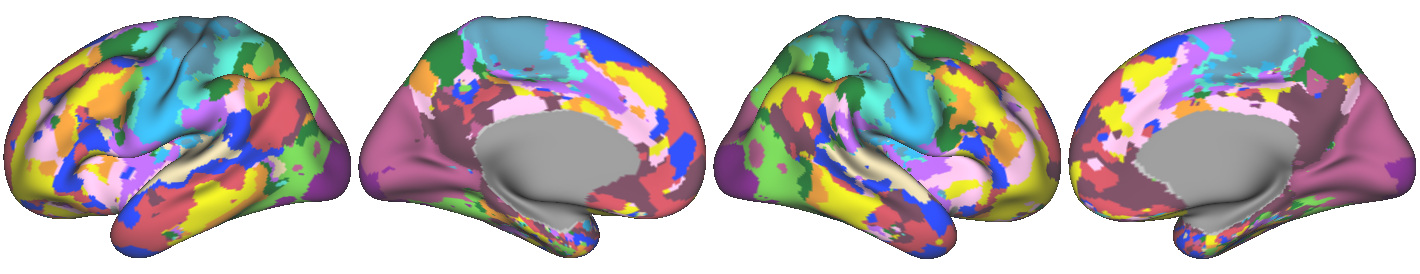
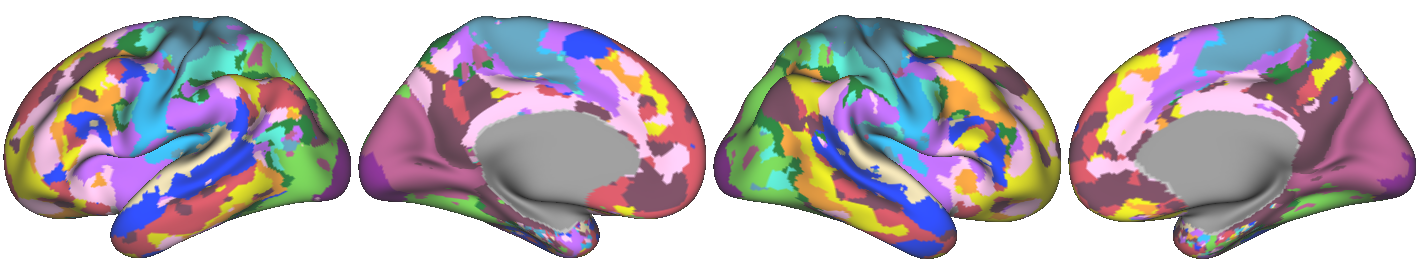
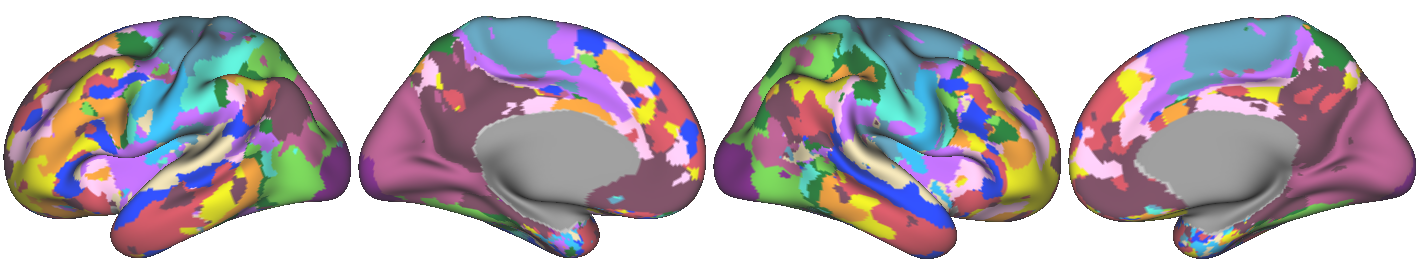
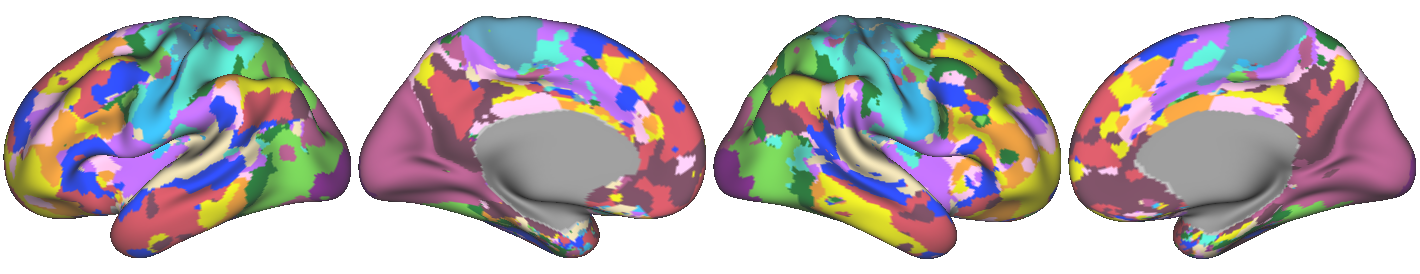
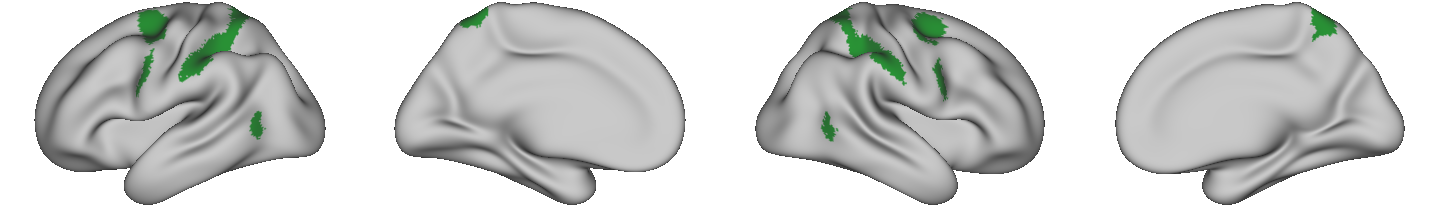
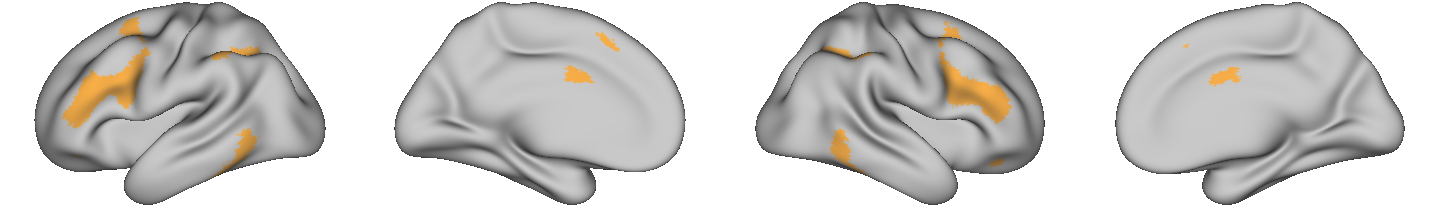
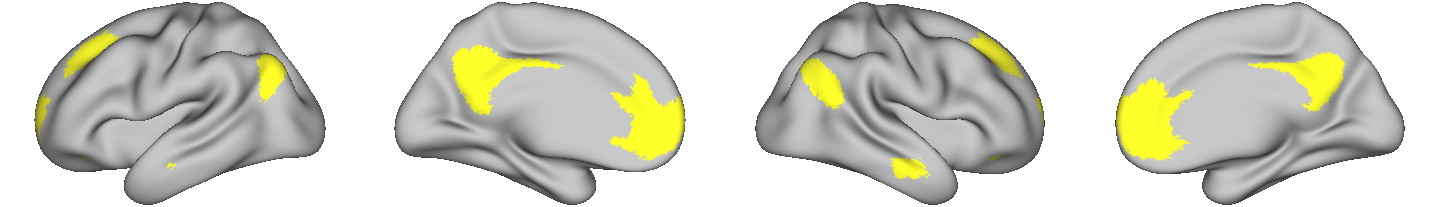
The individualized network parcellations were established using resting-state BOLD data and a parcellation pipeline developed by Kong et al., 2019, that employs a multisession hierarchical Bayesian model (MS-HBM). This model, like other clustering algorithms used to parcellate the human cortex, conceives of the cortical networks as a set of regions that exhibit similar cortico-cortical functional connectivity – i.e., all vertices within a given network will exhibit similar patterns of correlation to all other vertices in the brain (aka. have similar connectivity profiles). This model is unique in that it establishes a series of hierarchies, such that network assignment for each vertex is informed not only by a group average prior, but also an average within-person expectation. So, though the model is initialized using network assignments from a group averaged solution obtained from an independent dataset (in this case the HCP S900 data (Du et al., 2023 – see above), each individuals parcellation is allowed to vary from that group average, as the expectation maximization estimator iterates across the levels of the hierarchy to identify an optimized solution. This results in an individualized parcellation for each subject (see below).
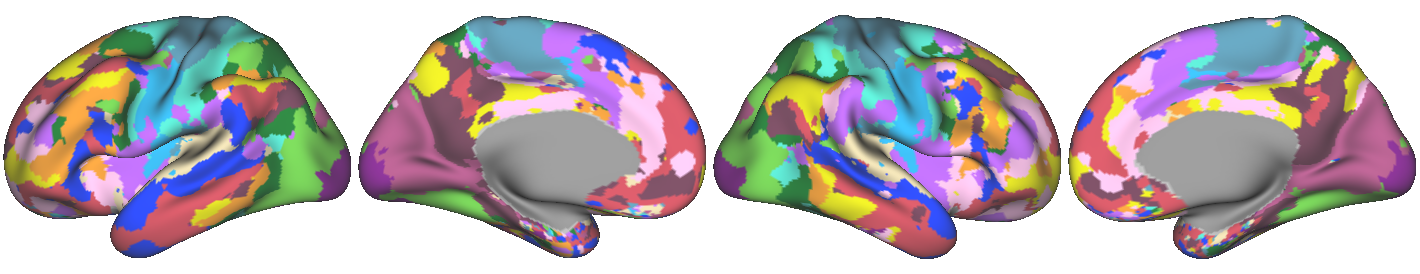
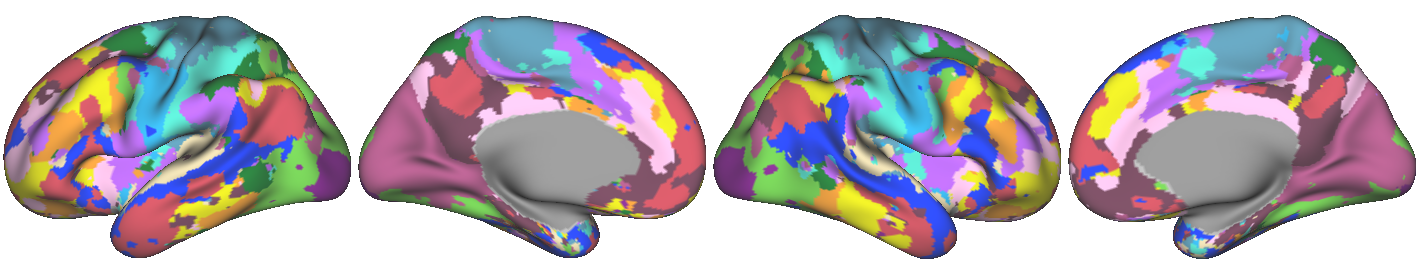
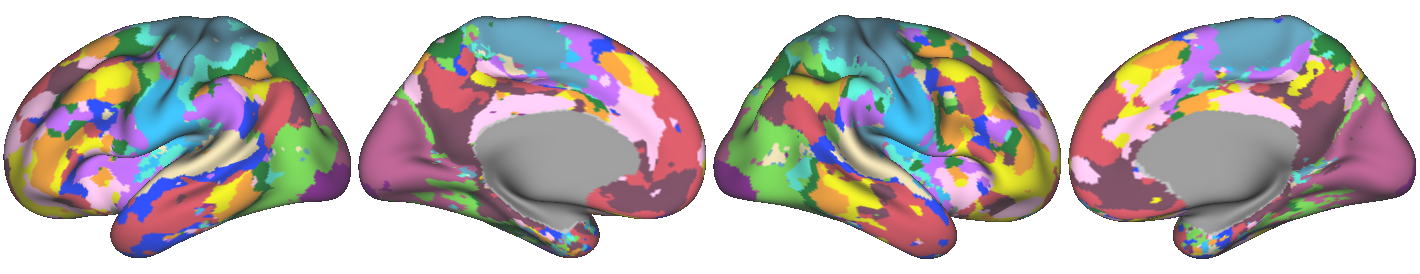
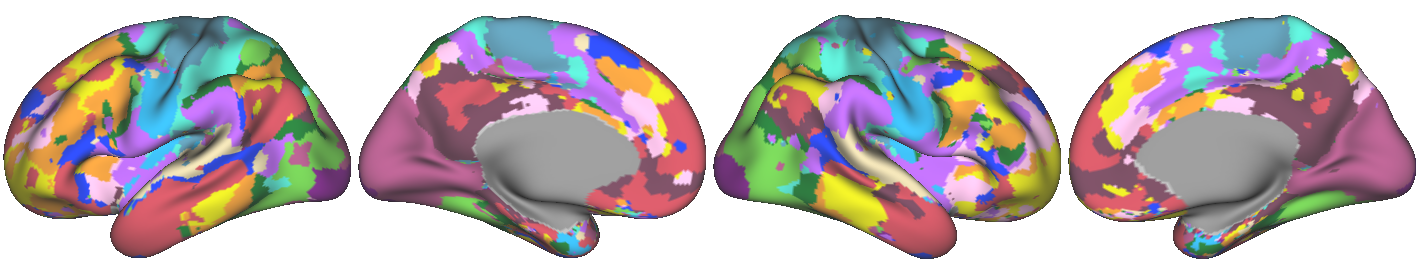
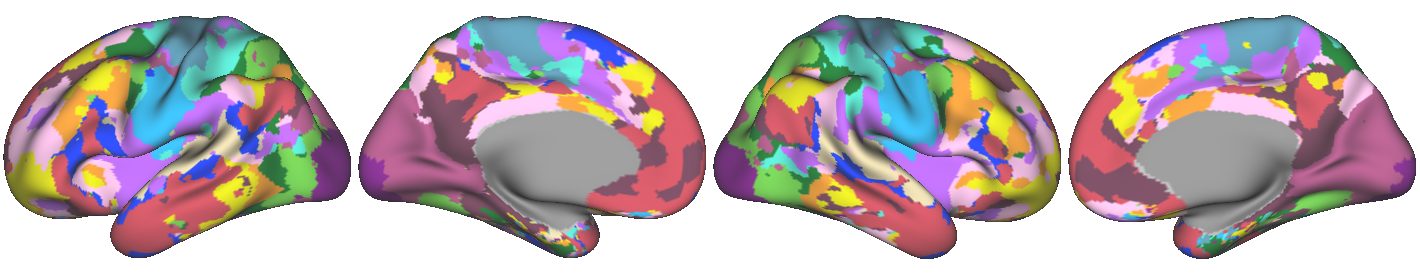
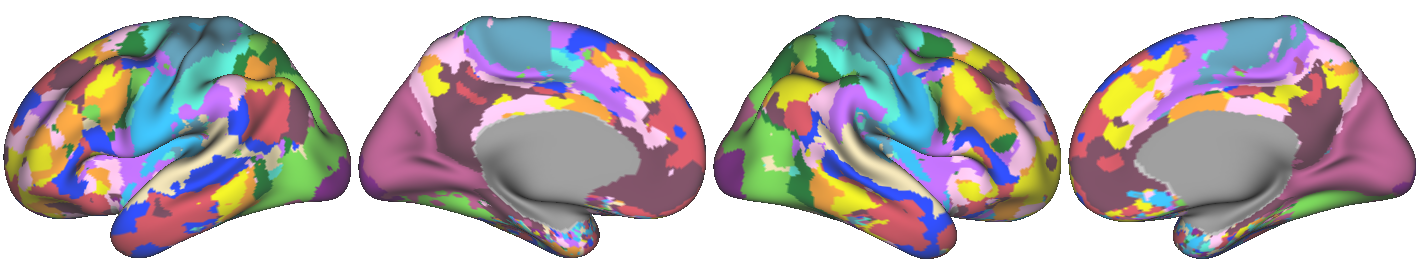
Individualized Parcellations:
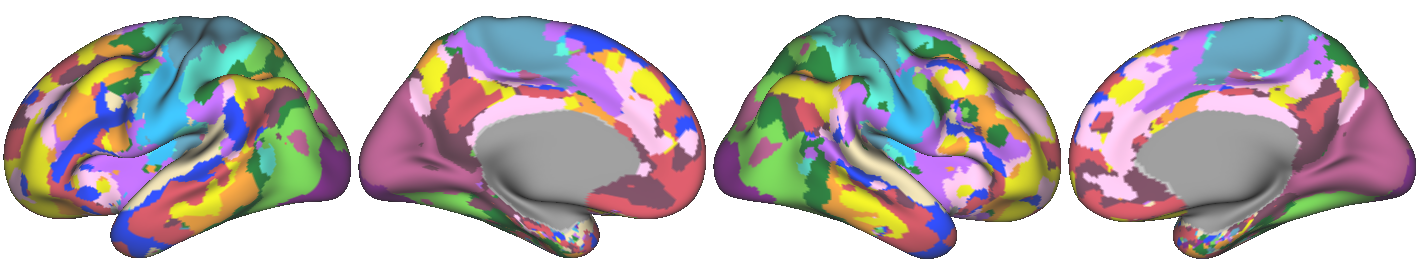
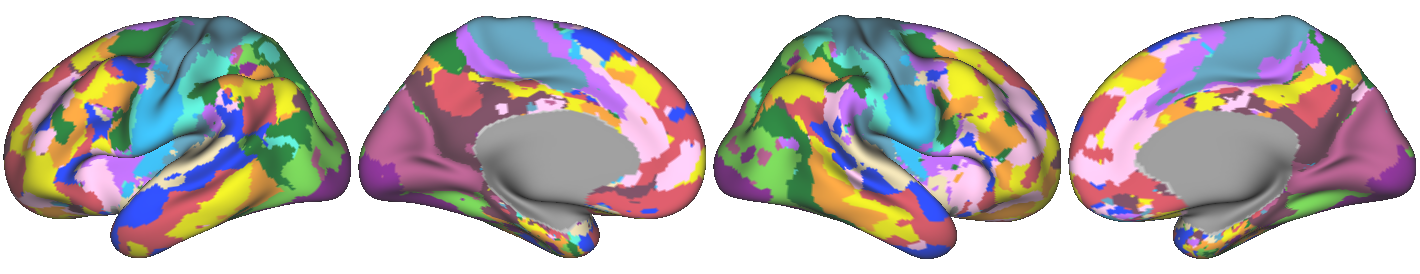
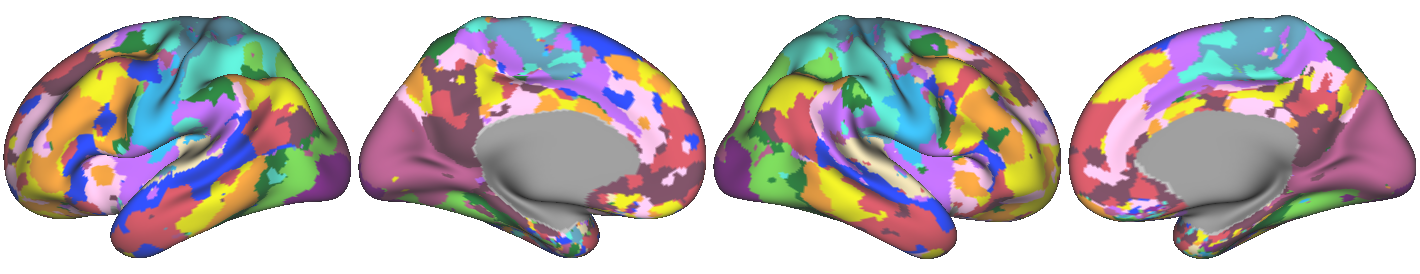
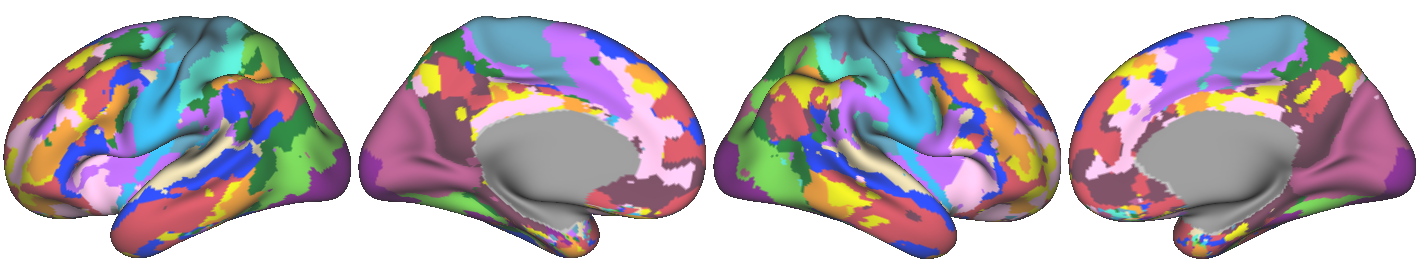
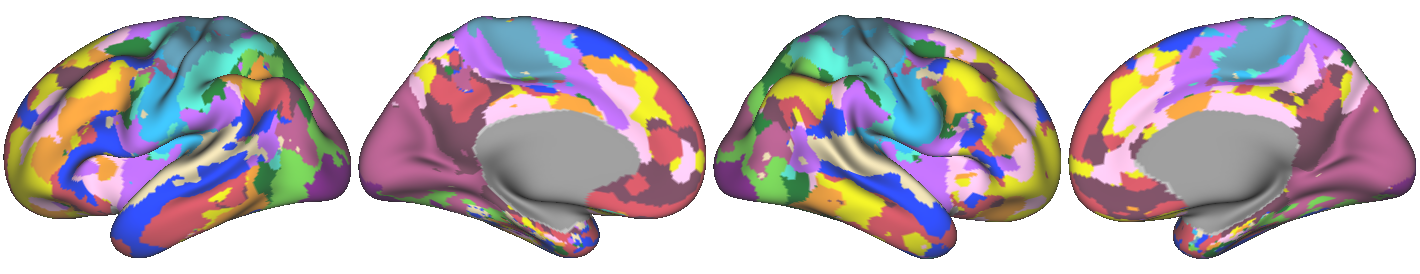
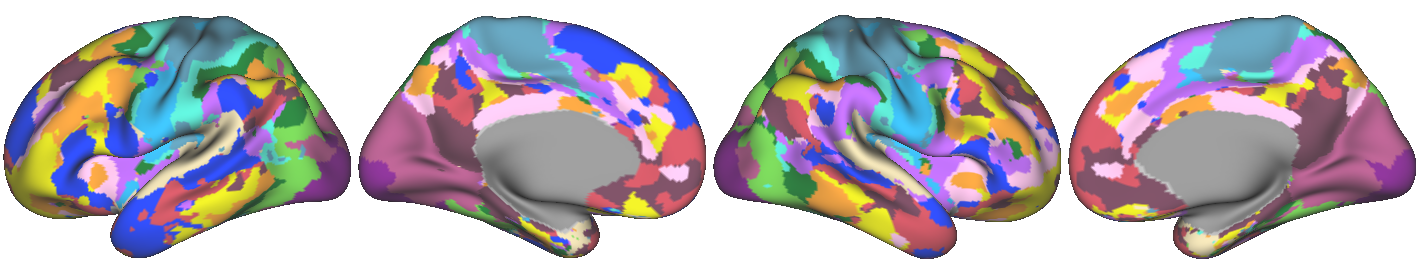
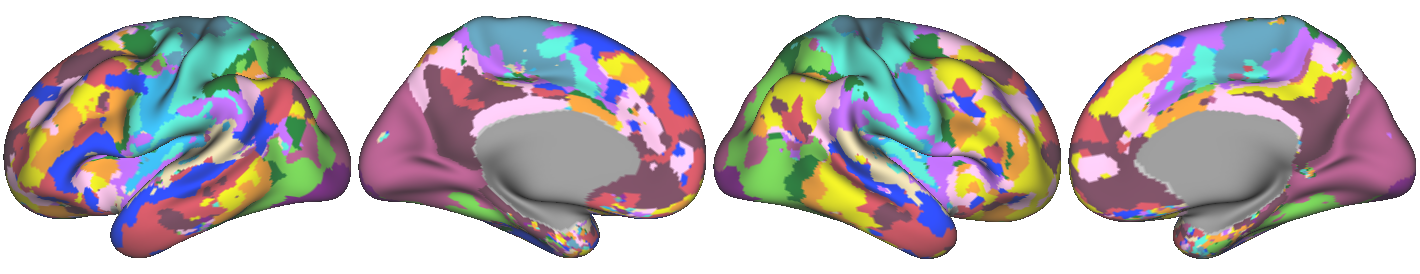
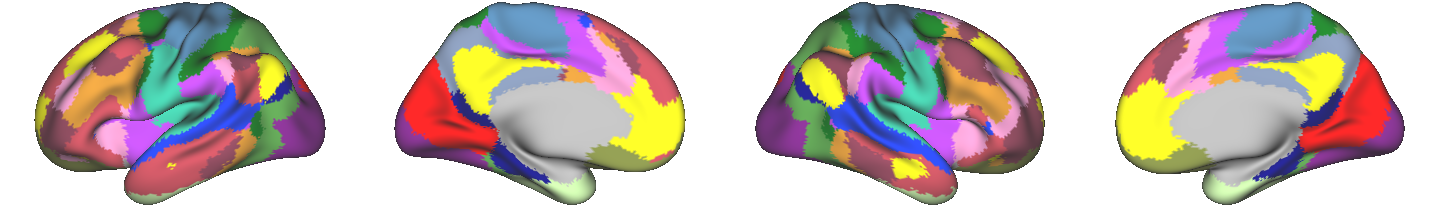
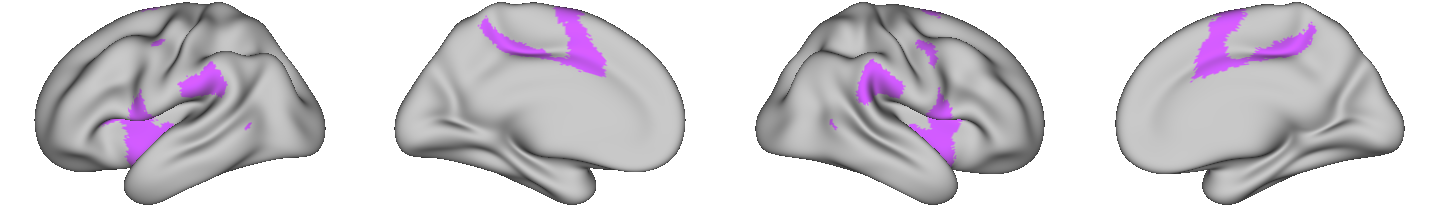
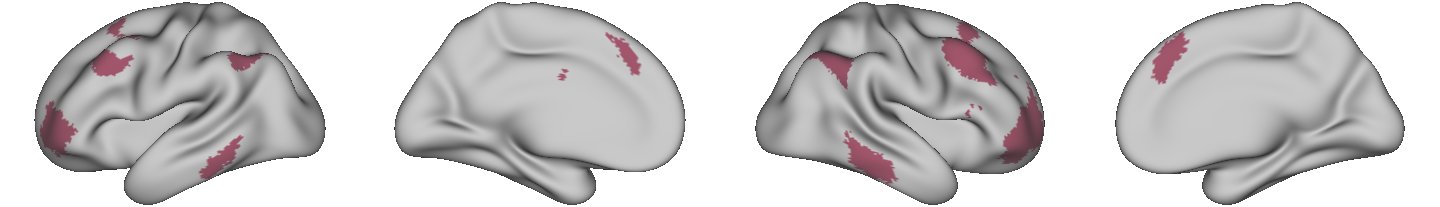
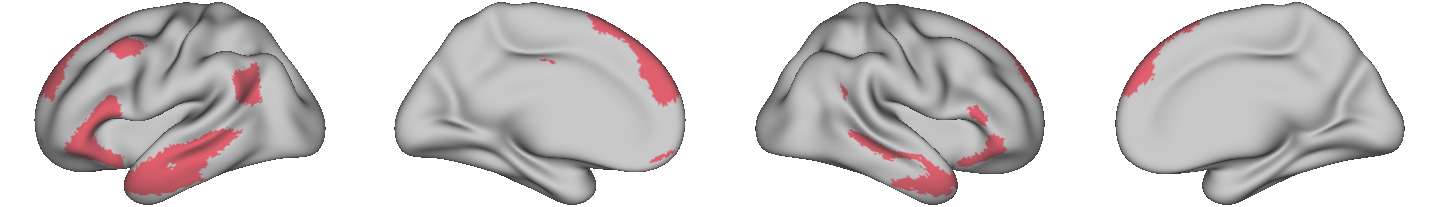
To evaluate group-based parcellation boundaries, we used the 17 network parcellation established in Yeo et al., 2011. The parcellation approach used to establish the individualized network boundaries (detailed above) takes a global connectivity approach (Kong et al., 2019), and does not constrain based off local connectivity like some other approaches (Glasser et al., 2016; Kong et al., 2021; Schaefer et al., 2018). The Yeo 2011 parcellation most closely recapitulates the individualized approach used and thus was selected as the group-based reference.
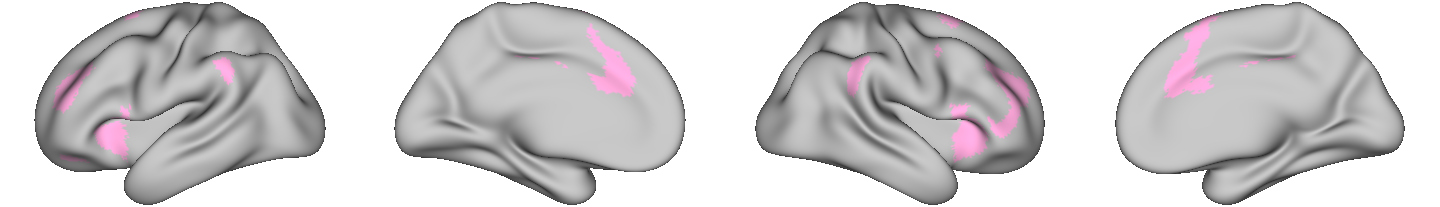
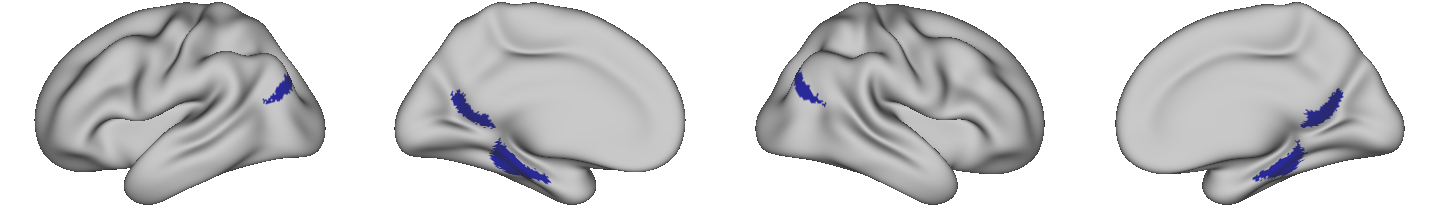
This group-based parcellation is composed of 17 networks: The visual-central network (VisCent), the visual-peripheral network (VisPeri), the somatomotor network A (SomMotA), the somatomotor network B (SomMotB), the dorsal attention network A (DorsAttnA), the dorsal attention network B (DorsAttnB), the salience/ventral attention network A (SalVentAttnA), the salience/ventral attention network B (SalVentAttnB), the limbic network A (LimbicA), the limbic network B (LimbicB), the control network A (ContA), the control network B (ContB), the control network C (ContC), the default network A (DefaultA), the default network B (DefaultB), the default network C (DefaultC), and the tempero-parietal network (TempPar). For a full account of these network, please refer to the original publication (Yeo et al., 2011).
The Networks:

Isolating Boundary Activity:
To isolate the ‘emotion processing’ activity observed within each boundary (described above), a similar approach to that of DiNicola, et al., 2020 was used. Activity within each boundary (amygdala, each meta-analytic ROI, each individualized network, and each group network) was extracted from the unthresholded beta maps of the Faces > Shapes contrast (‘emotion processing’ activity), as well as from the Faces > Baseline (faces condition activity) and Shapes > Baseline (shapes condition activity). The average activity within boundary was then calulated from this boundary-extracted data. Note, for the boundaries in the volume (the amygdala and meta-analytic ROIs), the average activity was calculated by averaging all activity for all voxels within the given ROI using beta maps estimated in the volume. For the boundaries on the surface (individualized networks and group networks), the average activity within network was calculated by averaging all activity for all vertices within the given network from beta maps estimated on the surfaces.
This approach allowed for the isolation of ‘emotion processing’ activity within each boundary and resulted in an average activity value within each boundary for each of the 12 sessions per subject.
On the following page we will examine the ‘emotion processing’ activity within the boundaries of the amygdala, the meta-analytic ROIs, the individualized networks, and the group networks. As described in the introduction, we are specifically interested in examining whether the individualized networks exhibit significant ‘emotion processing’ activity and how that activity compares to region-level activity in a set of meta-analytic ROIs, as well as activity given a group-based network parcellation.
REMINDER: We will only consider ‘emotion processing’ activity that is the result of more positive activity during the faces condition as compared to the shapes condition. Any activity that is the result of less negative activity during the faces condition as compared to the shapes condition will not be highlighted.
UP NEXT: Examining ‘emotion processing’ activity within the boundaries
Primary Question: Do the individualized networks exhibit significant ‘emotion processing’ activity?