Is it really networks?
Primary Question: Is observed network activity really due to the whole network responding to task or are specific regions that fall within the network driving observed increases in activity?
Page Overview:
In the boundary activity analysis, I found that not only do select regions exhibit significant ‘emotion processing’ activity (left and right fusiform), but functionally comparable networks also exhibit significant ‘emotion processing’ activity (visual-central network and dorsal attention network B). While it is possible that the activity in these networks is occurring at a network level, it is also possible that the observed activity is being driven by increases in activity in specific regions that fall within the network. For example, do I see notable visual-central network activity only because the fusiform falls primarily within the network?
To address this question I will examine the distribution of vertex activity within each network. Each network is comprised of thousands of vertices that each exhibit a level of activity. To obtain the average activity within each network, the values used in the boundary activity analysis, I averaged the activity from every vertex that fell within a given network boundary. In this analysis, instead of collapsing to the level of a network, I will examine the distribution of vertex activity within each network. This will allow us to examine the whether the whole network is activity, or if only a subset of the network is driving the observed activity.
Primary Question: Is the observed network activity really due to the whole network responding to task or are specific regions that fall within the network driving observed increases in activity?
The page is broken down into 4 sections:
- Section 1: A visual examination of the vertex-level activity for a set of sessions from a subset of the highest quality subjects.
- Section 2: An visual example of isolated region-level vertex activity within a network (Somatomotor Network A).
- Section 3: Quantifying the percentage of active vertices within each network (measuring within-network vertex activity).
The above sections will for an examination whether the observed activity is really occurring at a network level, or if select regions within a network are driving the observed network-level activity. The emphasis here is examining the activity within a network to confirm that when a network exhibits significant activity, it is the result of an increase in activity across all verticies within the network. This account of within-networks activity is one way to examine network-level functioning. Another way to further examine network-level functioning is to examine the extent to which the activity within a network is differentiable from other networks. Meaning, do the networks exhibit unique patterns of activity that allow us to differentiate between them, and is this visible at a vertex-level? This question of between-network vertex activity differentiation will be addressed in the final section.
Secondary Question: How well does the vertex-level activity differentiate between networks?
- Section 4: Quantifying the differentiation of vertex activity between networks (measuring between-network vertex activity).
Section 1. Visualizing ‘Emotion Processing’ Vertex Activity
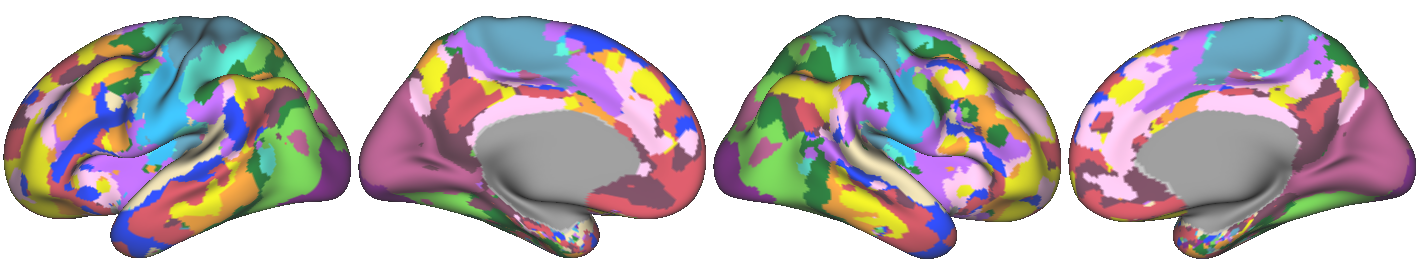
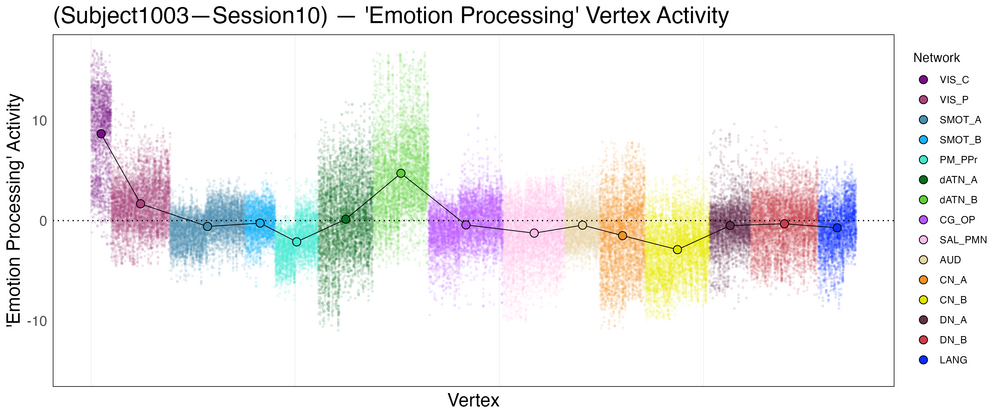
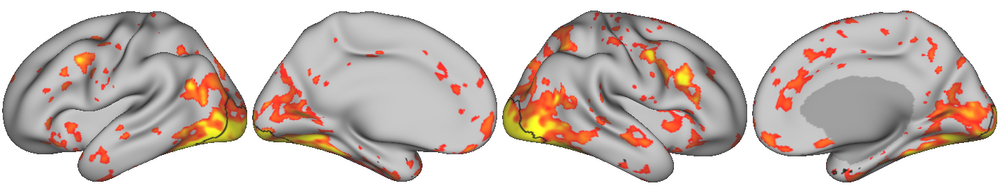
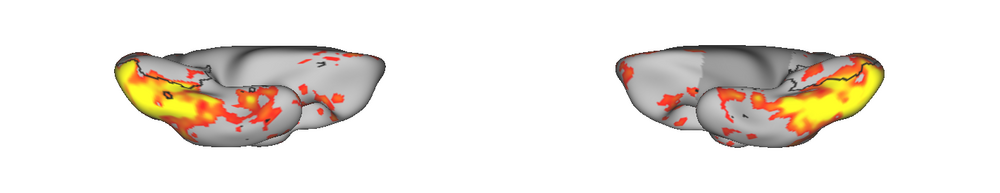
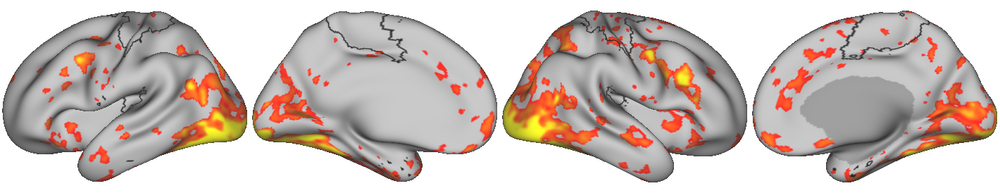
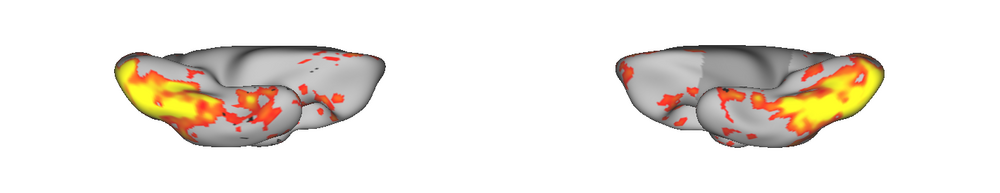
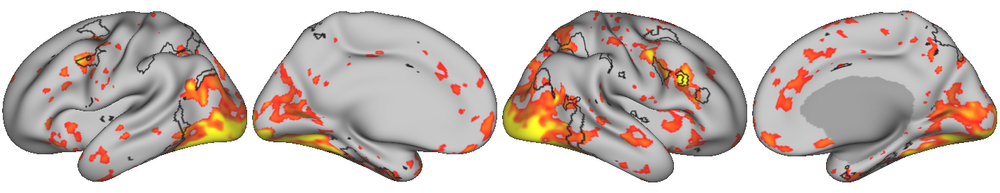
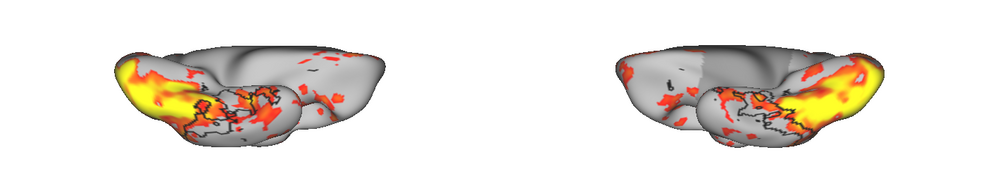
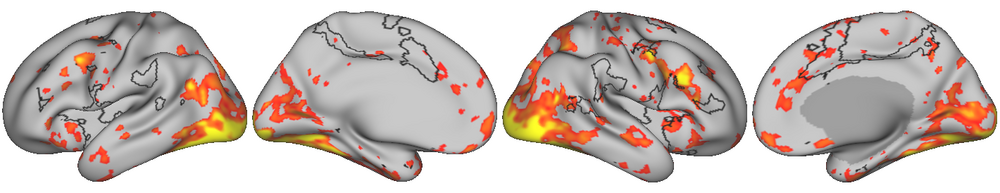
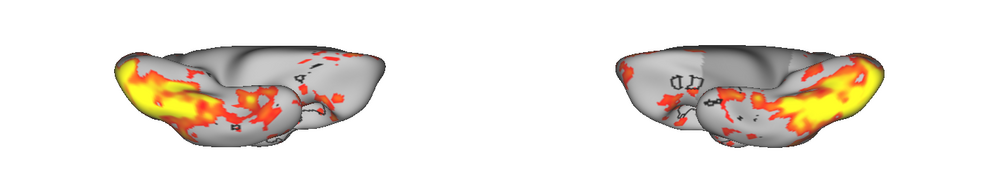
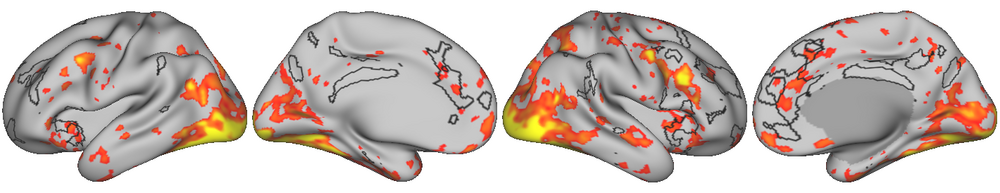
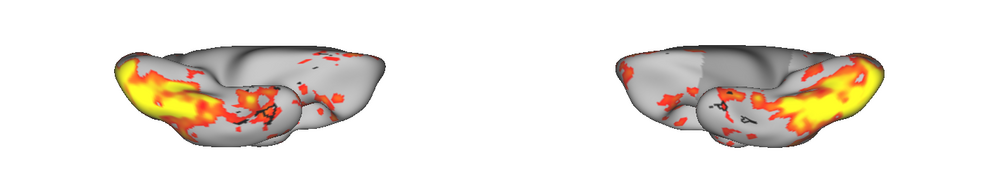
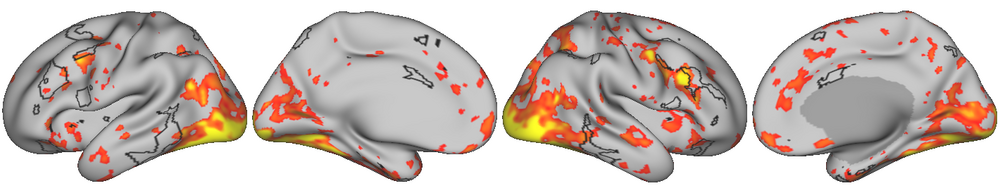
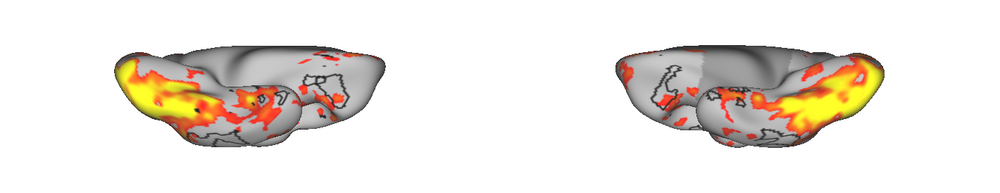
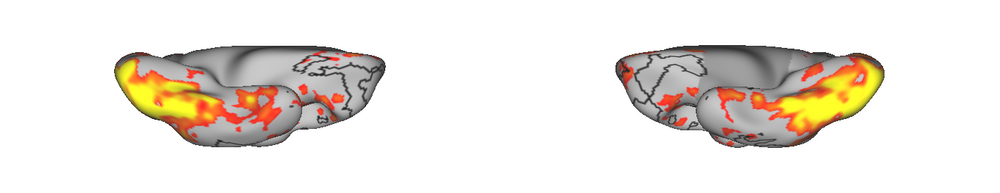
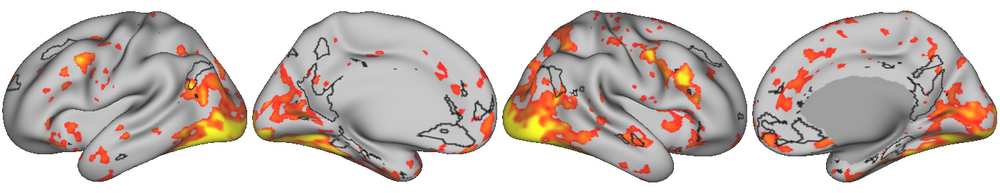
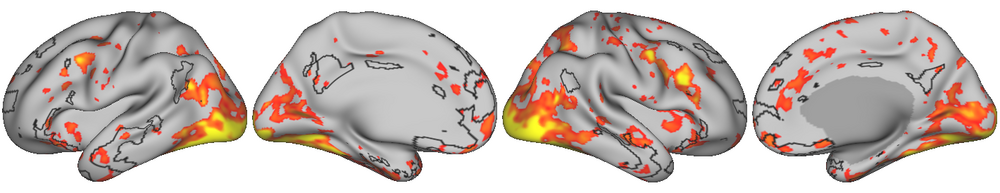
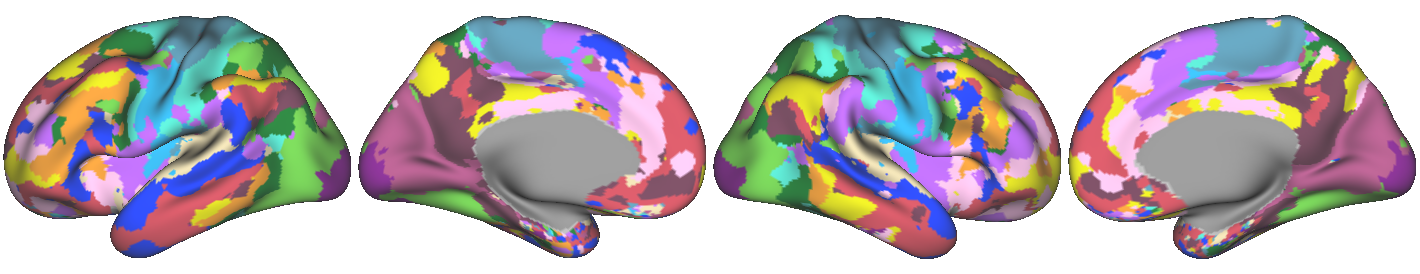
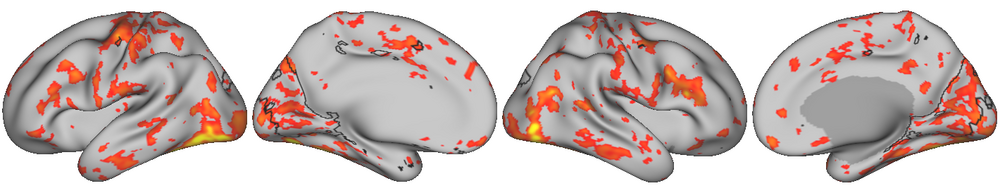
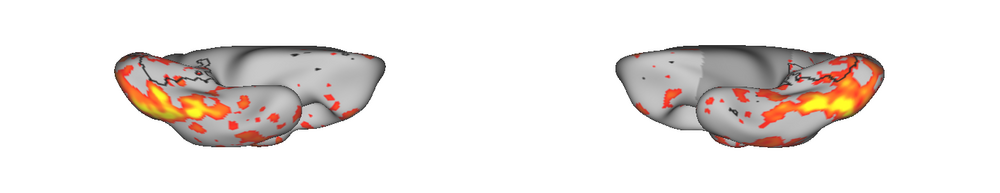
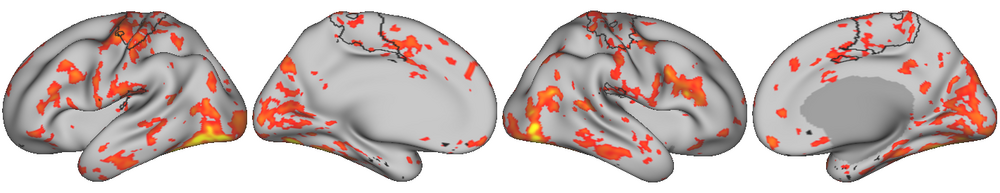
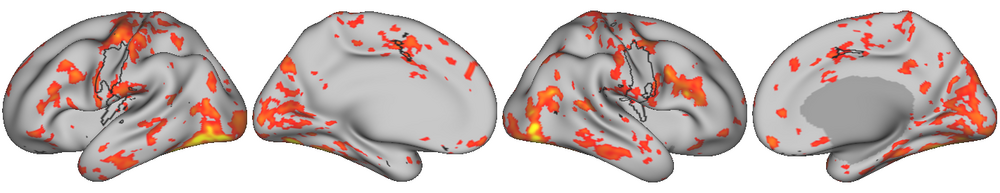
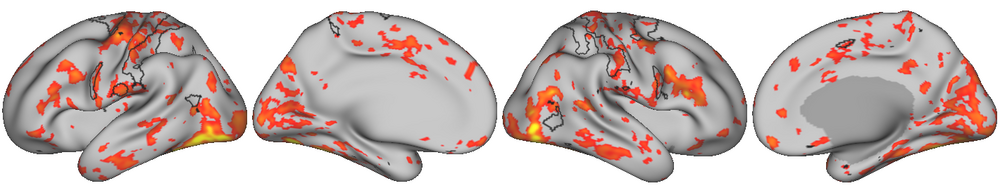
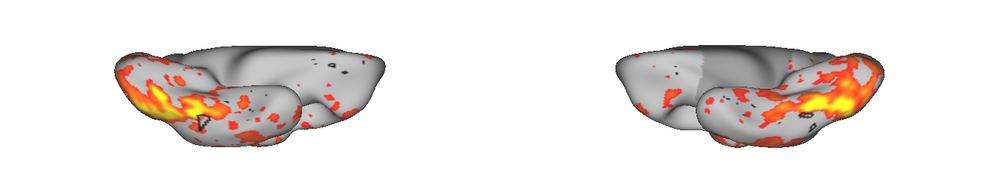
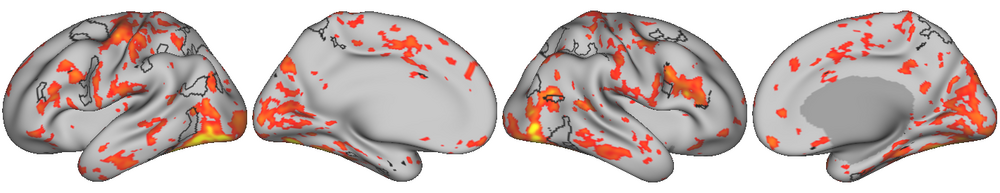
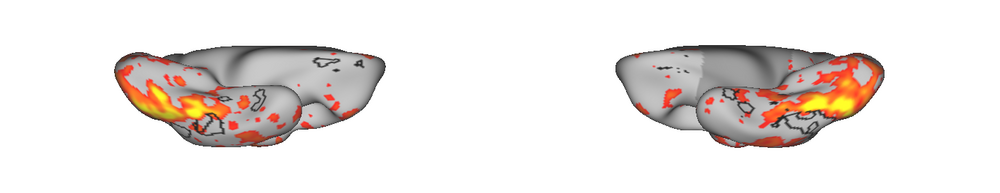
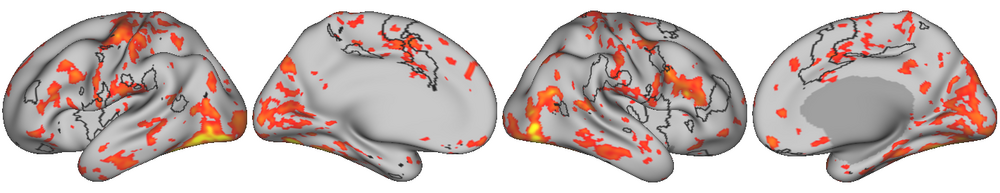
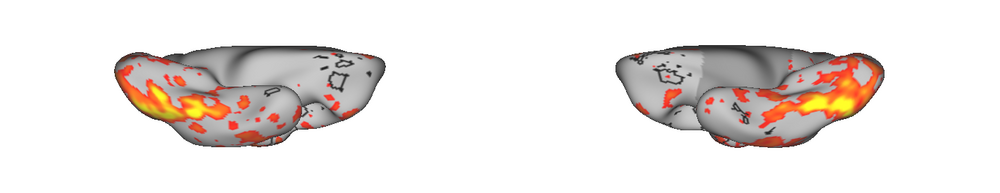
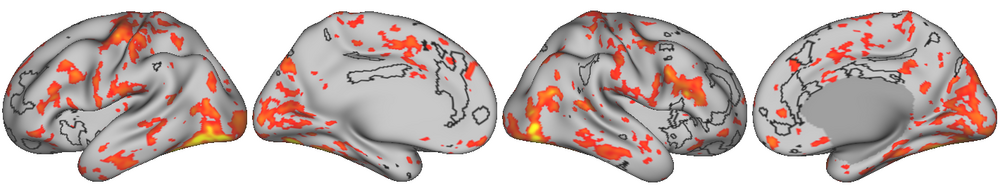
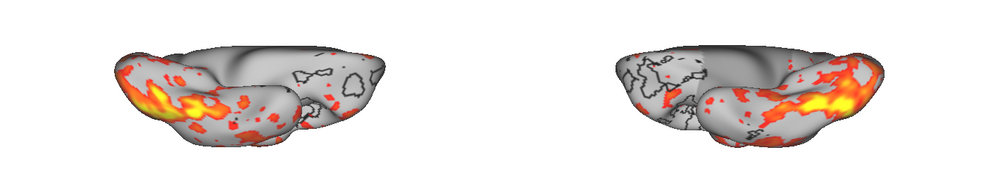
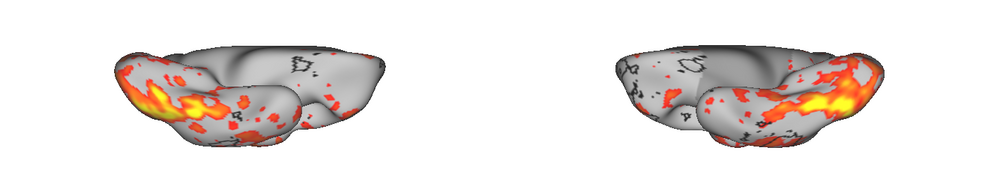
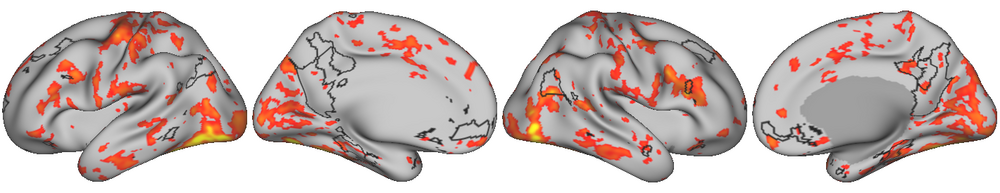
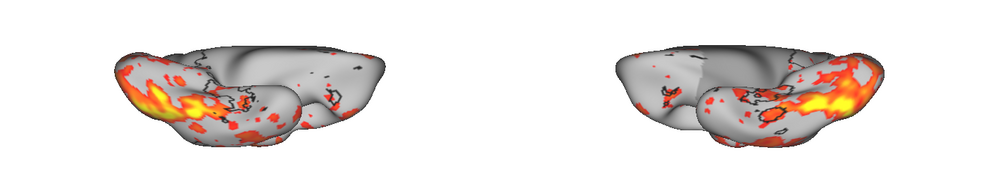
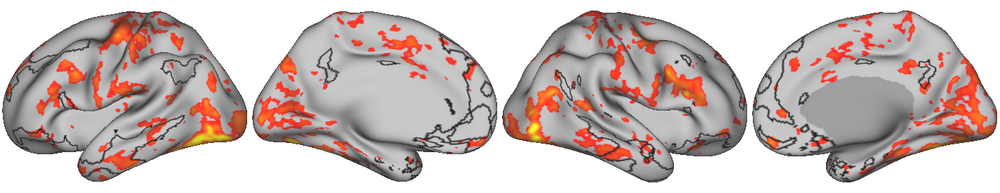
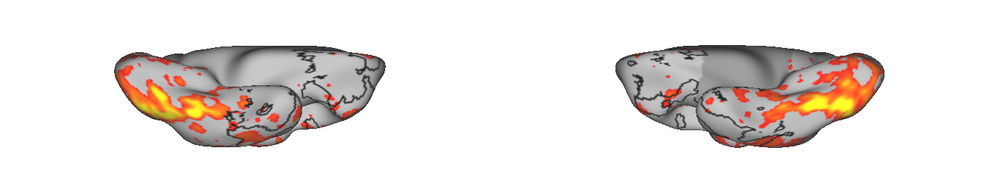
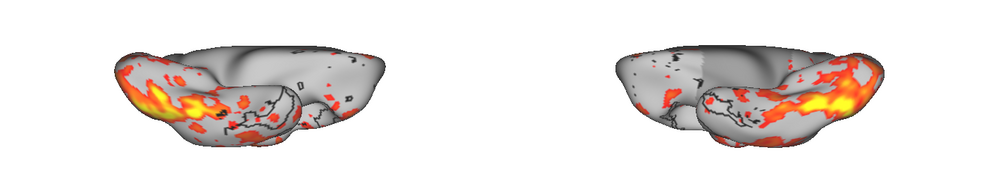
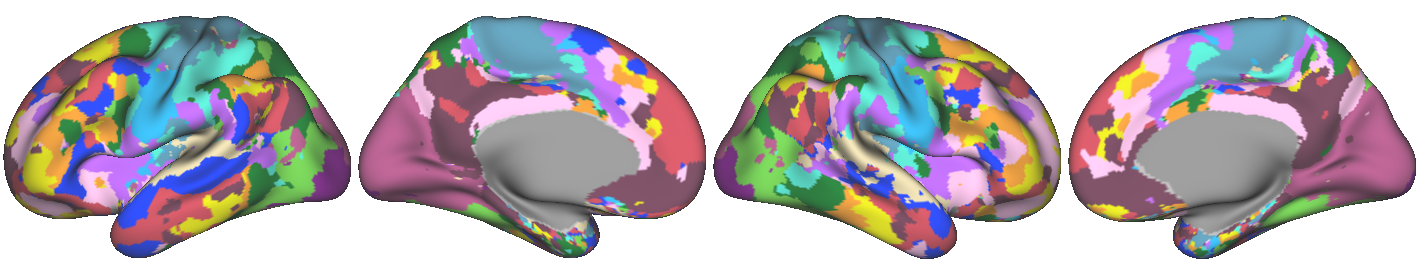
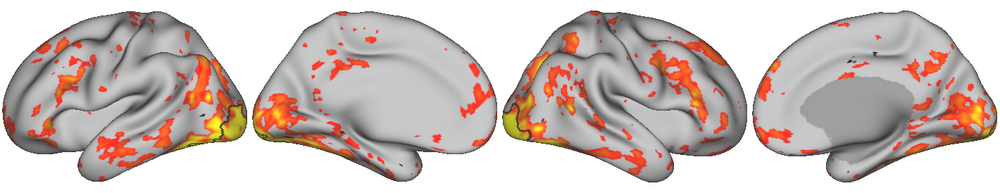
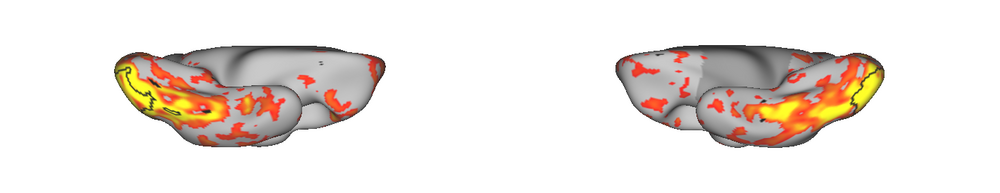
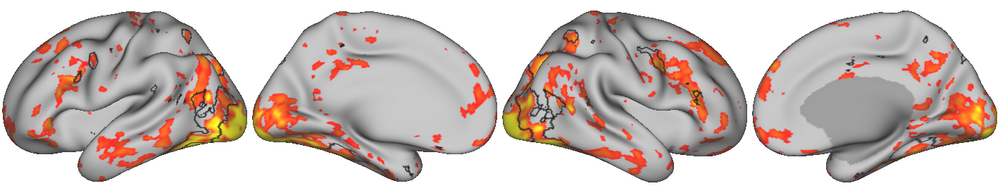
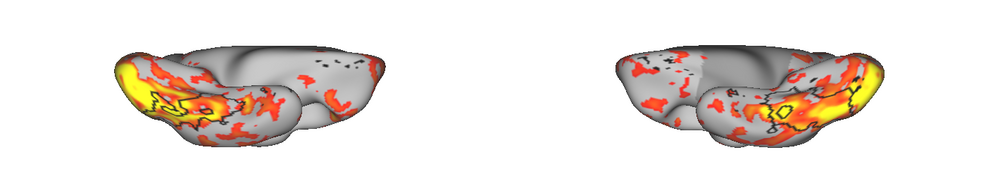
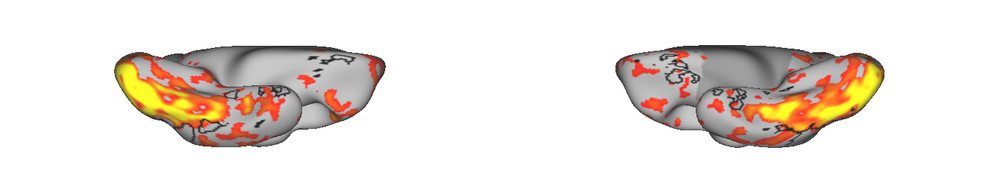
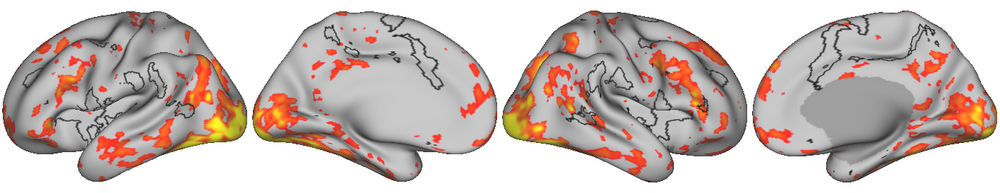
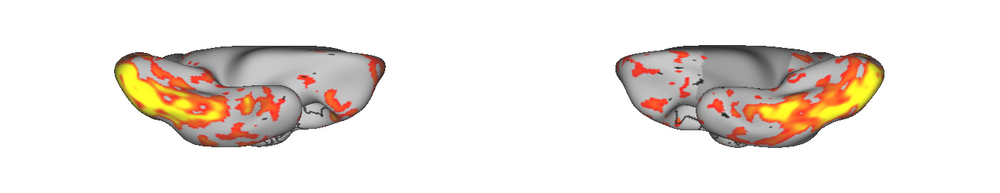
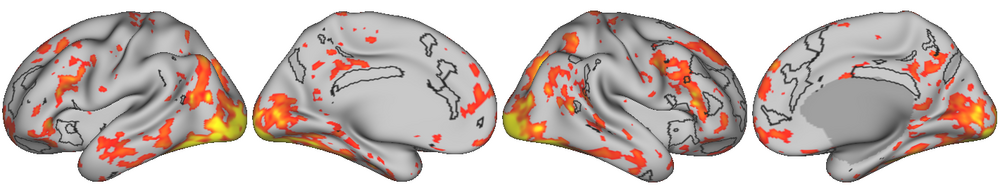
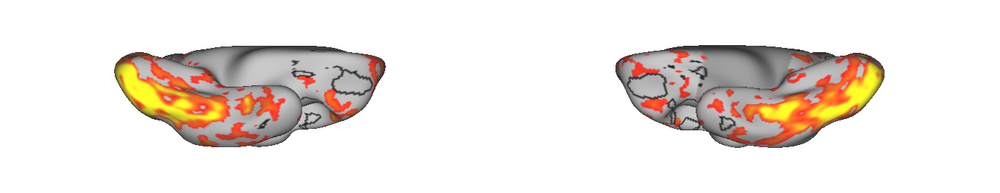
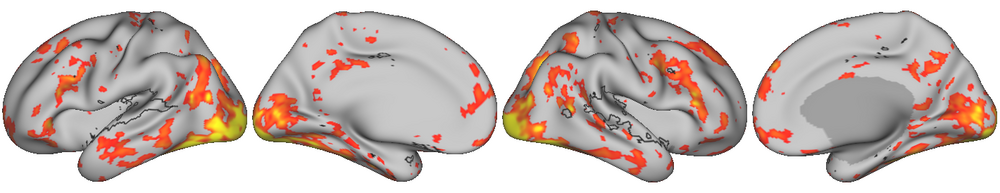
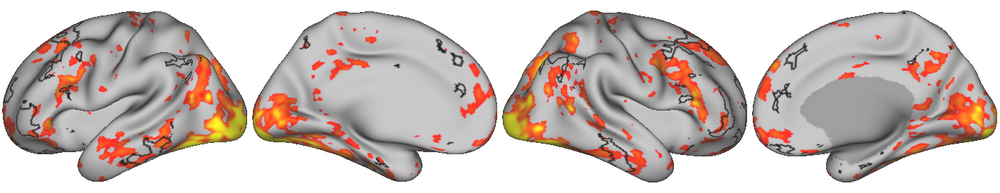
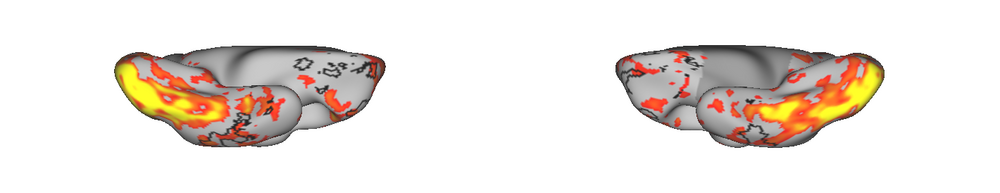
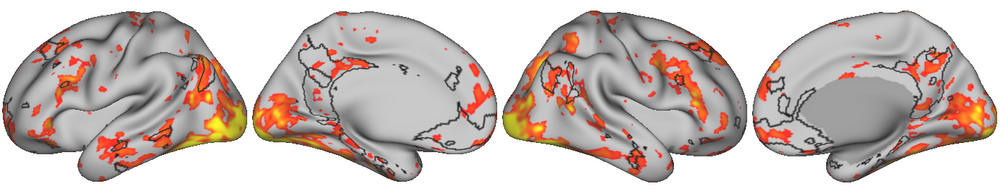
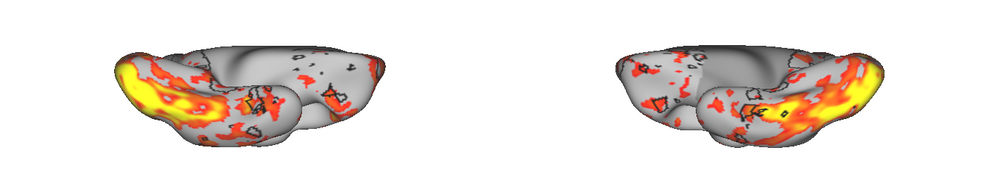
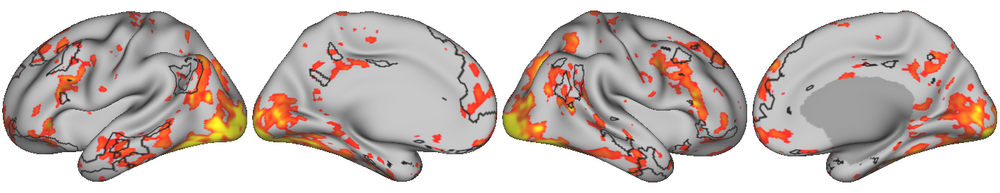
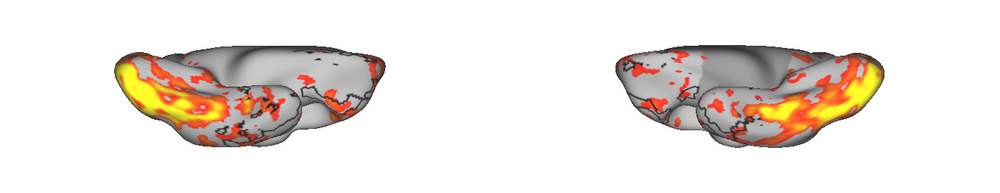
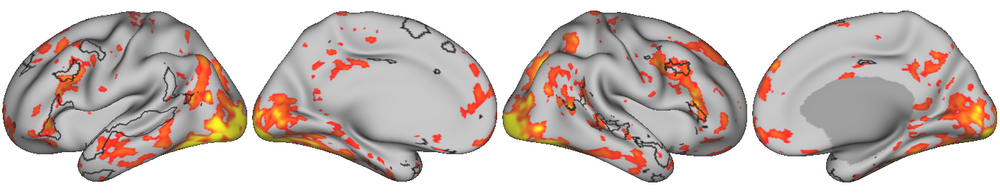
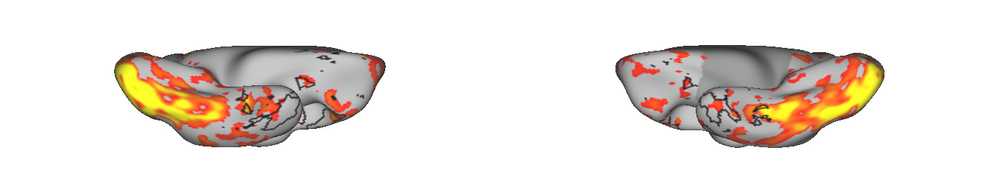
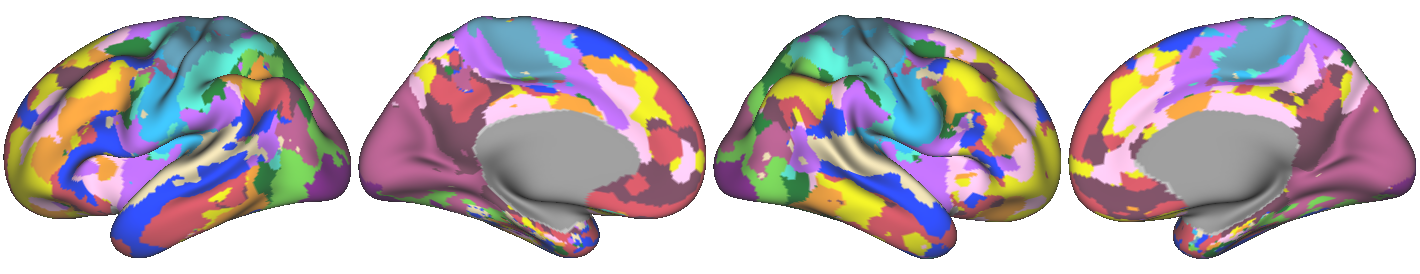
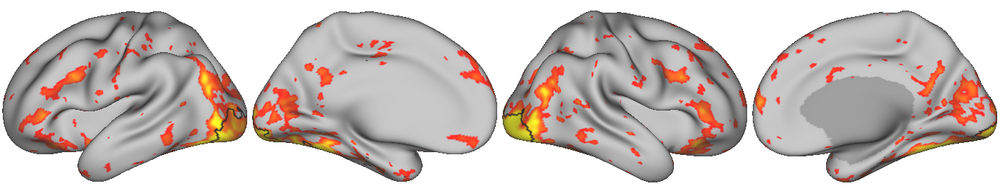
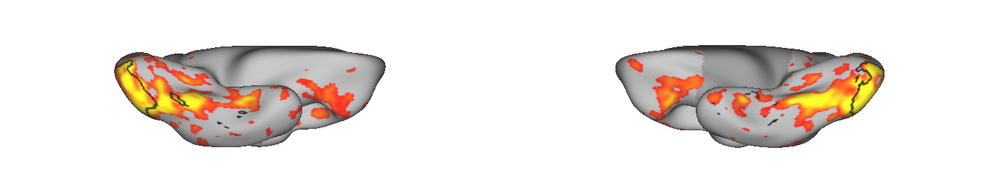
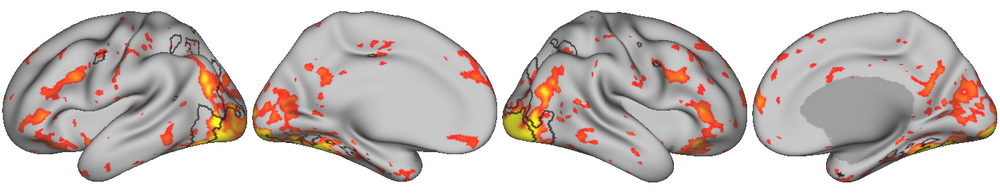
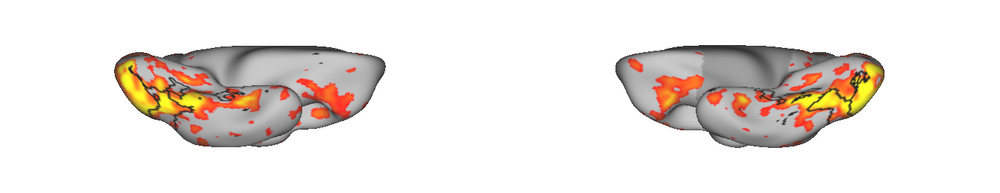
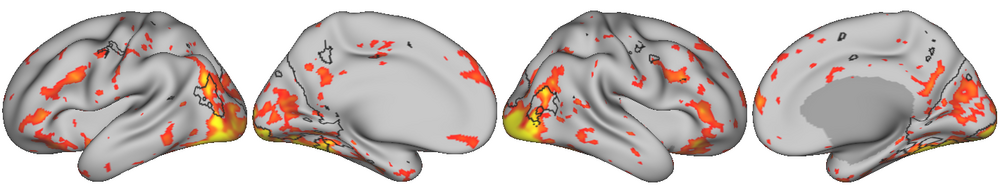
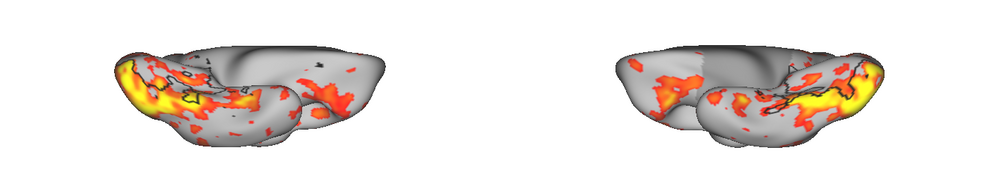
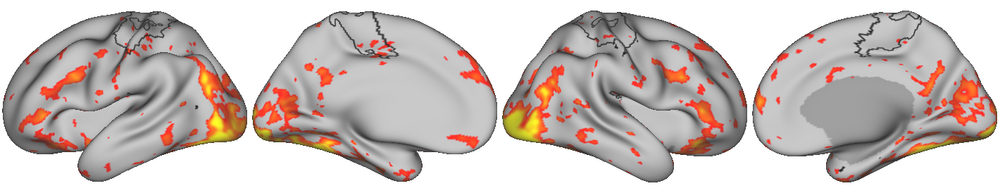
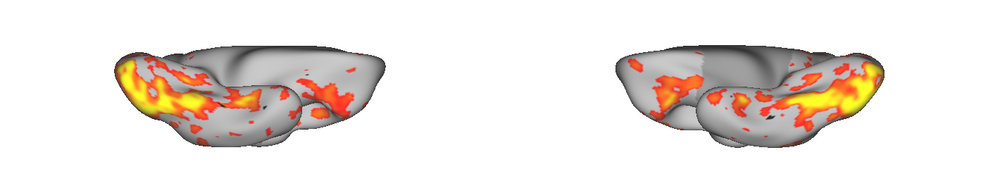
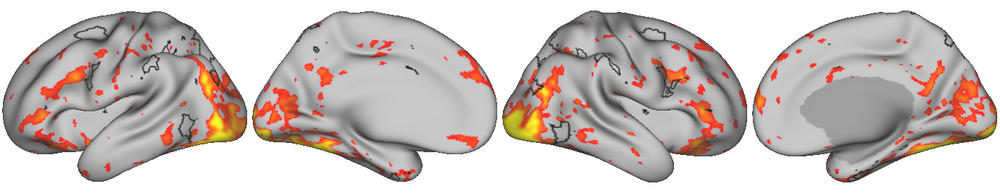
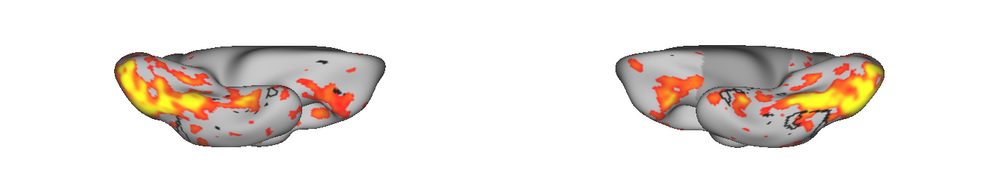
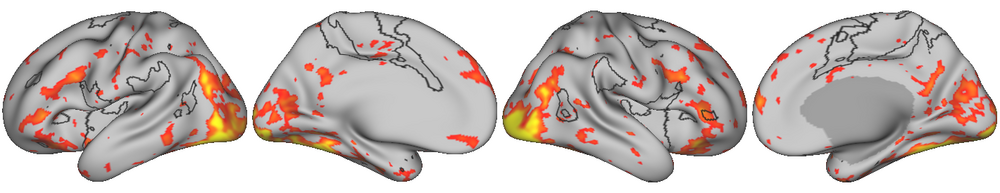
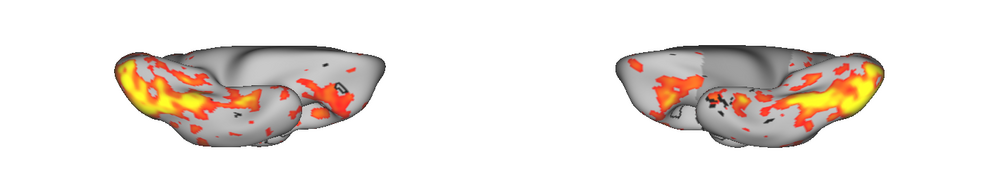
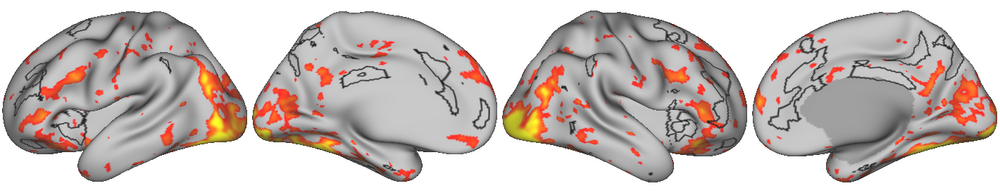
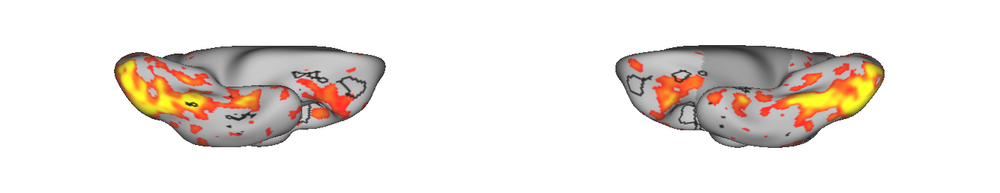
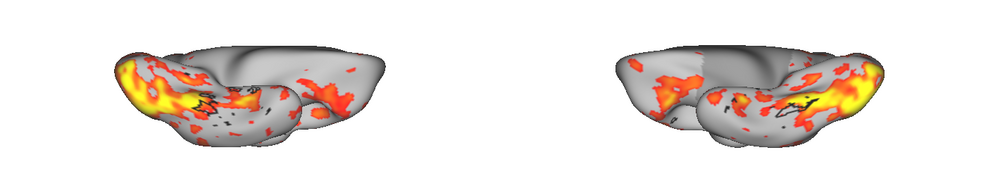
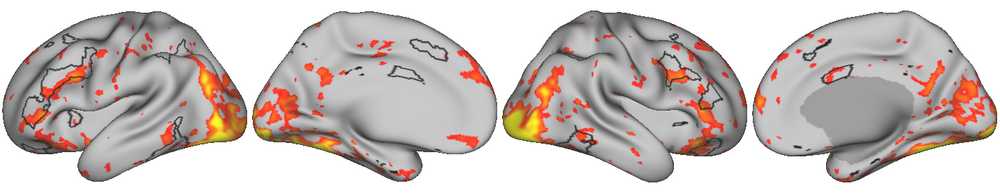
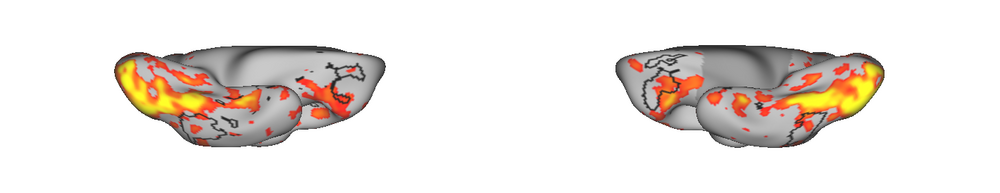
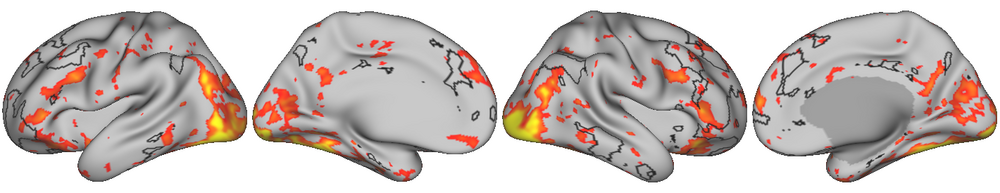
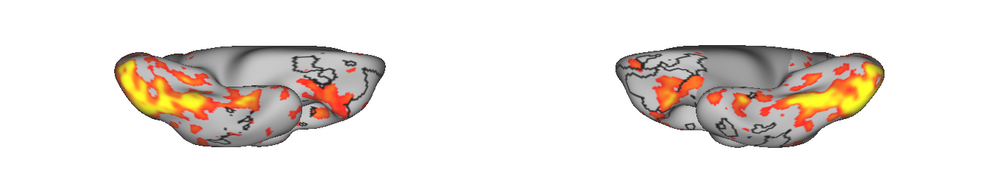
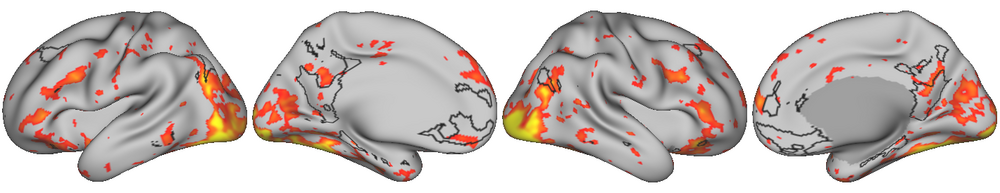
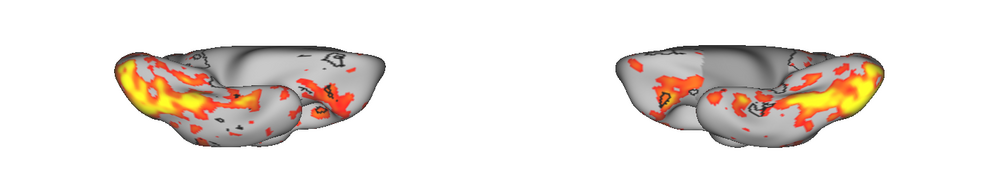
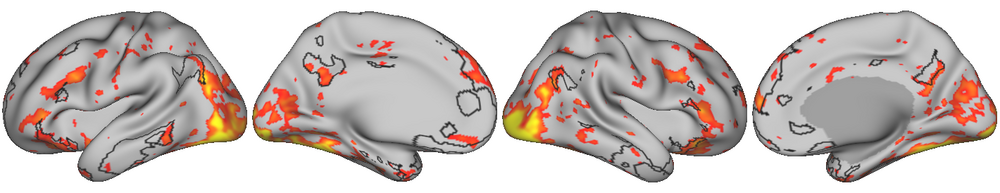
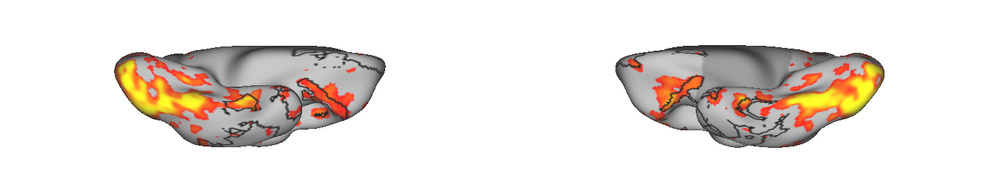
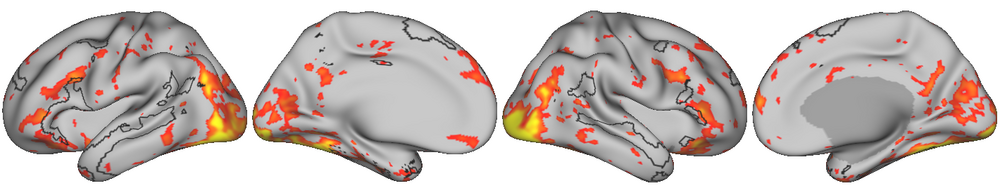
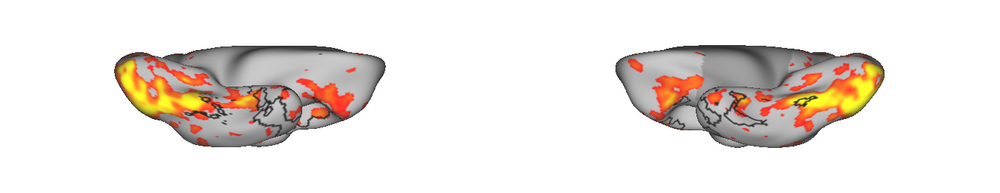
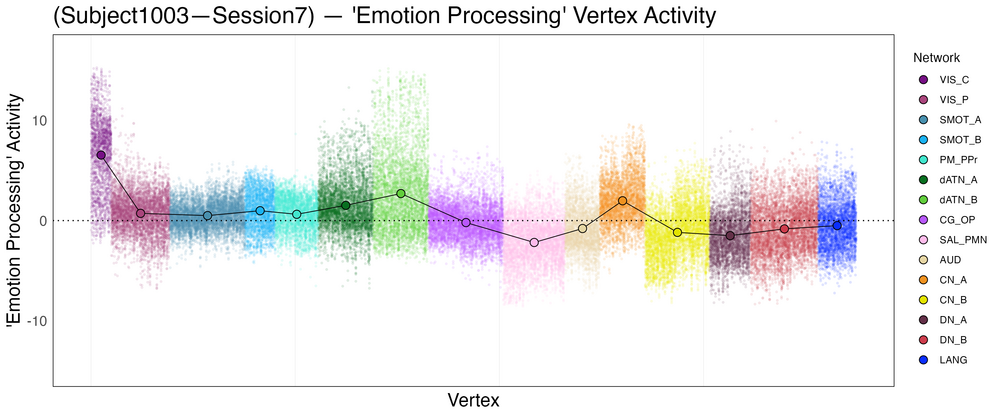
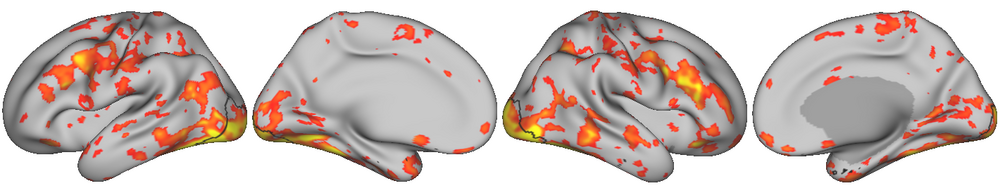
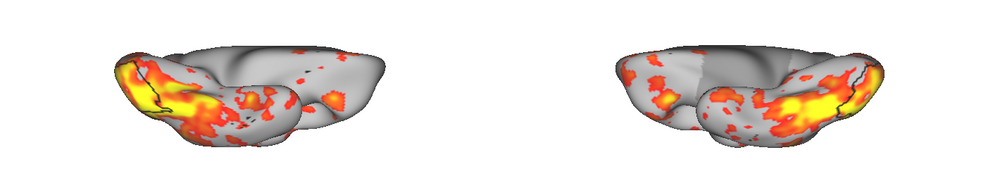
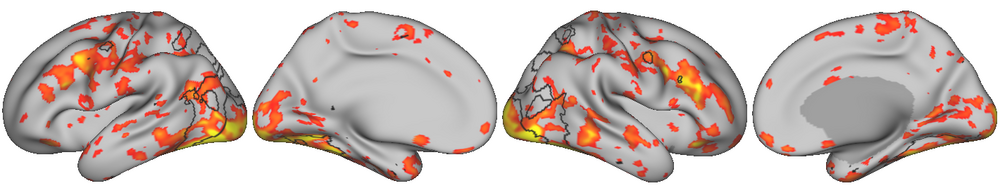
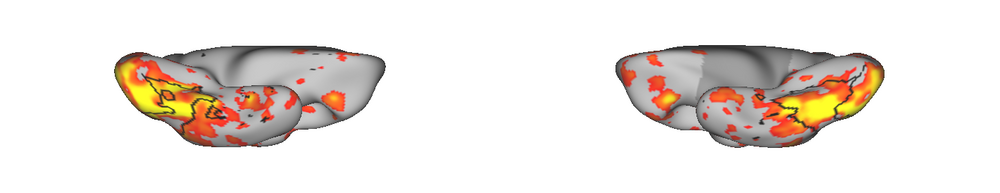
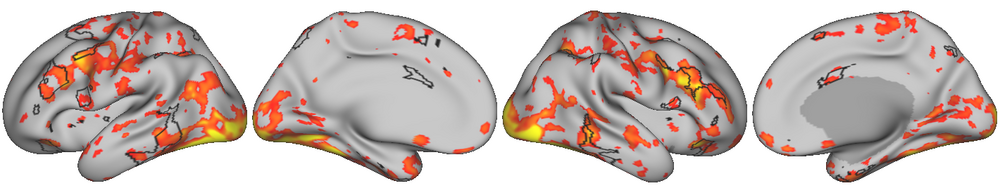
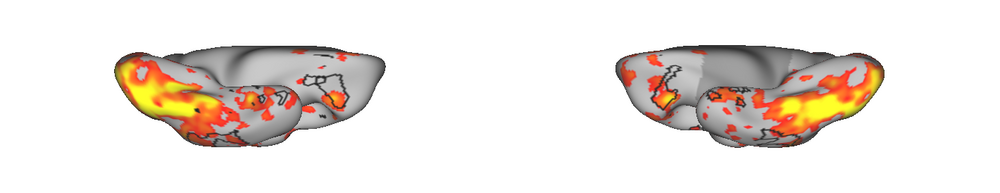
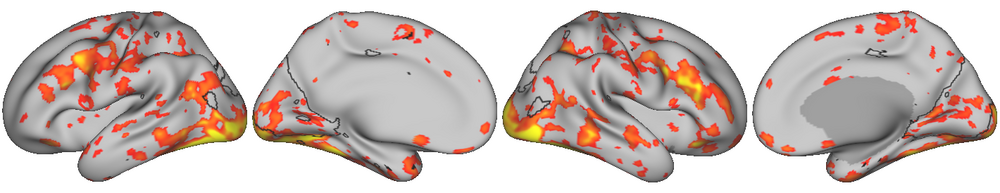
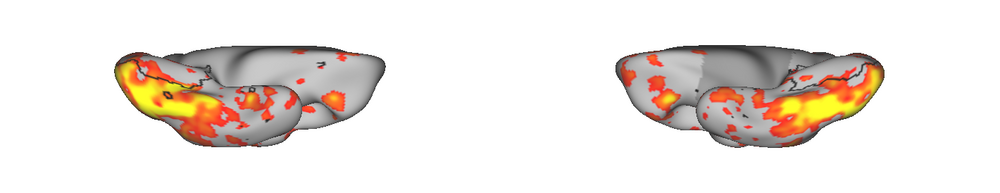
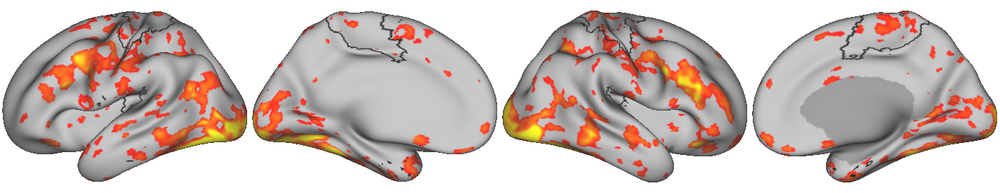
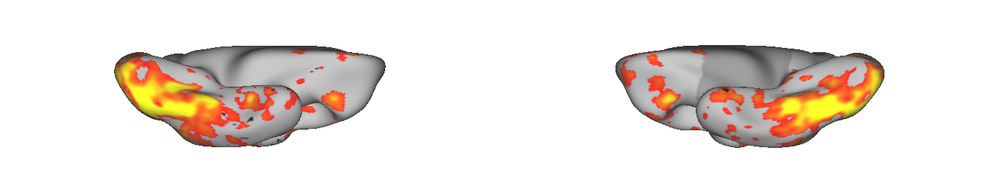
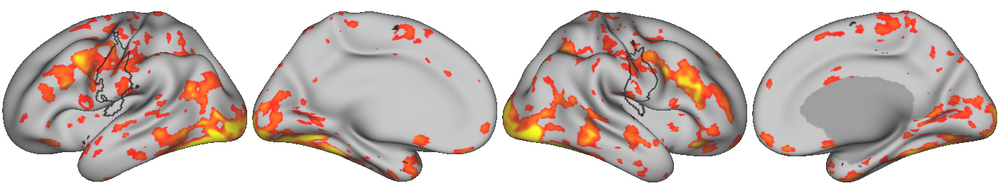
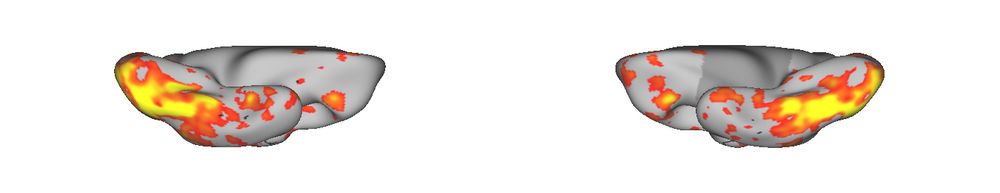
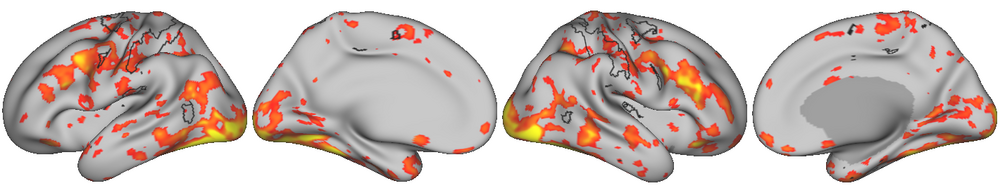
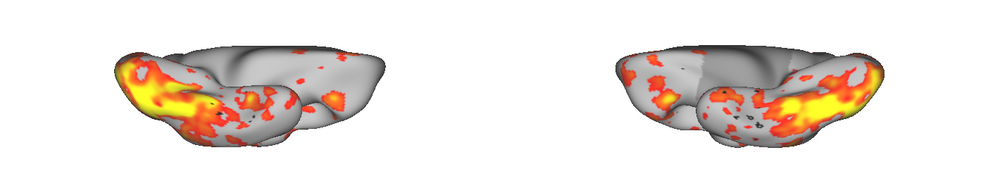
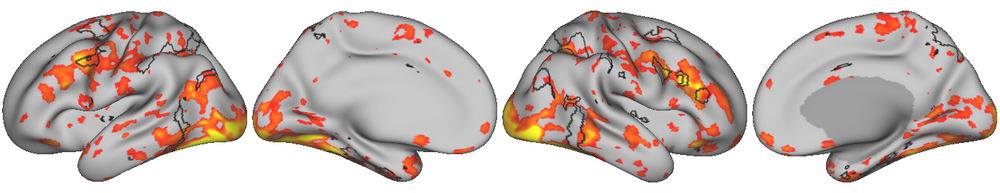
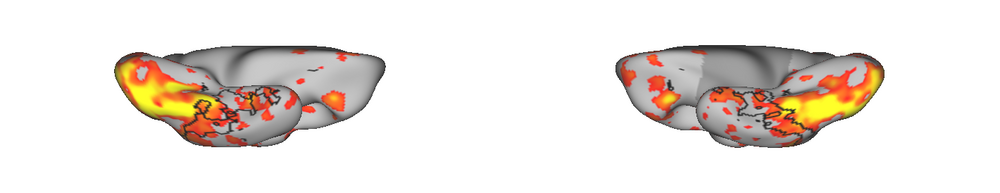
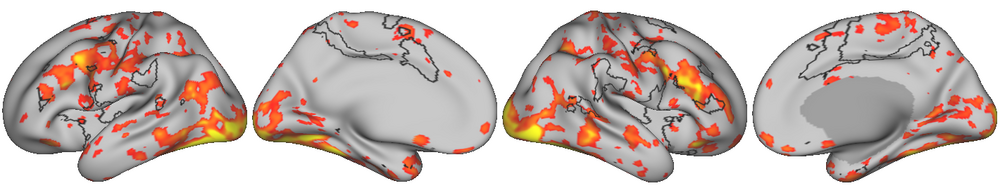
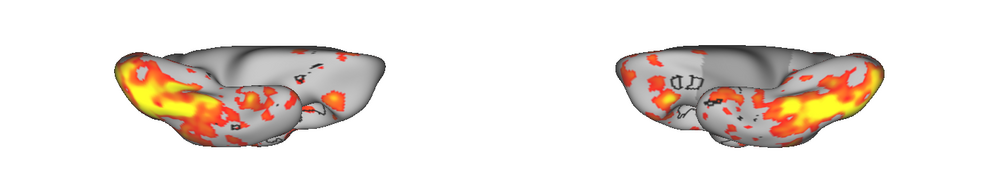
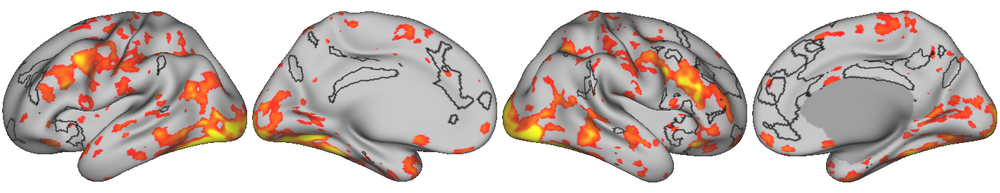
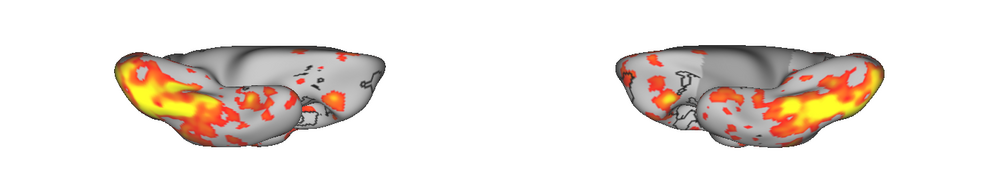
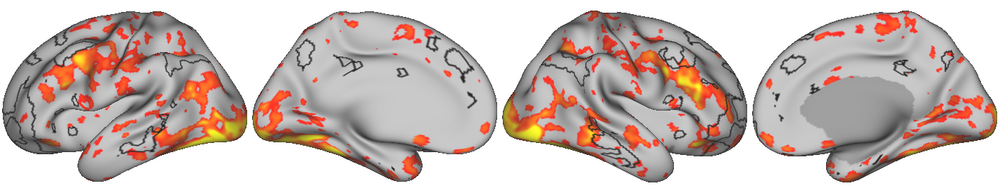
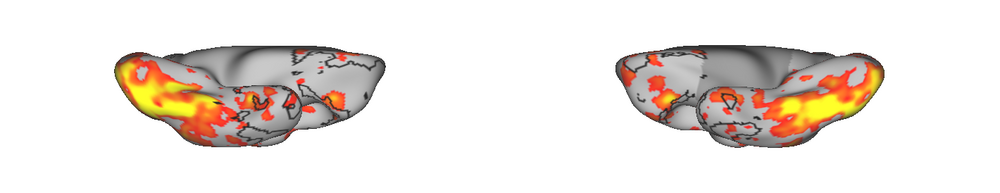
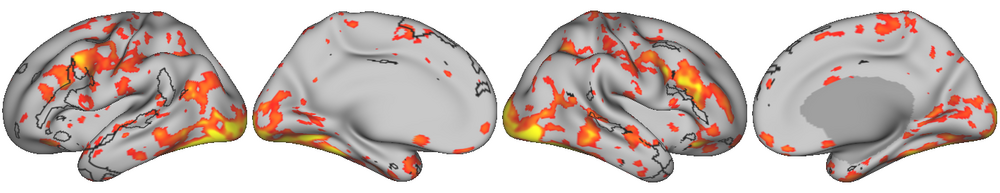
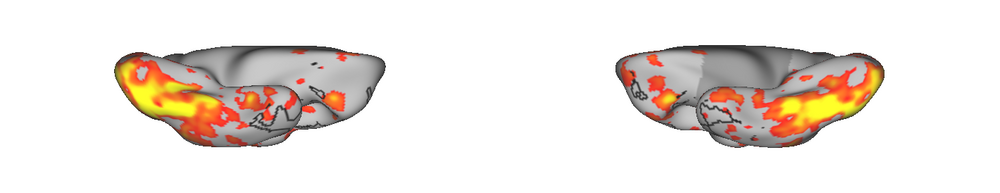
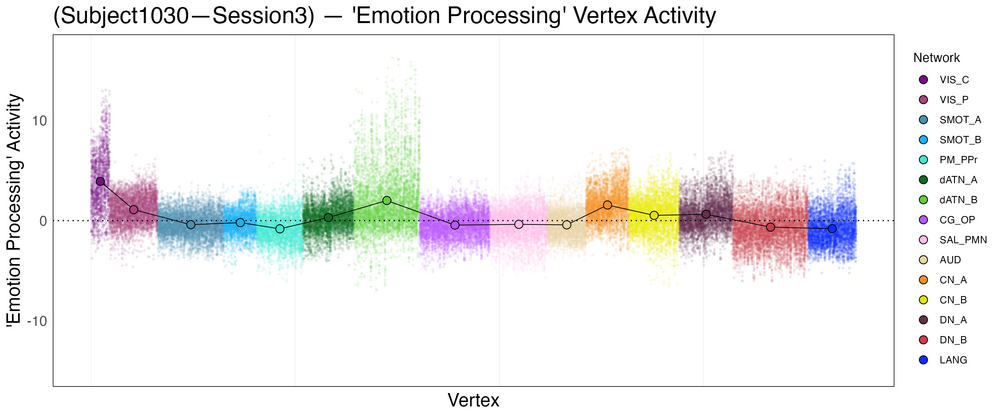
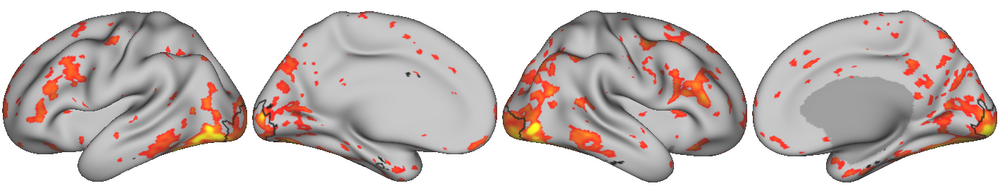
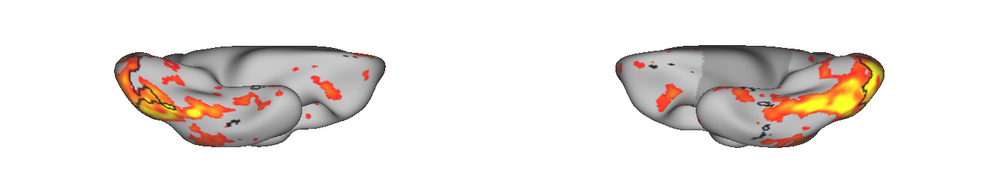
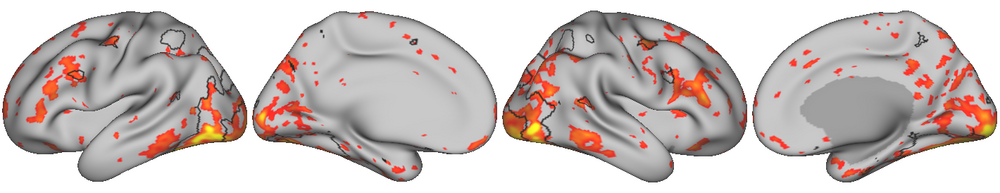
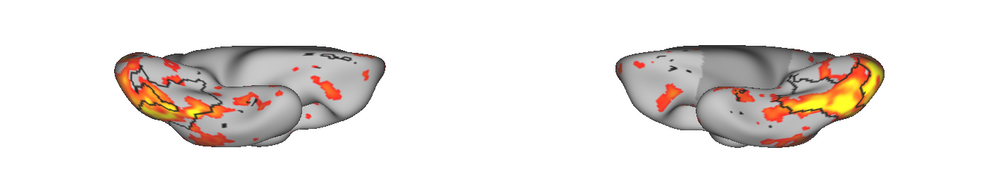
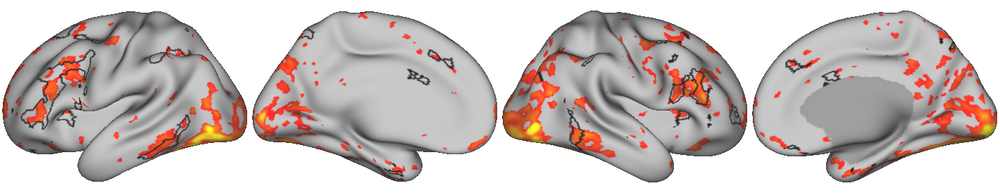
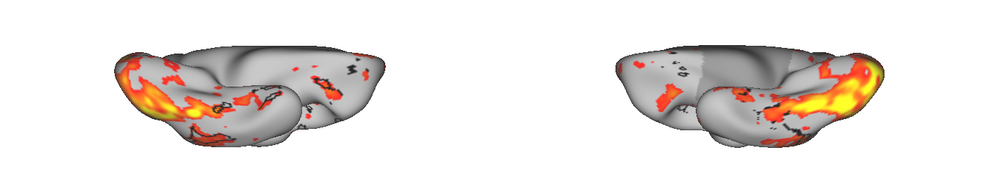
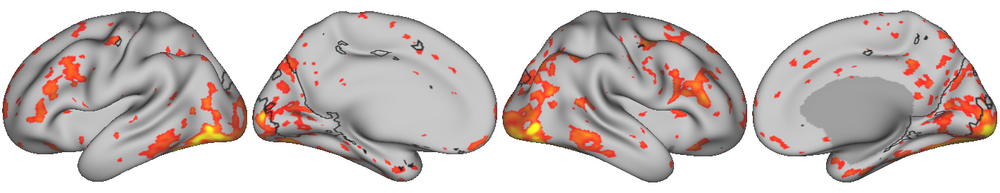
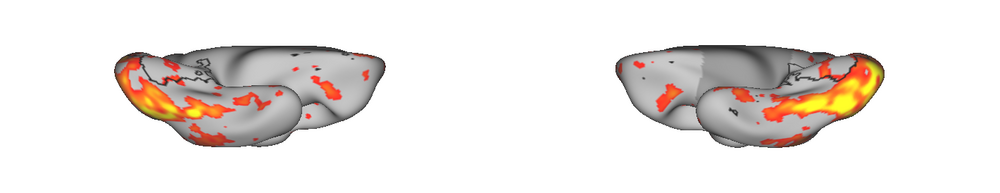
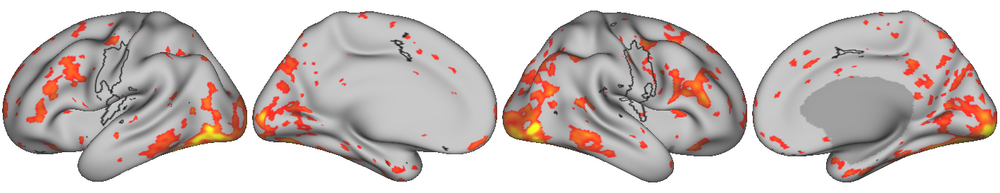
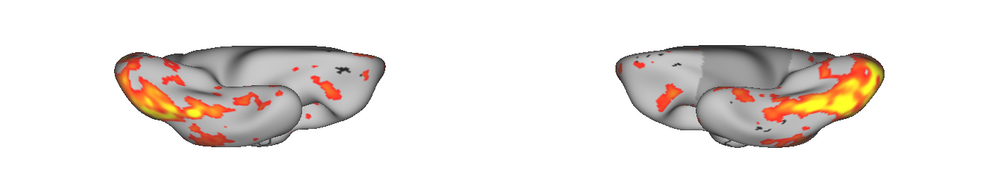
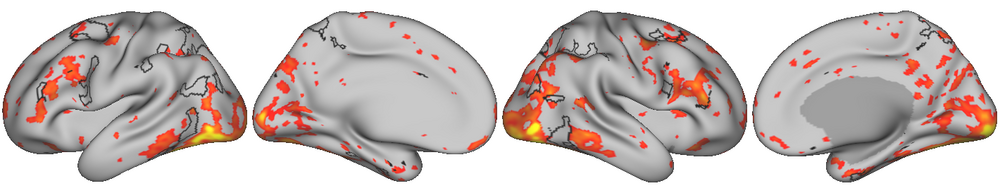
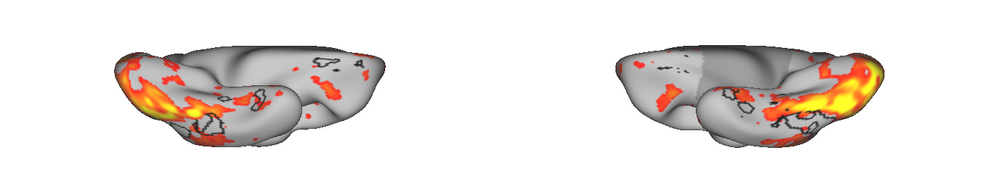
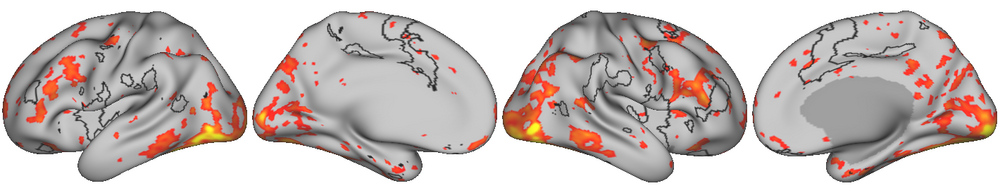
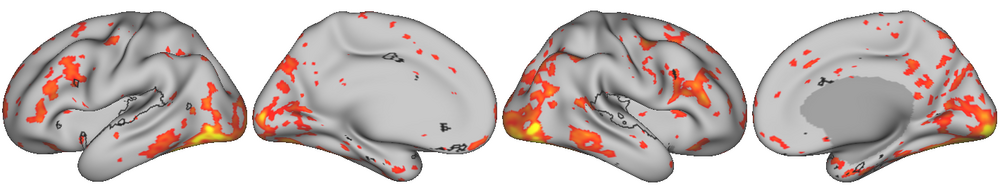
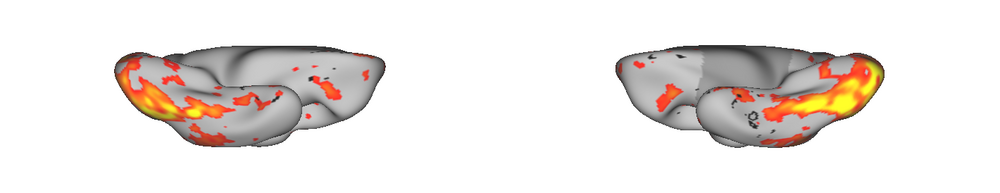
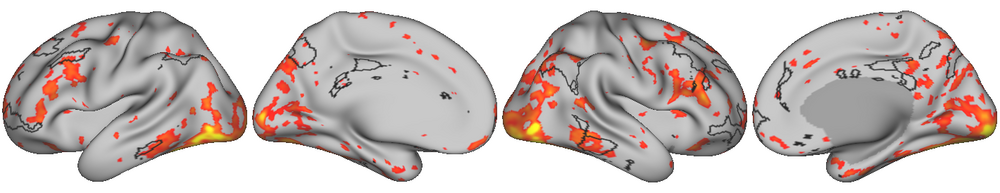
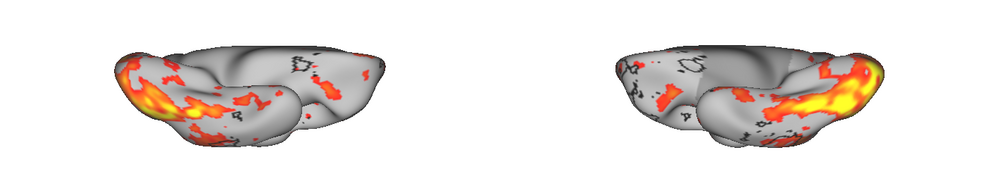
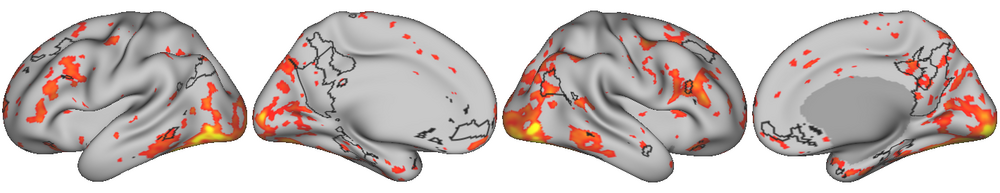
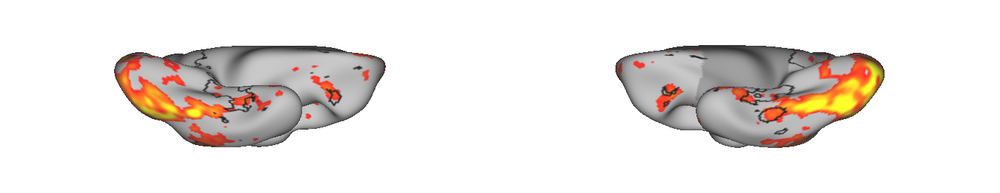
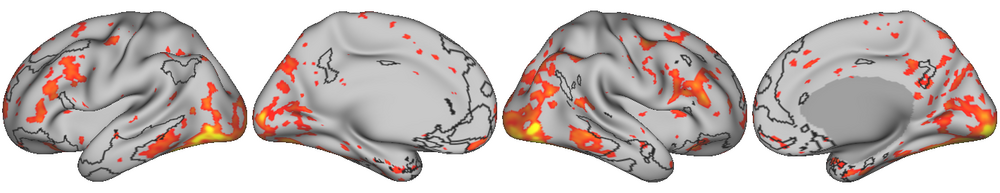
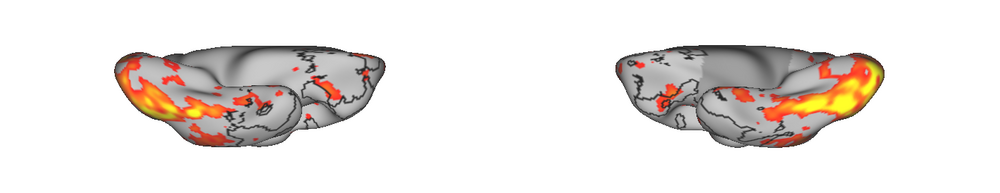
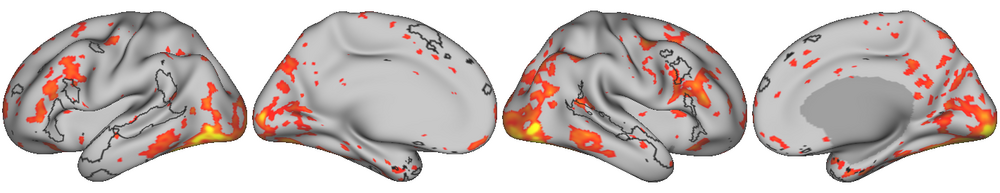
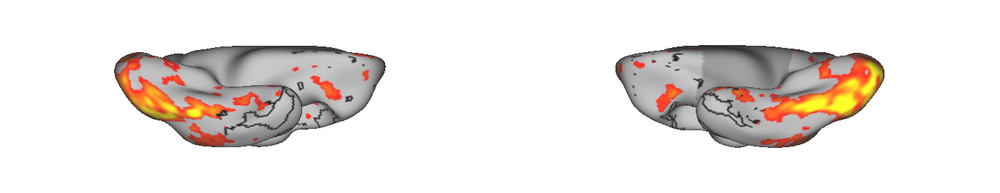
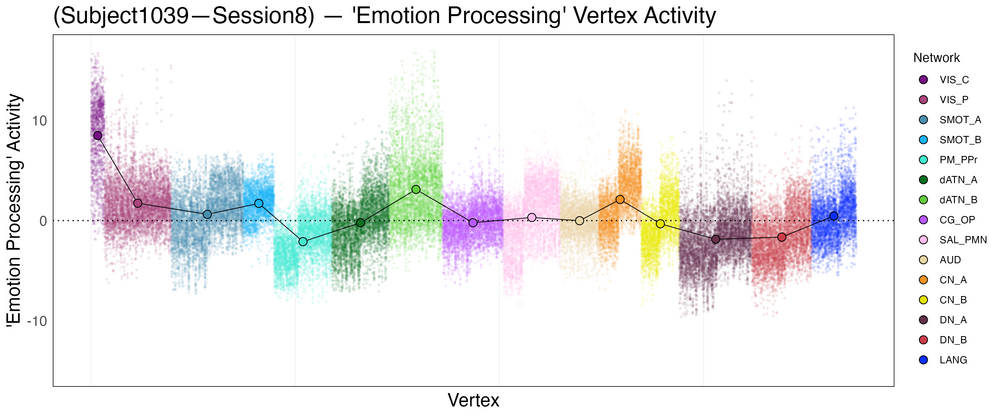
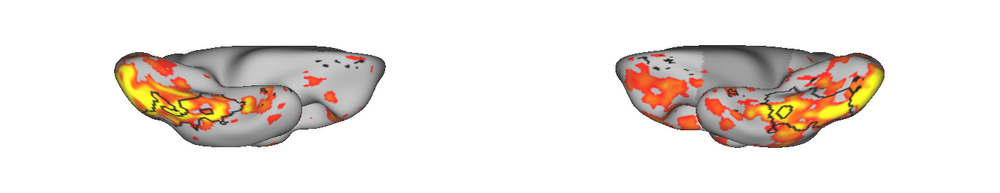
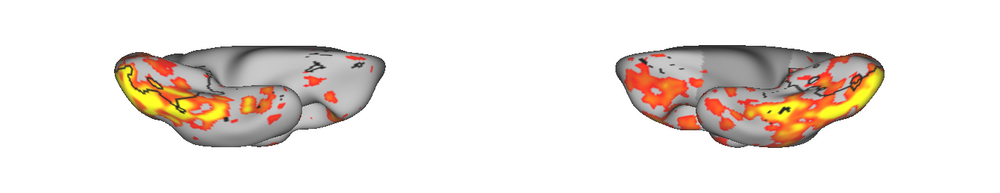
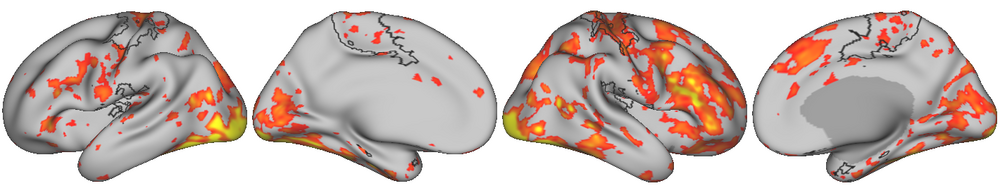
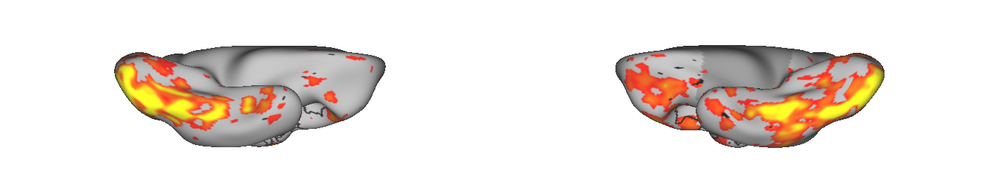
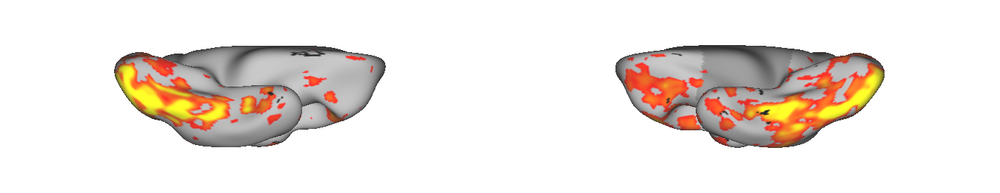
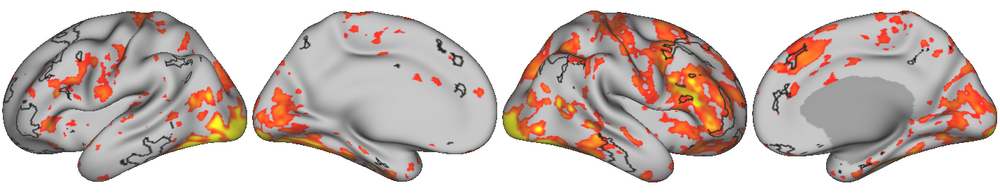
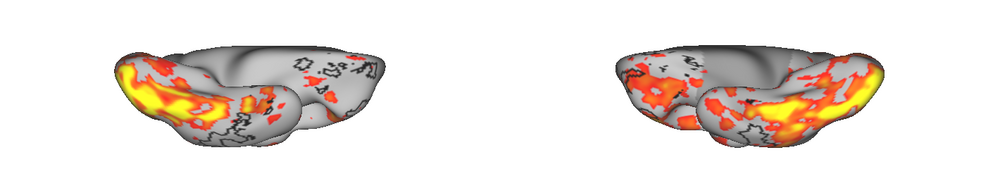
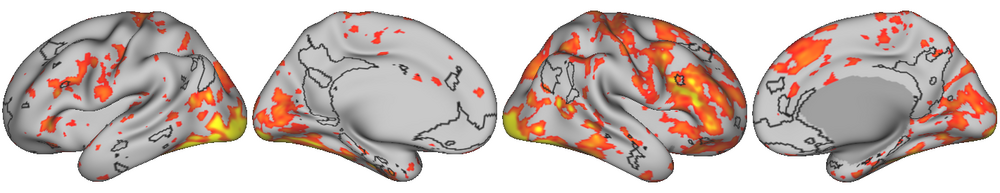
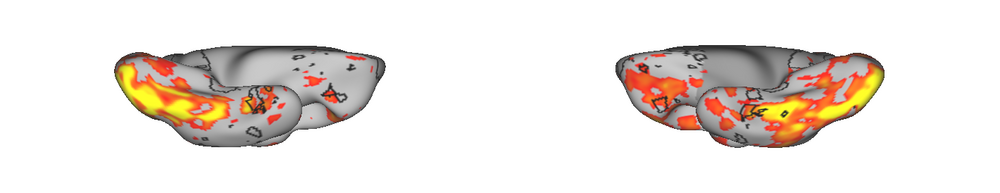
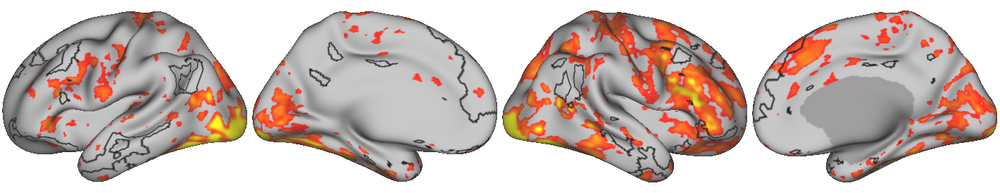
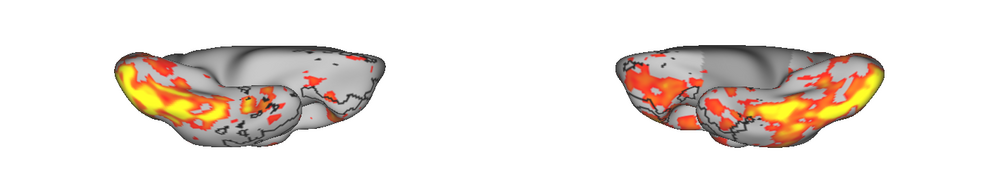
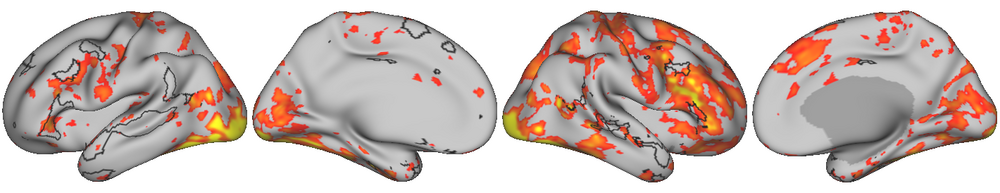
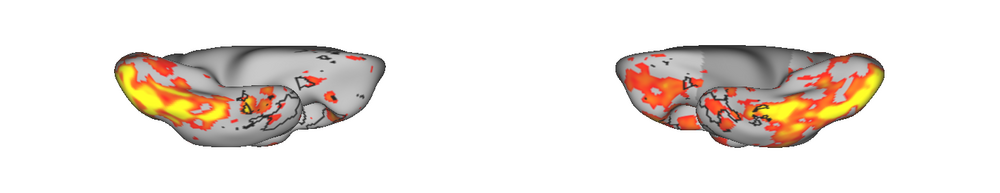
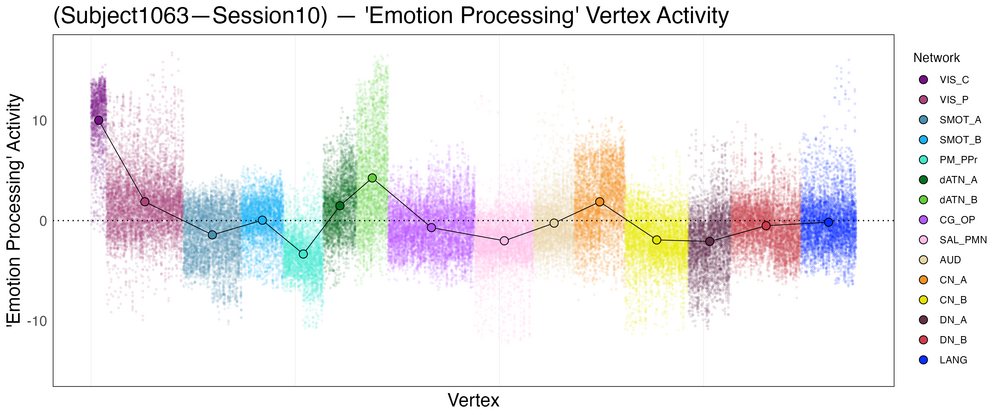
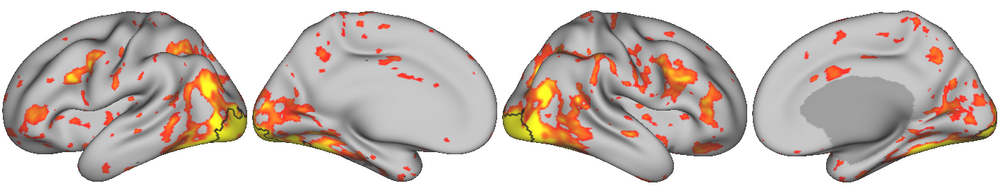
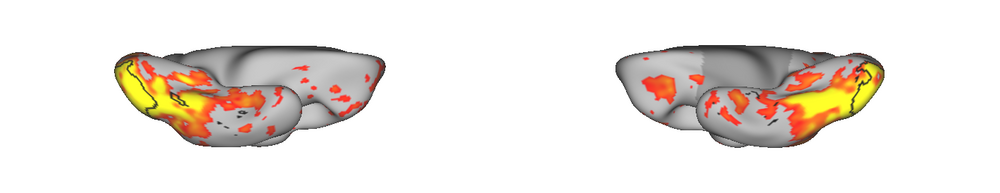
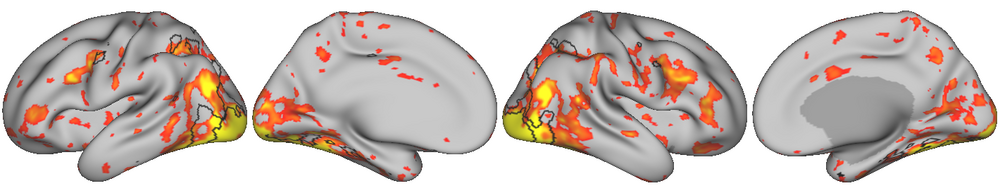
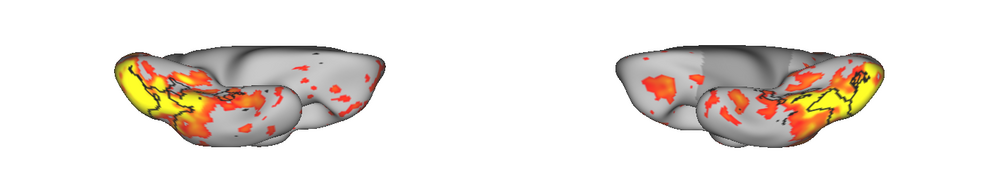
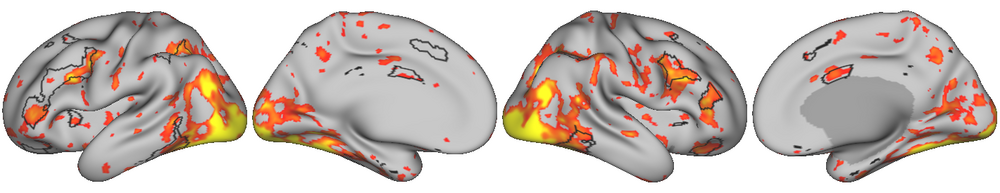
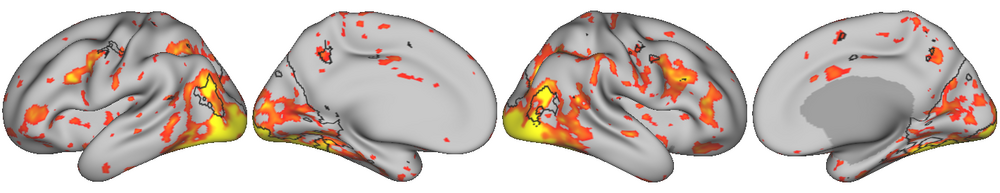
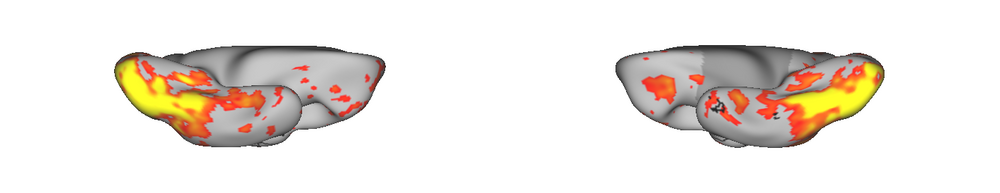
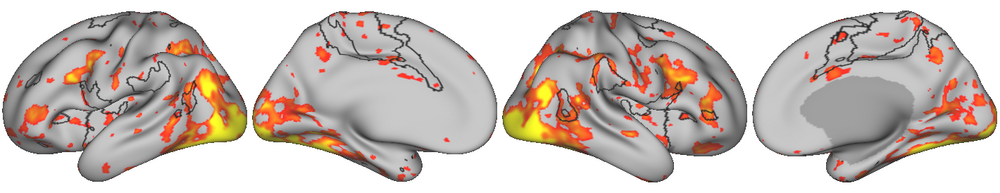
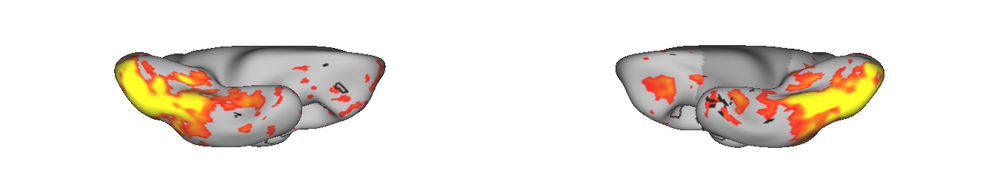
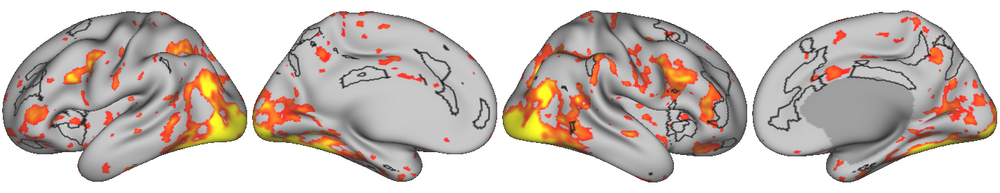
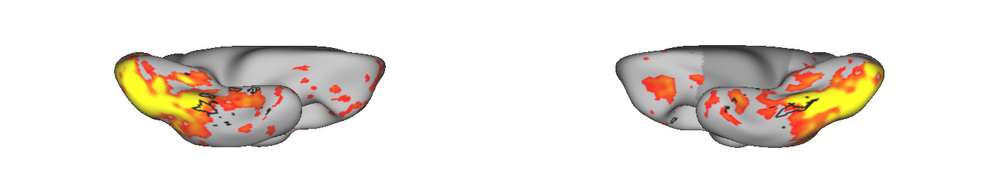
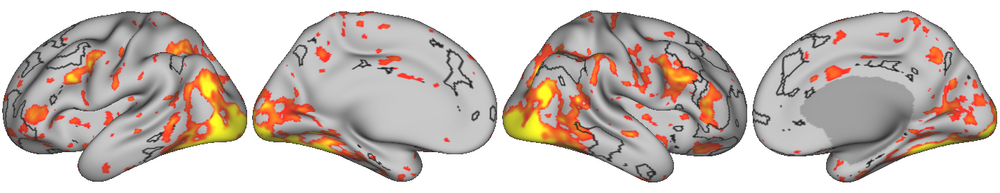
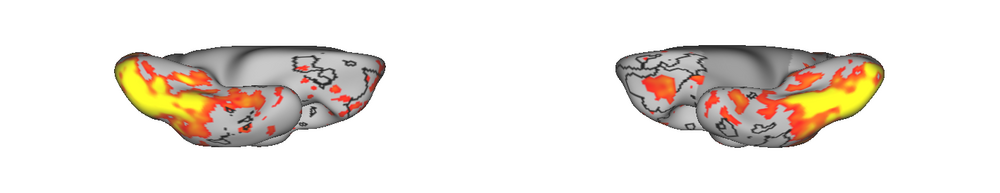
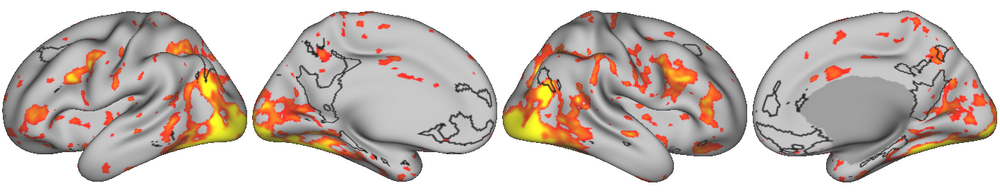
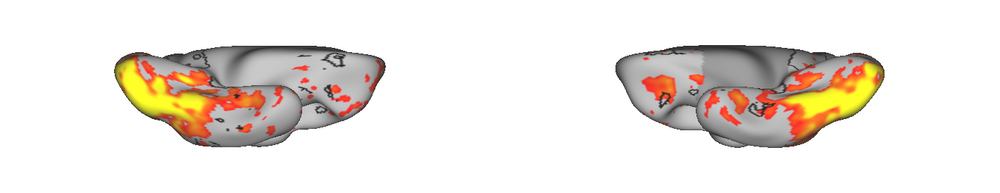
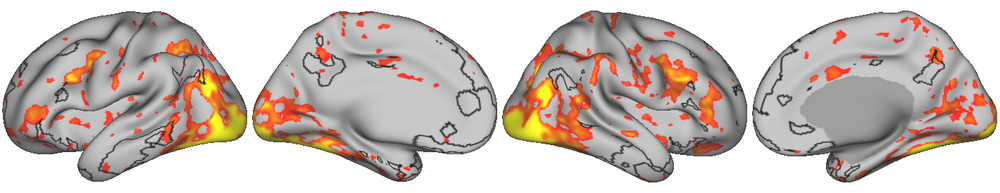
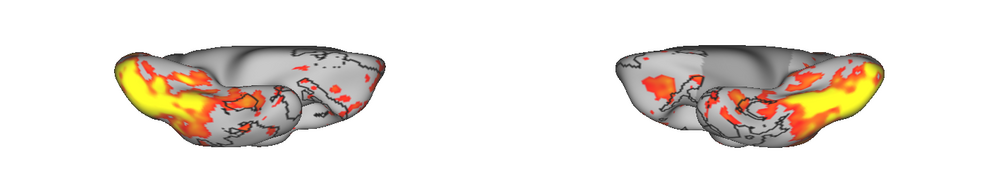
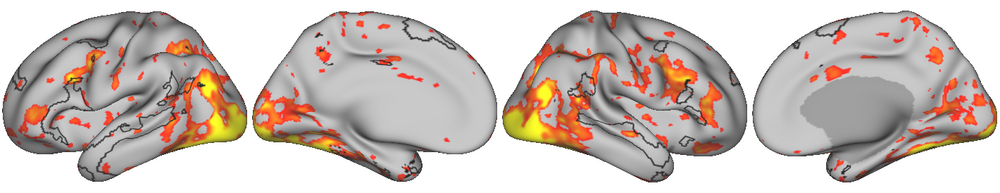
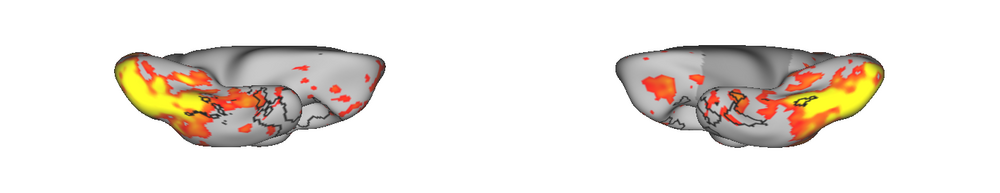
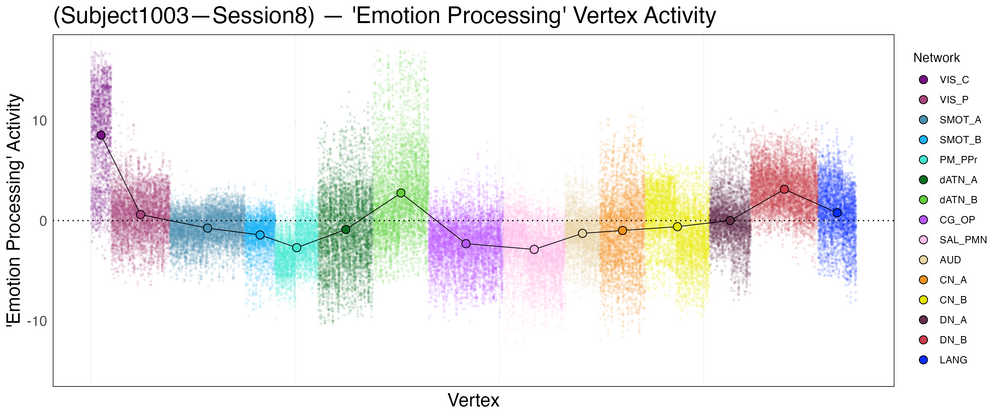
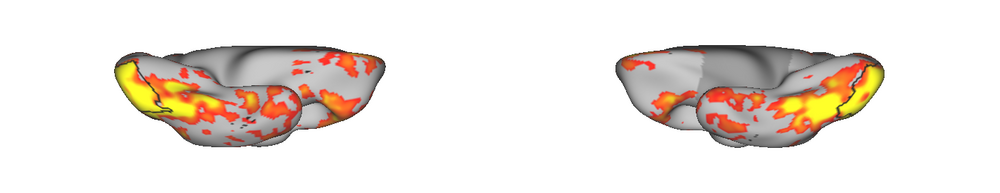
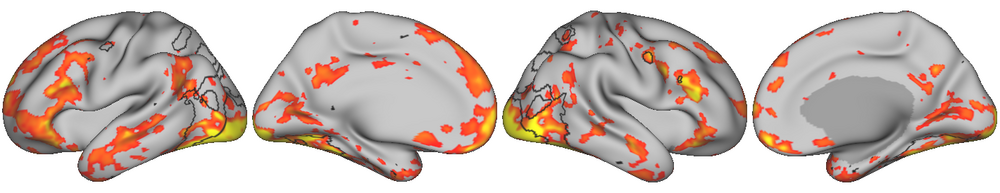
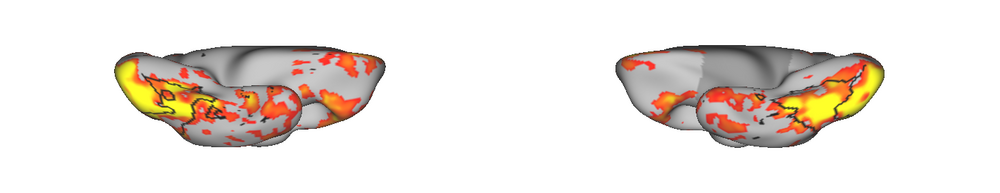
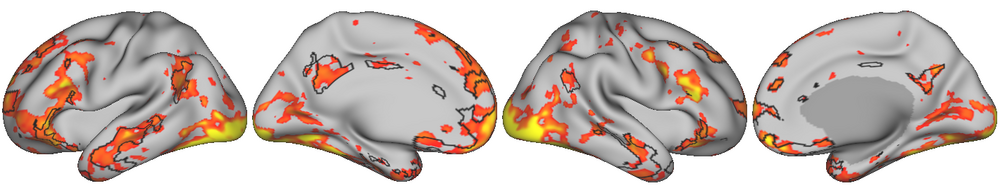
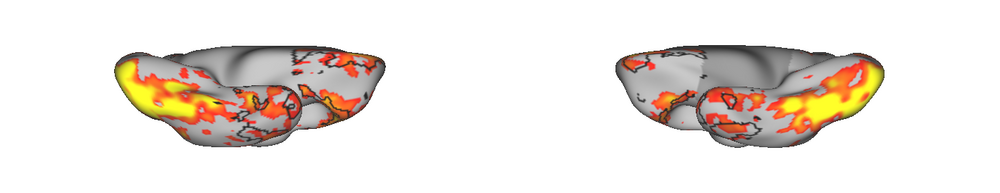
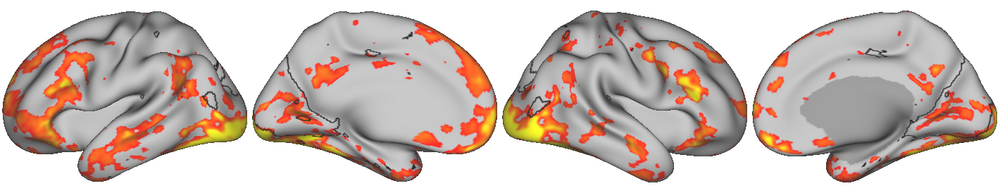
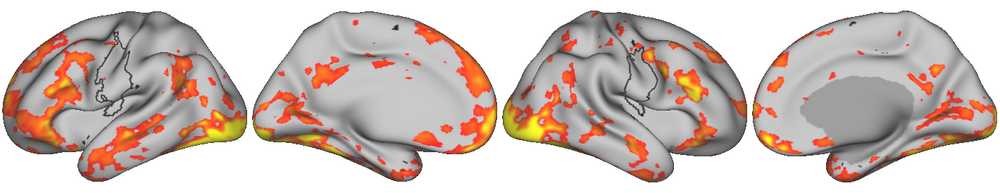
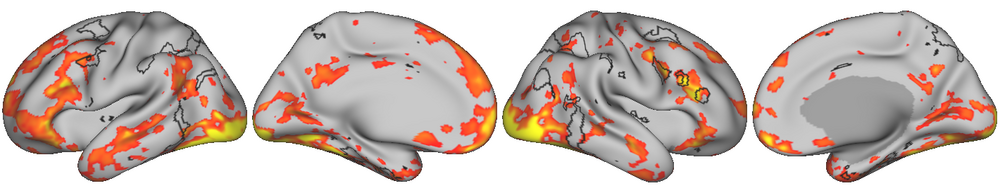
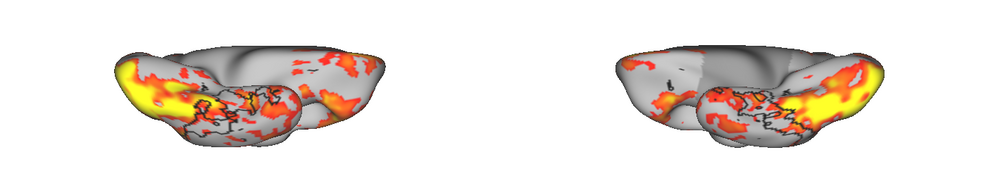
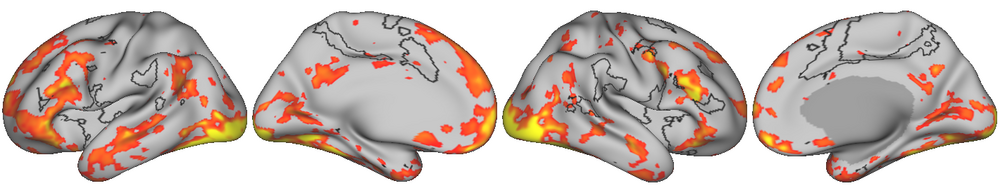
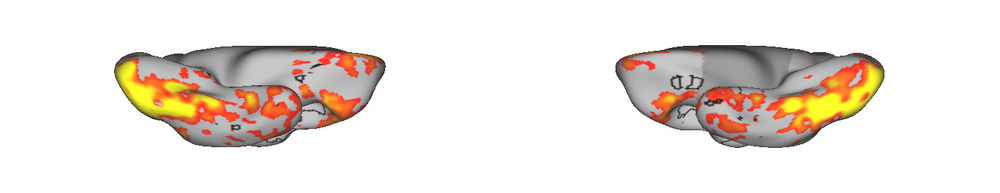
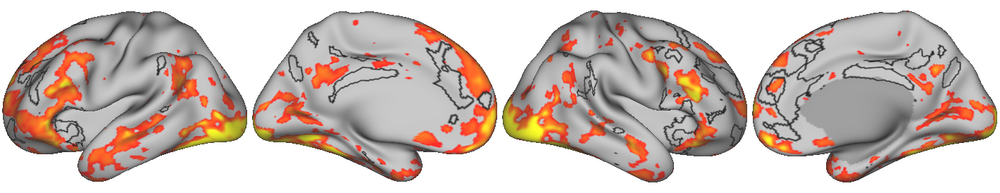
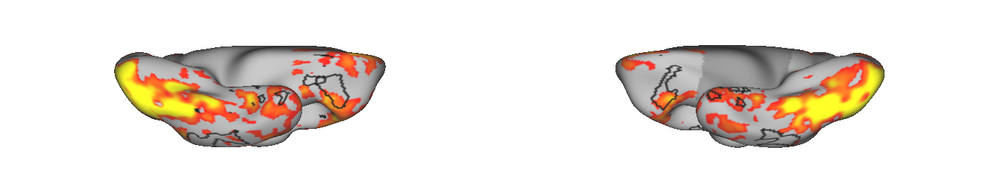
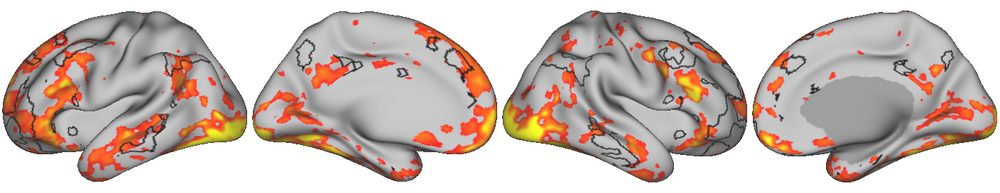
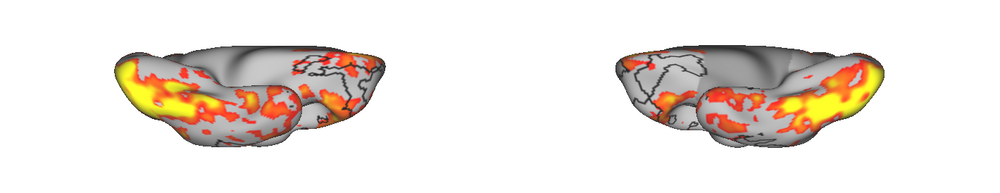
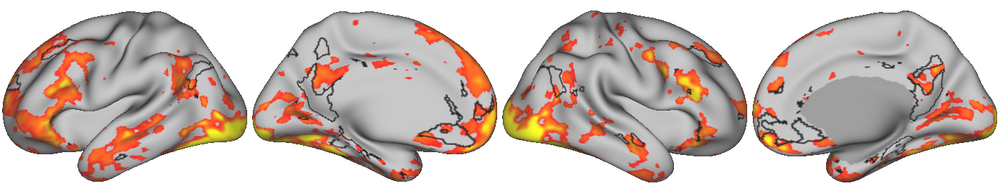
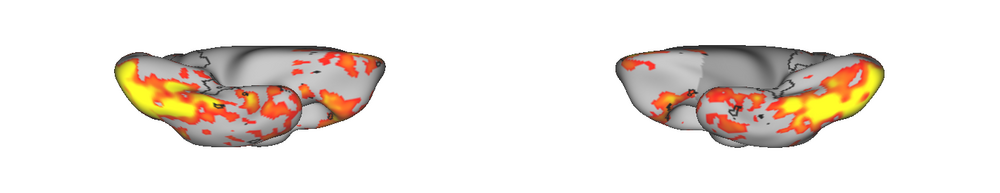
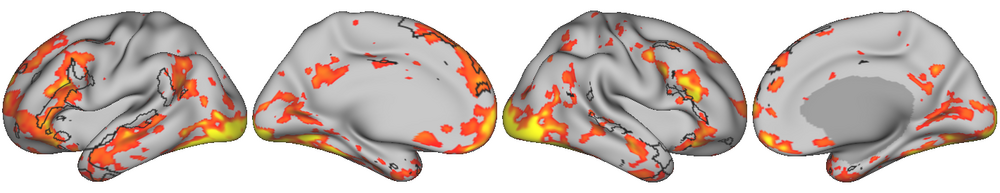
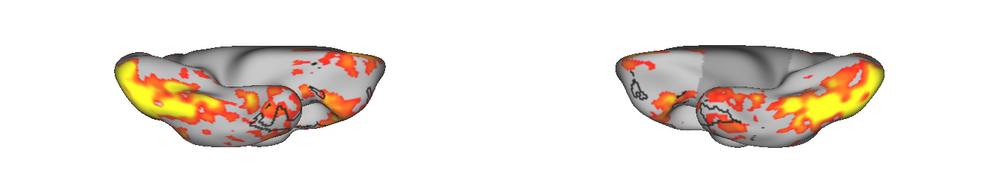
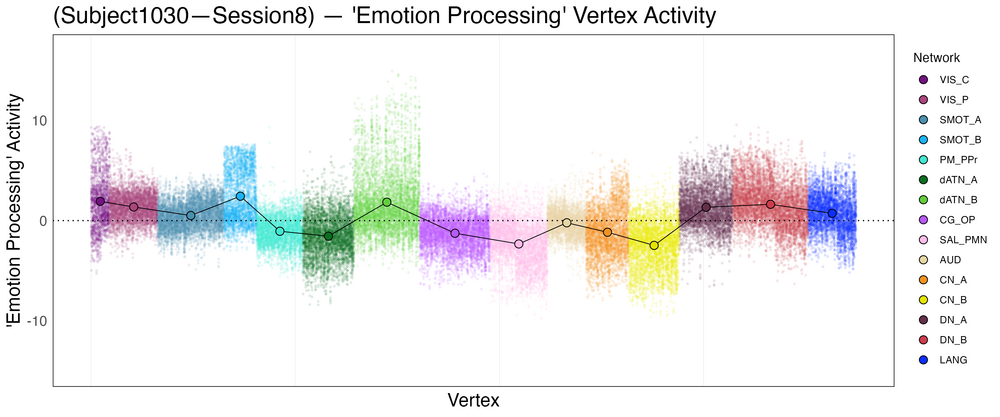
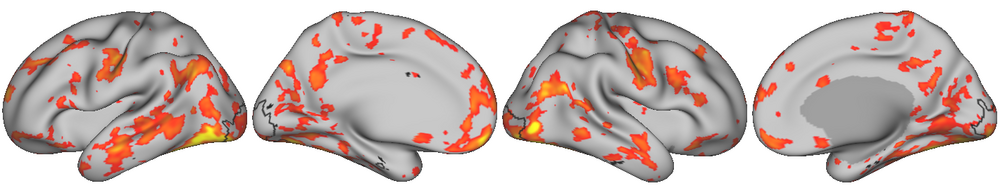
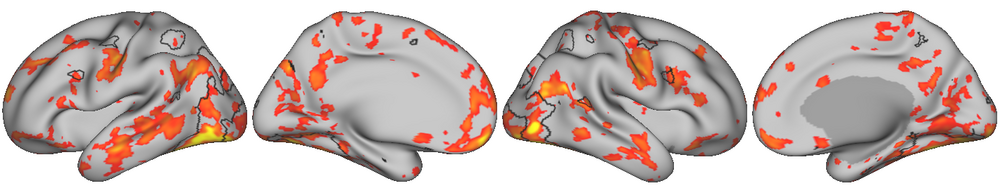
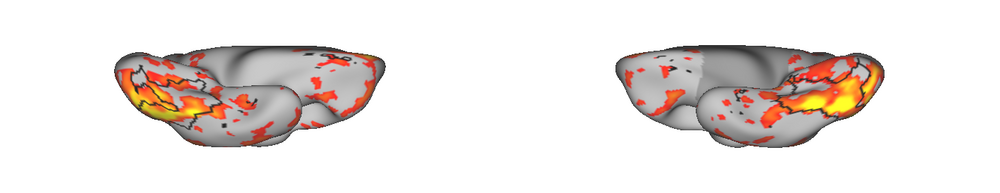
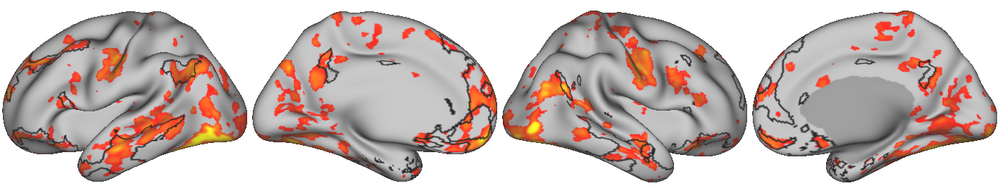
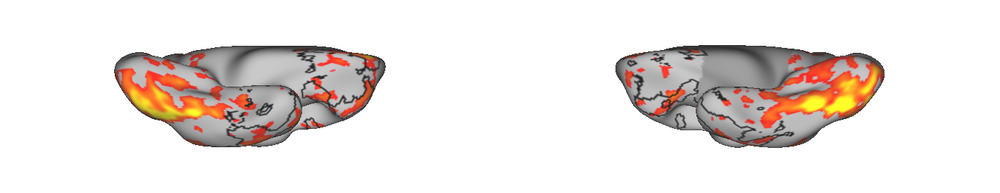
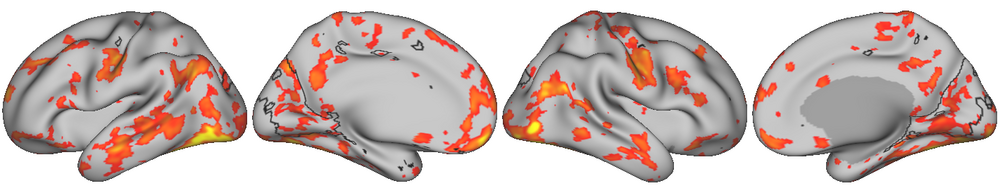
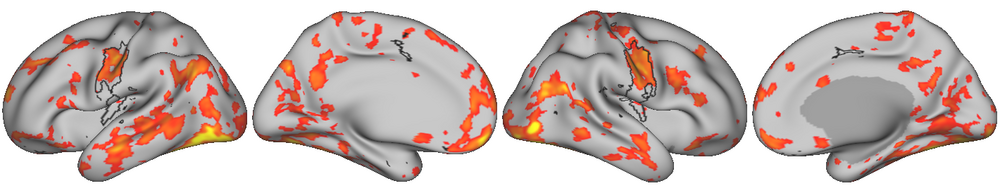
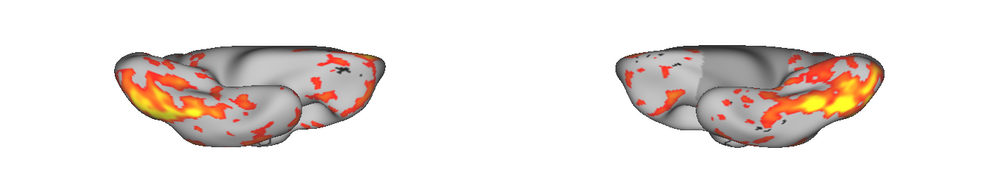
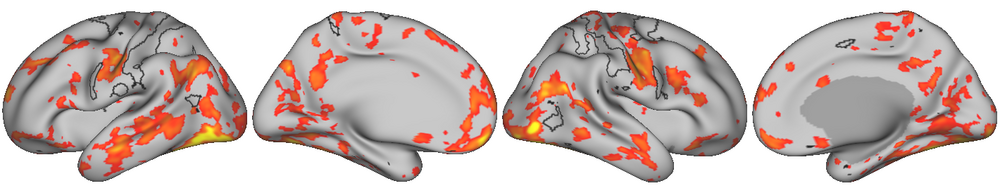
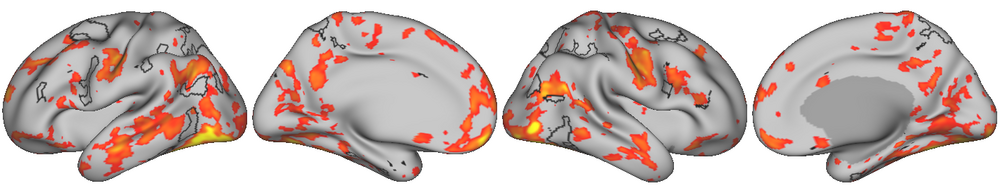
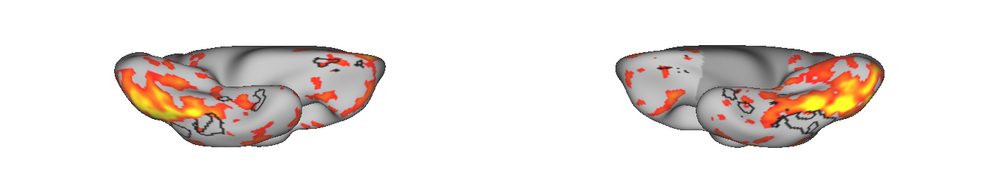
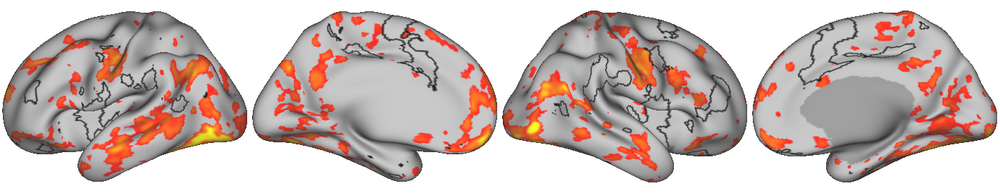
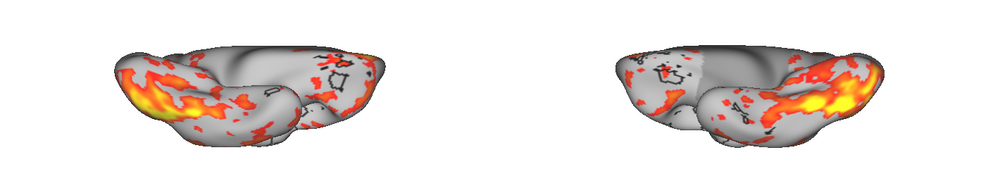
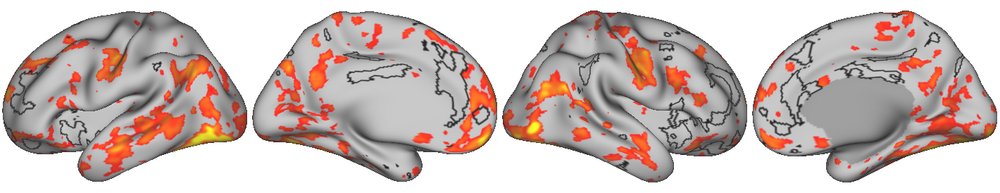
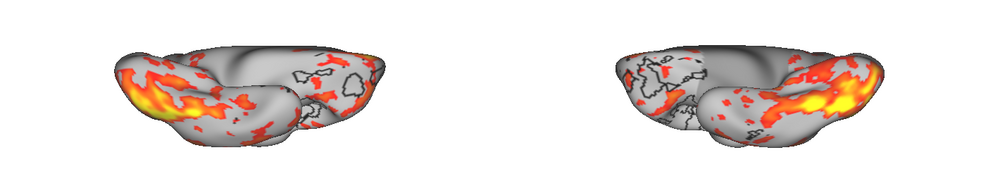
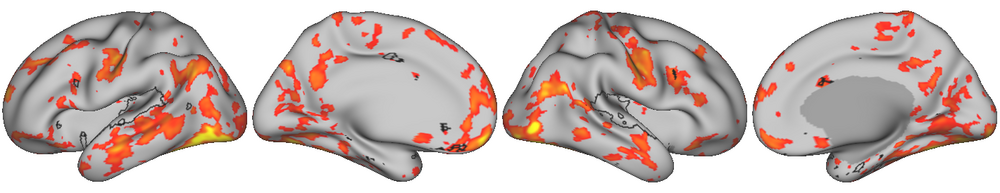
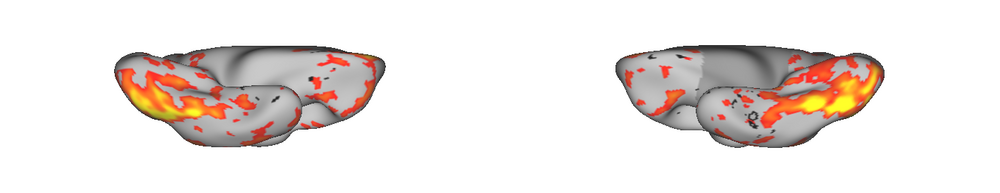
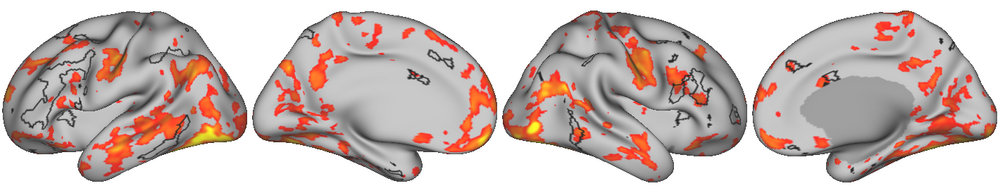
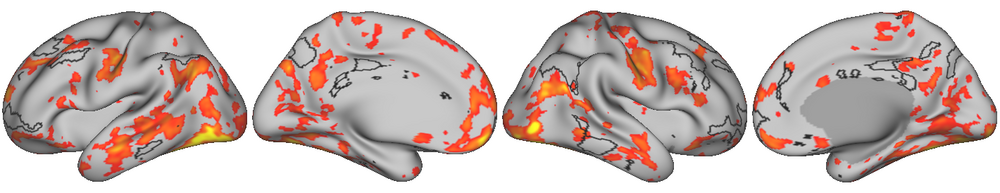
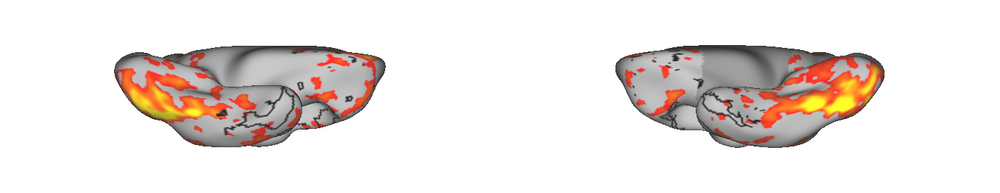
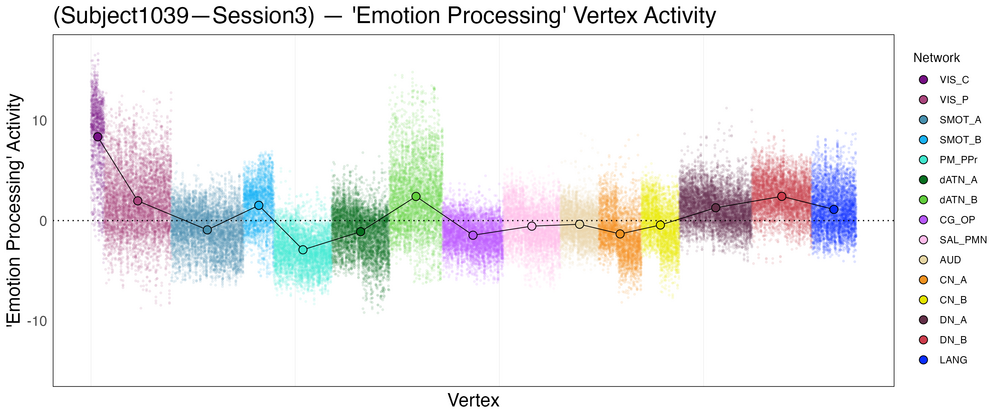
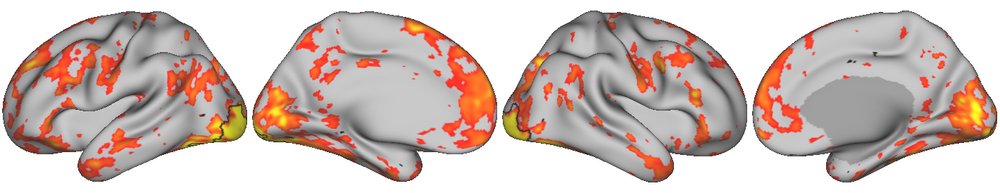
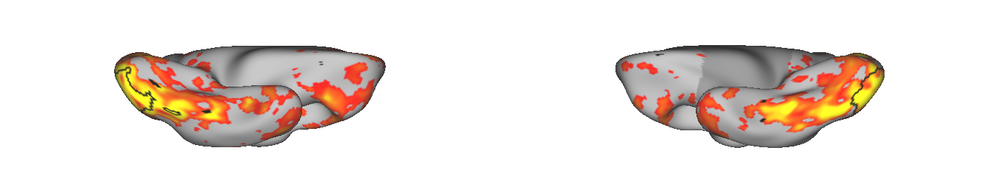
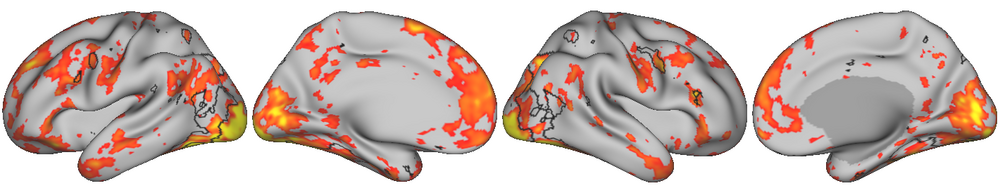
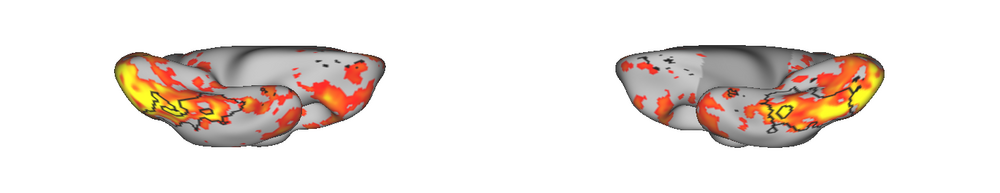
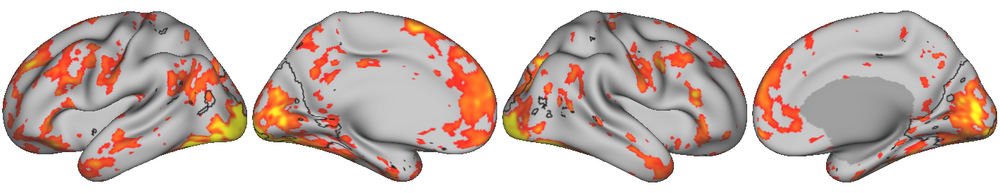
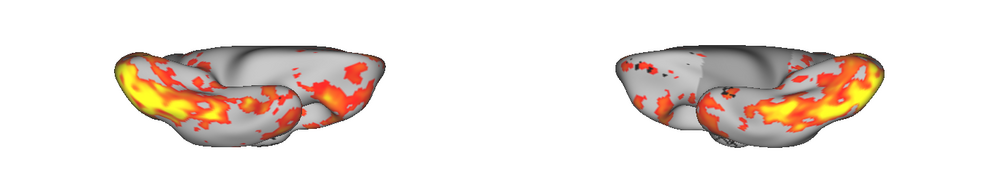
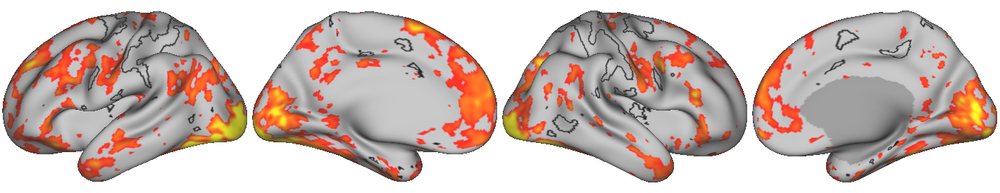
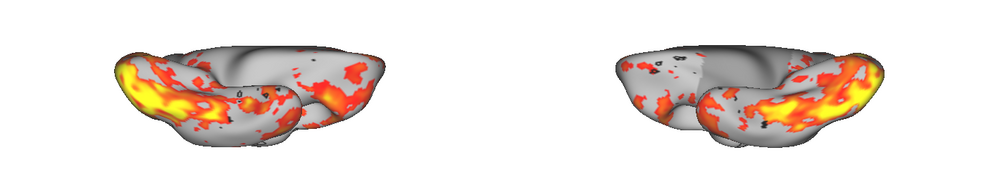
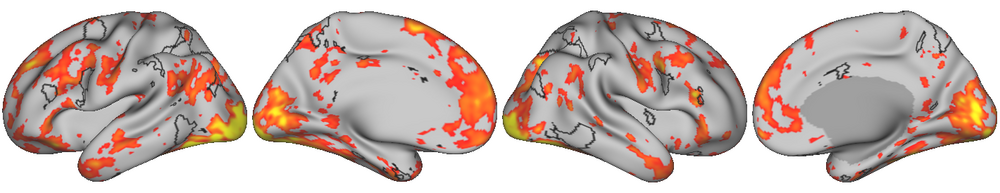
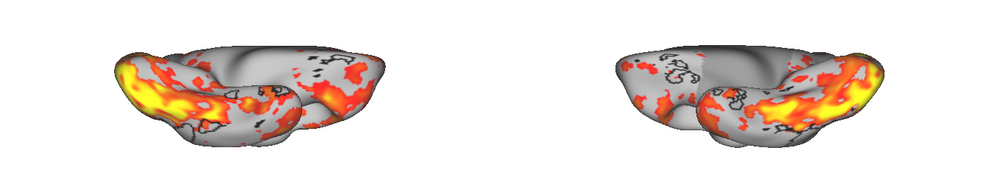
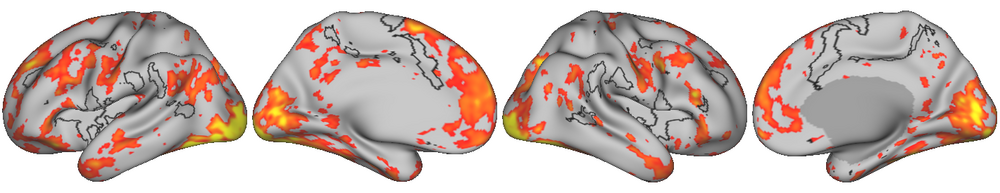
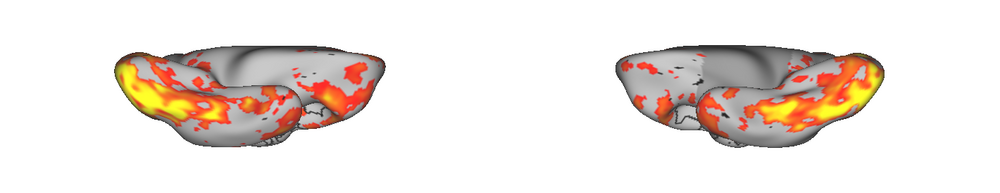
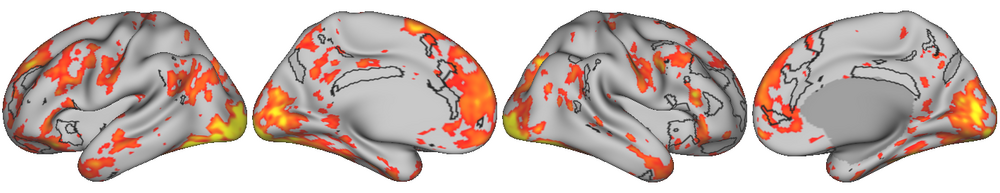
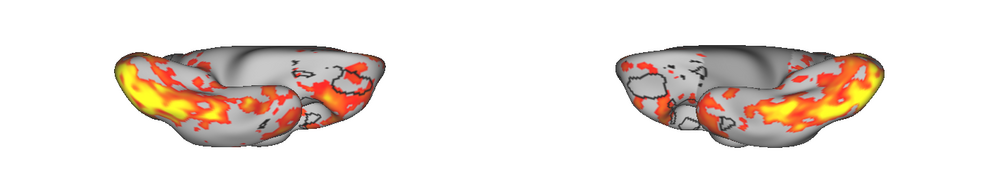
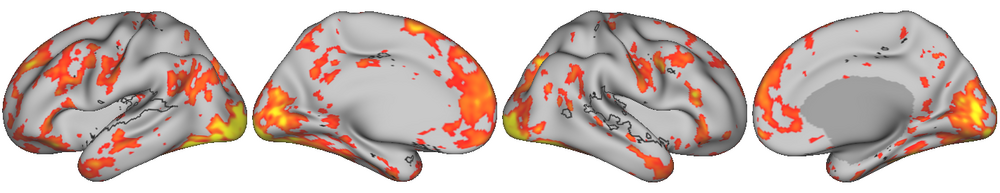
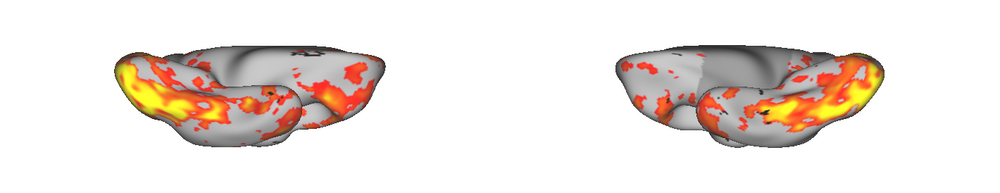
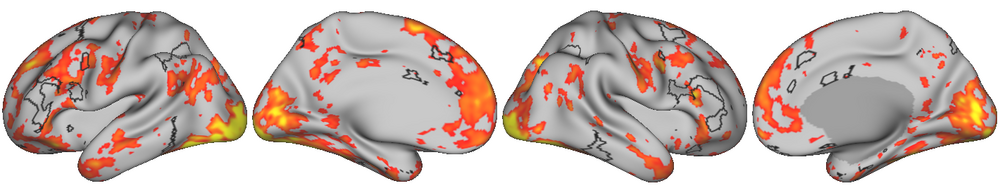
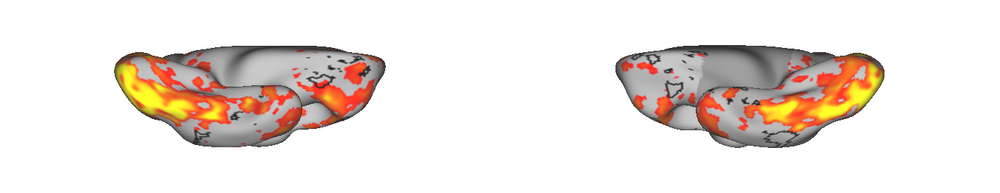
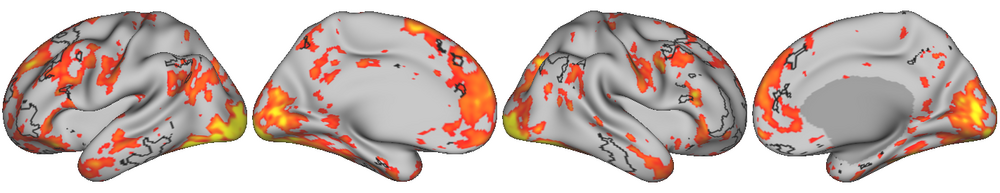
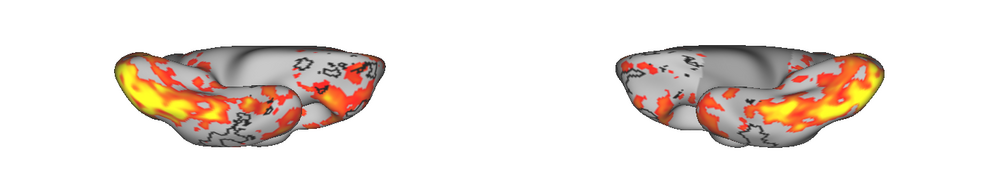
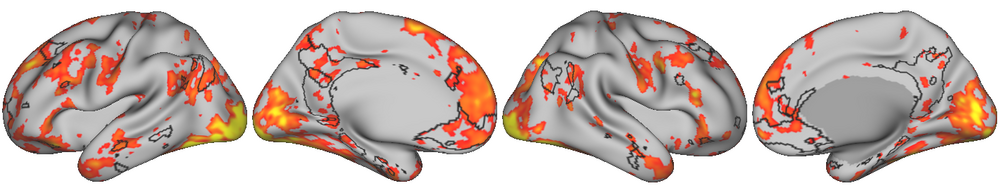
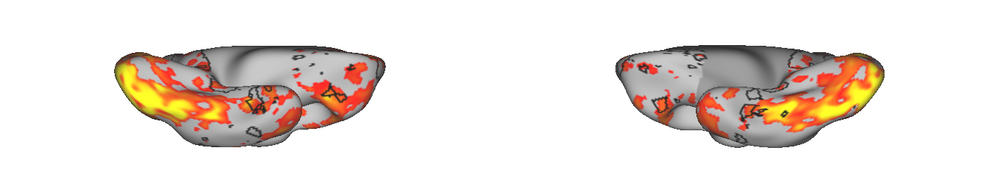
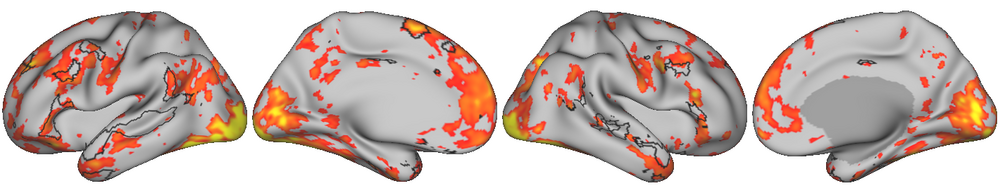
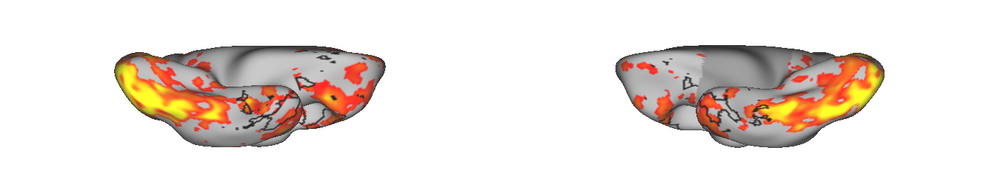
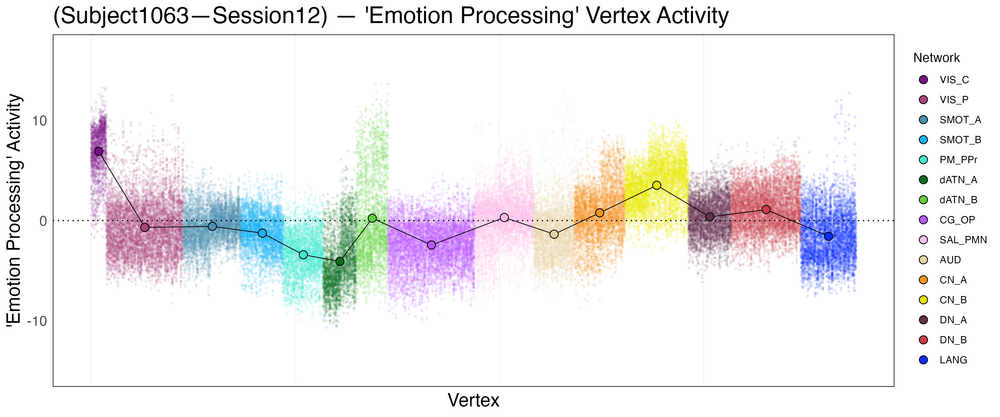
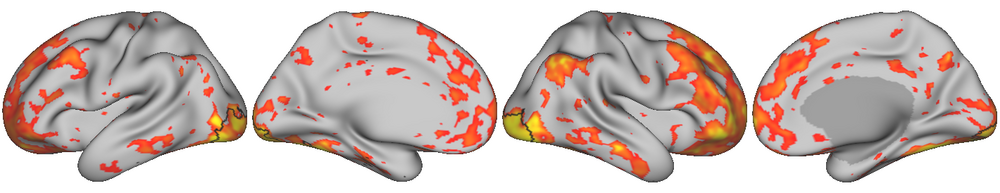
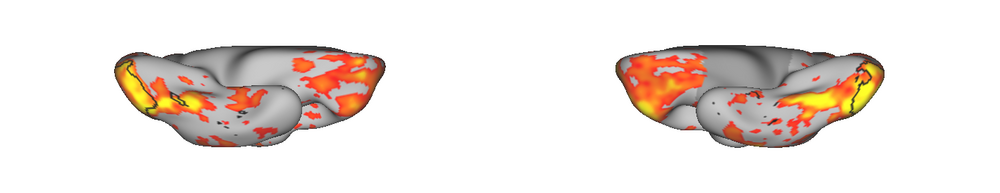
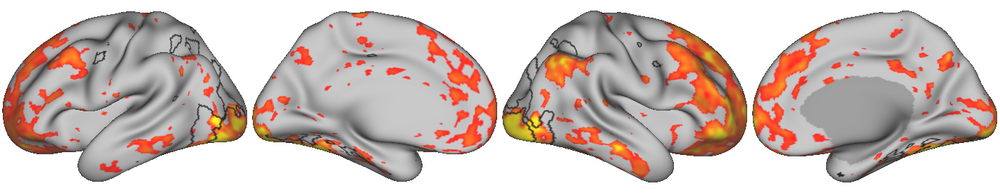
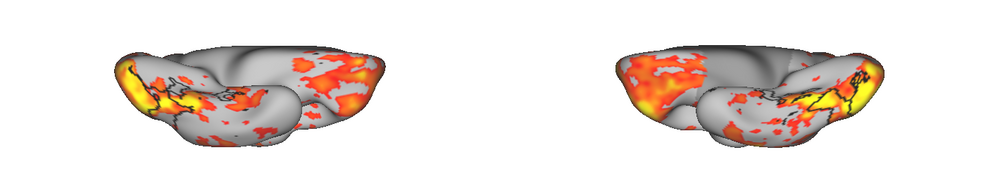
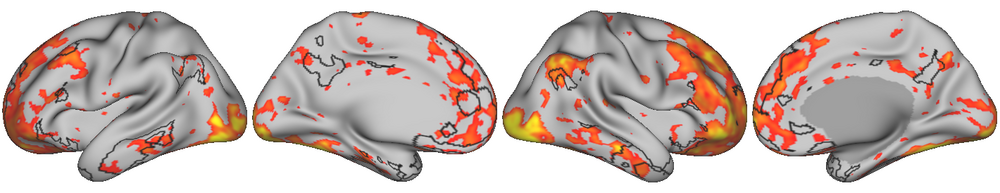
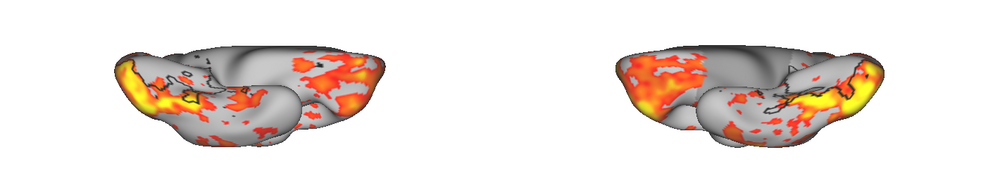
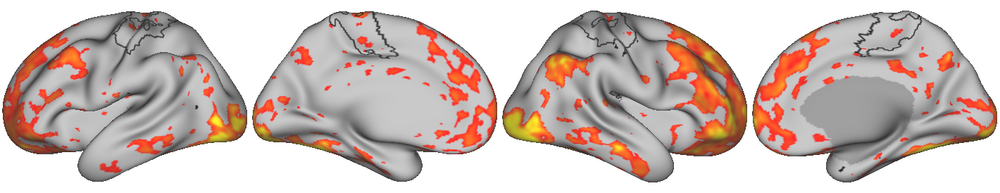
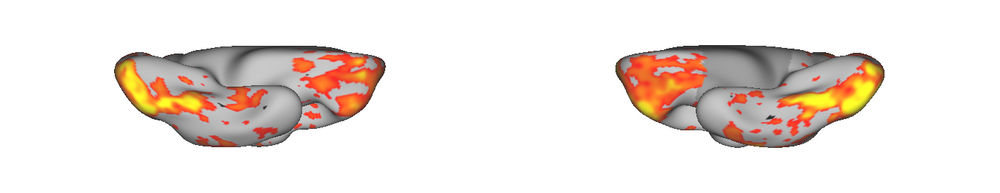
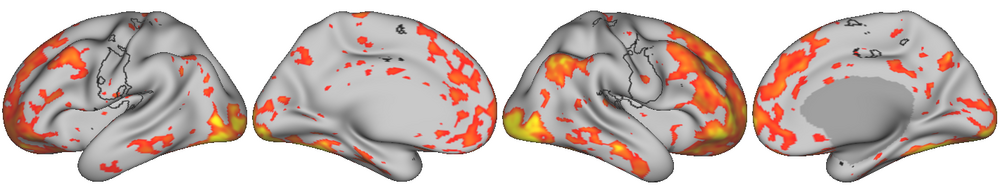
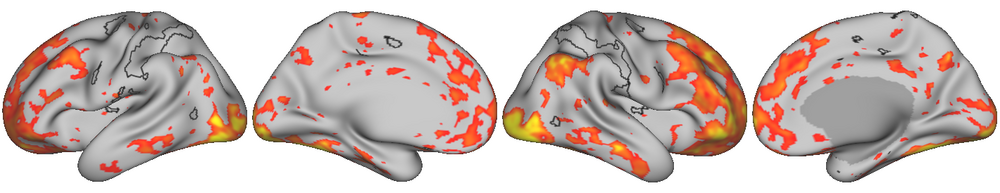
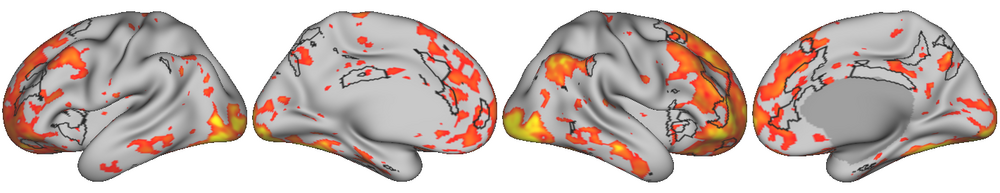
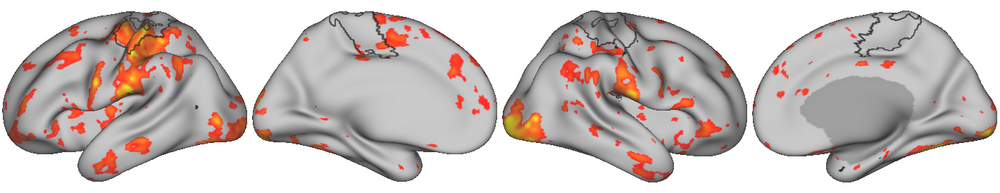
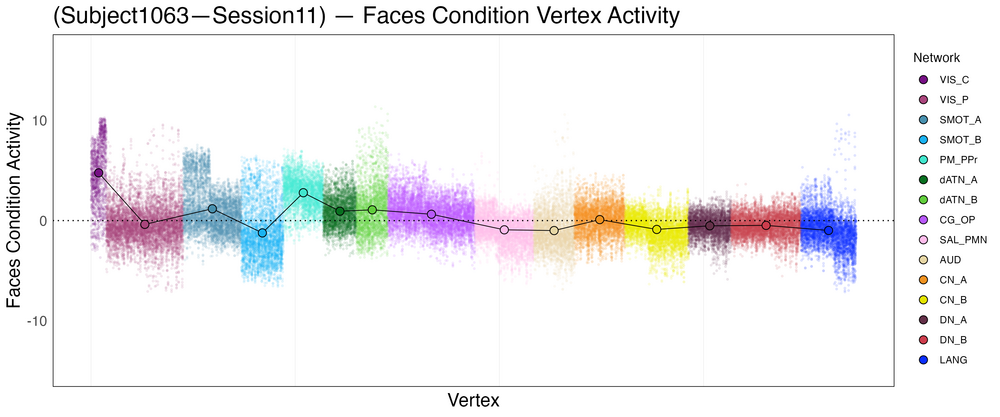
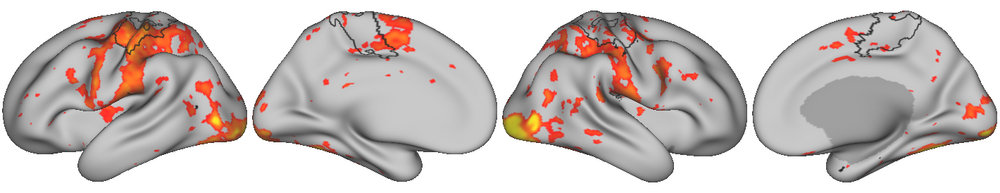
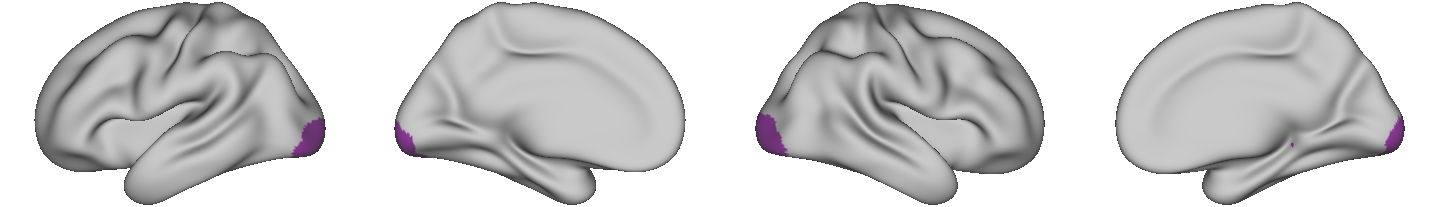
I will begin by simply visualizing the vertex-level activity for a set of sessions from a subset of subjects. For the sake of brevity, I will only examine vertex activity for the ‘emotion processing’ activity within the individualized networks. Below, you will see the vertex activity plotted by network . In these vertex activity plots, you will be able to see the distribution of activity across all vertices that fall within a given network. Below each vertex activity plot, you will see the network-activity overlays, where images of the actual ‘emotion processing’ activity (for the given session) is displayed with each network boundary (black outline) overlayed on top. You will be able to click through the various networks to examine the extent to which the observed activity is bounded by a given network. These two visualization techniques will allow you to gain a visual intuition for how activity during ‘emotion processing’ manifests.
For these examples, I selected a subset of subjects who performed extremely well on the task to ensure that I are visually examining the most robust ‘emotion processing’ activity. Subjects 1003, 1030, 1039, and 1063 were the top performers and maintained ~90% task accuracy or above on all sessions.
While reviewing all the session-level activity across all the subjects, I noticed that most subject-sessions contained the expected increase in activity in the visual-central network (VIS-C) and dorsal attention network (dATN-B), as was found in the boundary activity analysis. However, I also noticed that a consistent and distinct subset of subject-sessions additionally exhibited notable increases in activity in control network A (CN-A), as well as other sessions that showed notable default network A (DN_B) activity. While activity within these additional networks was not consistent enough to come out in the average, I elected to highlight them in this section, as enough sessions exhibited these patterns and the network-level activity was robust.


[INSERT NOTE ABOUT ACTIVITY VISUALIZATION THRESHOLDS]
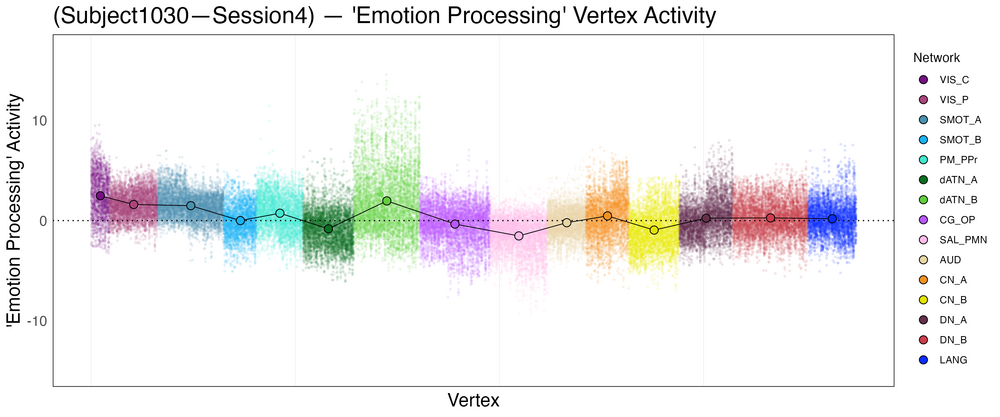


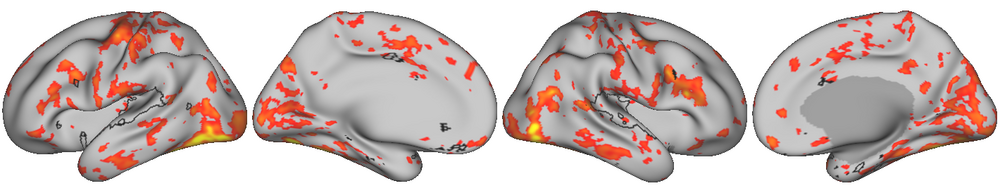


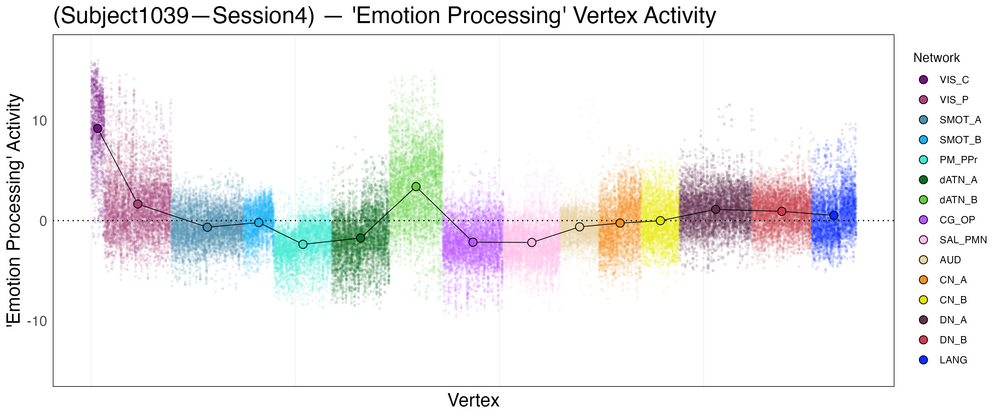


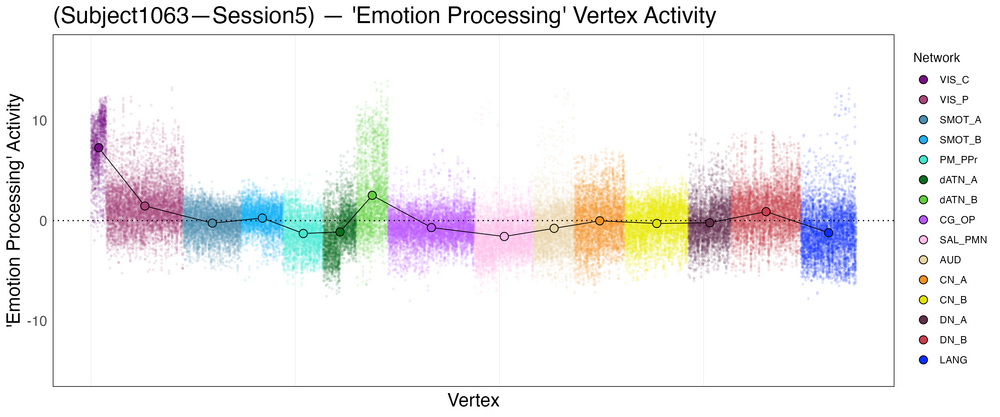


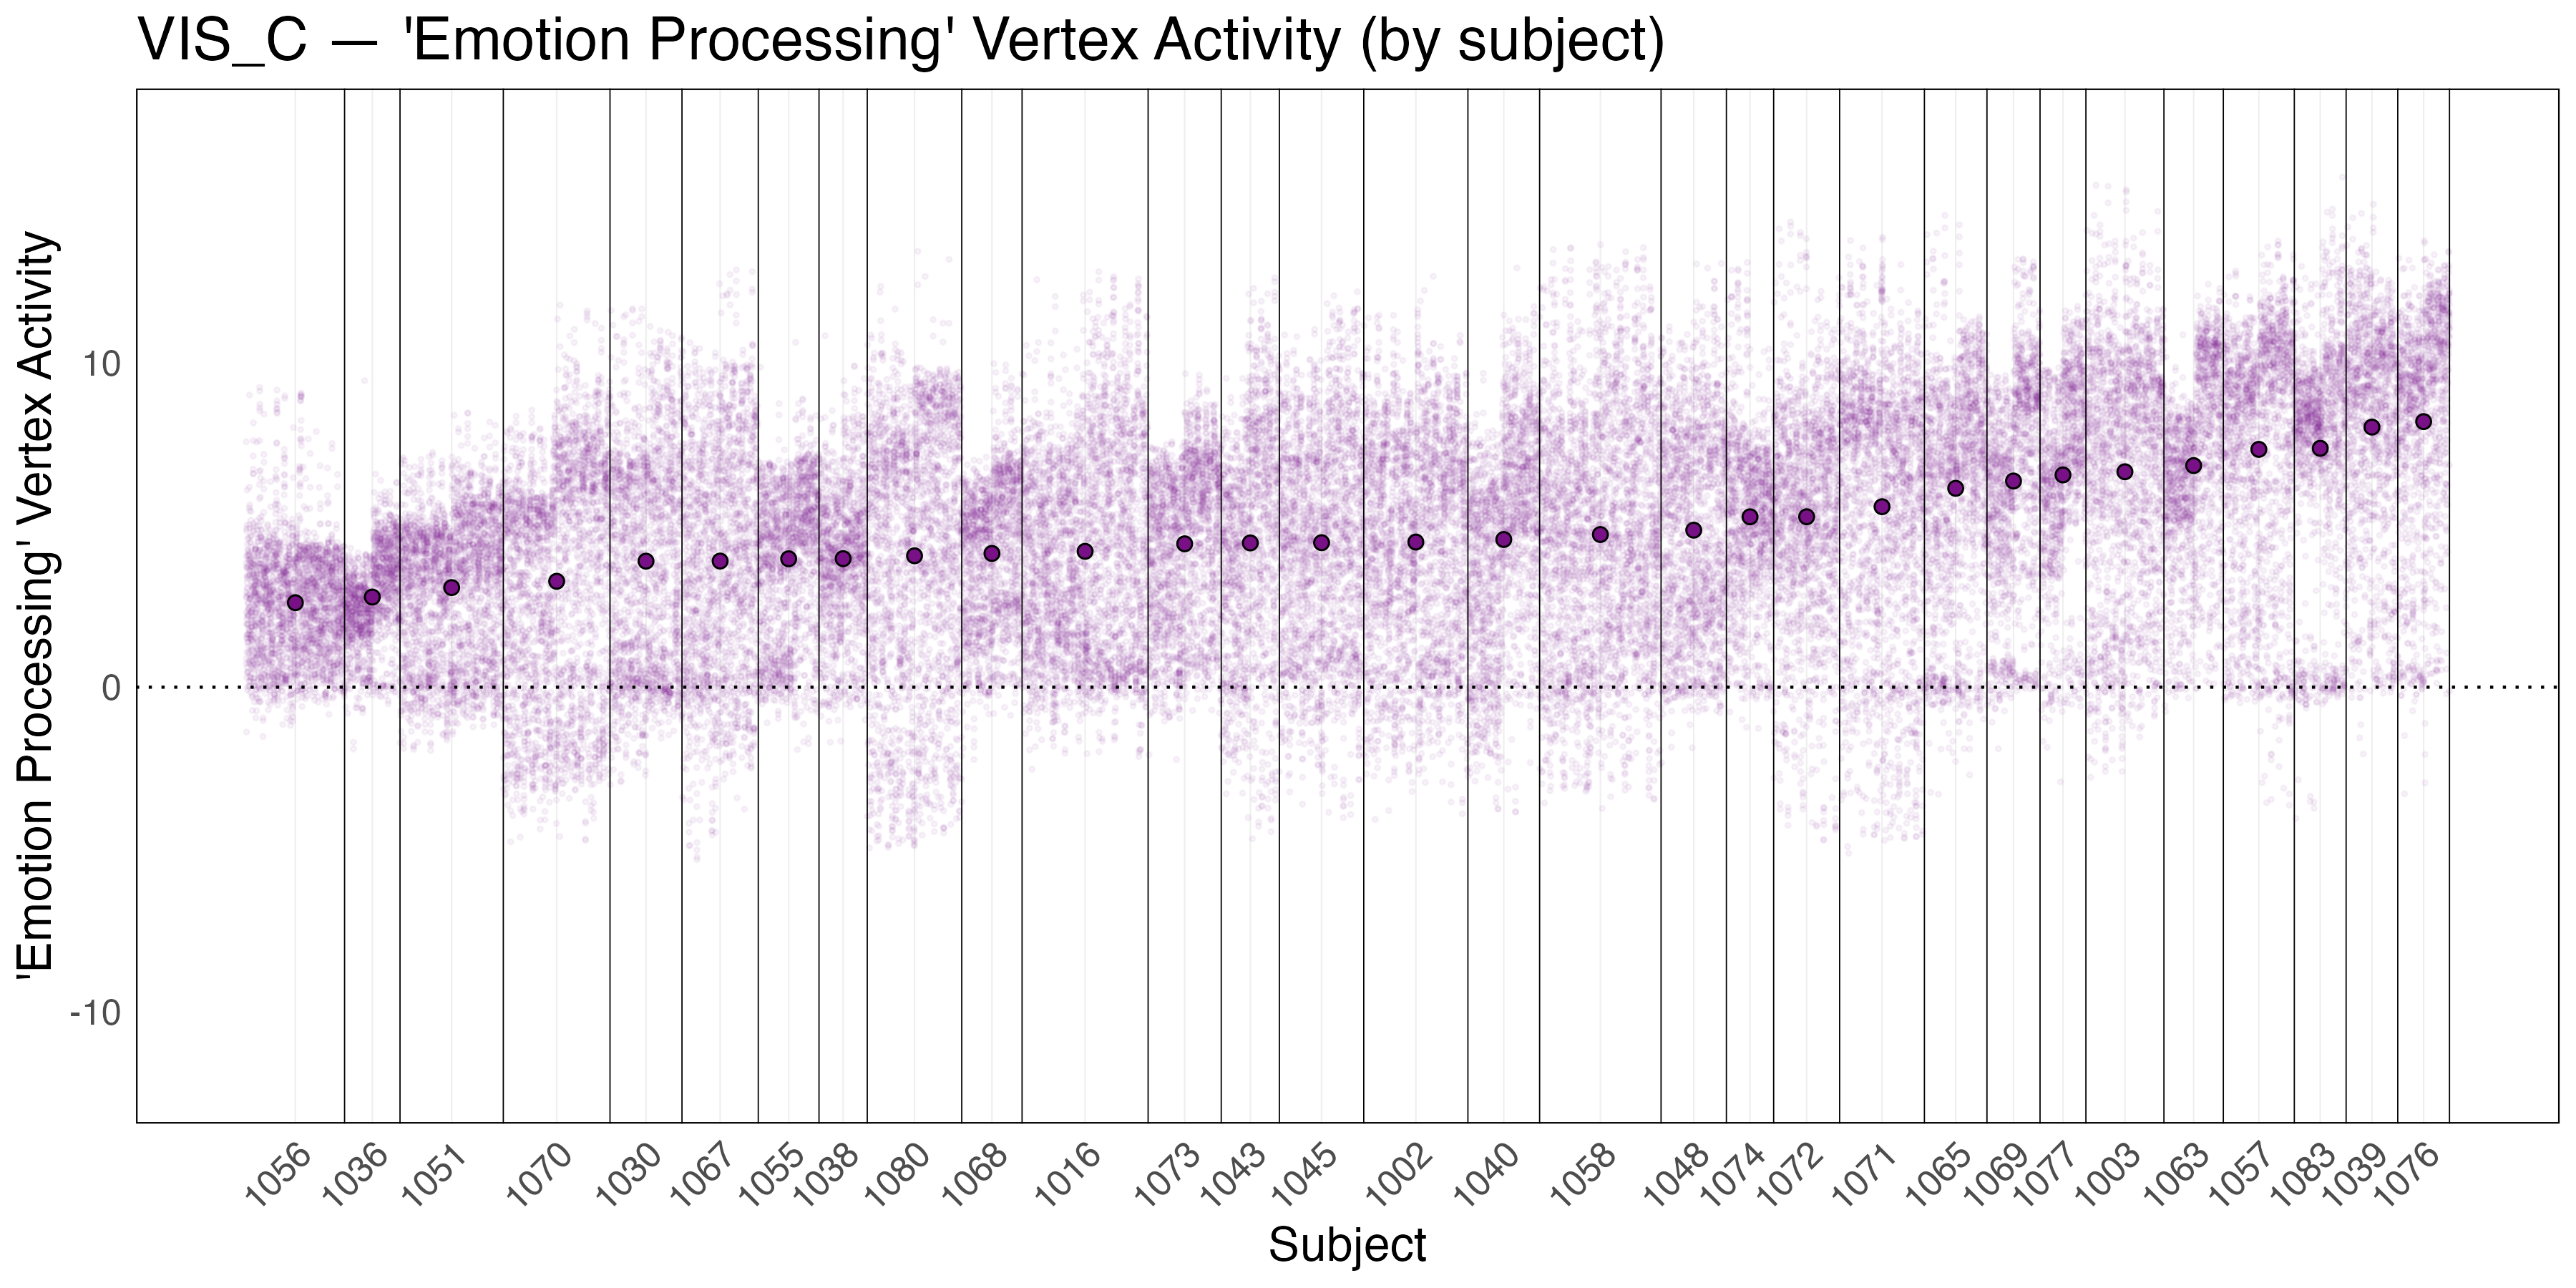
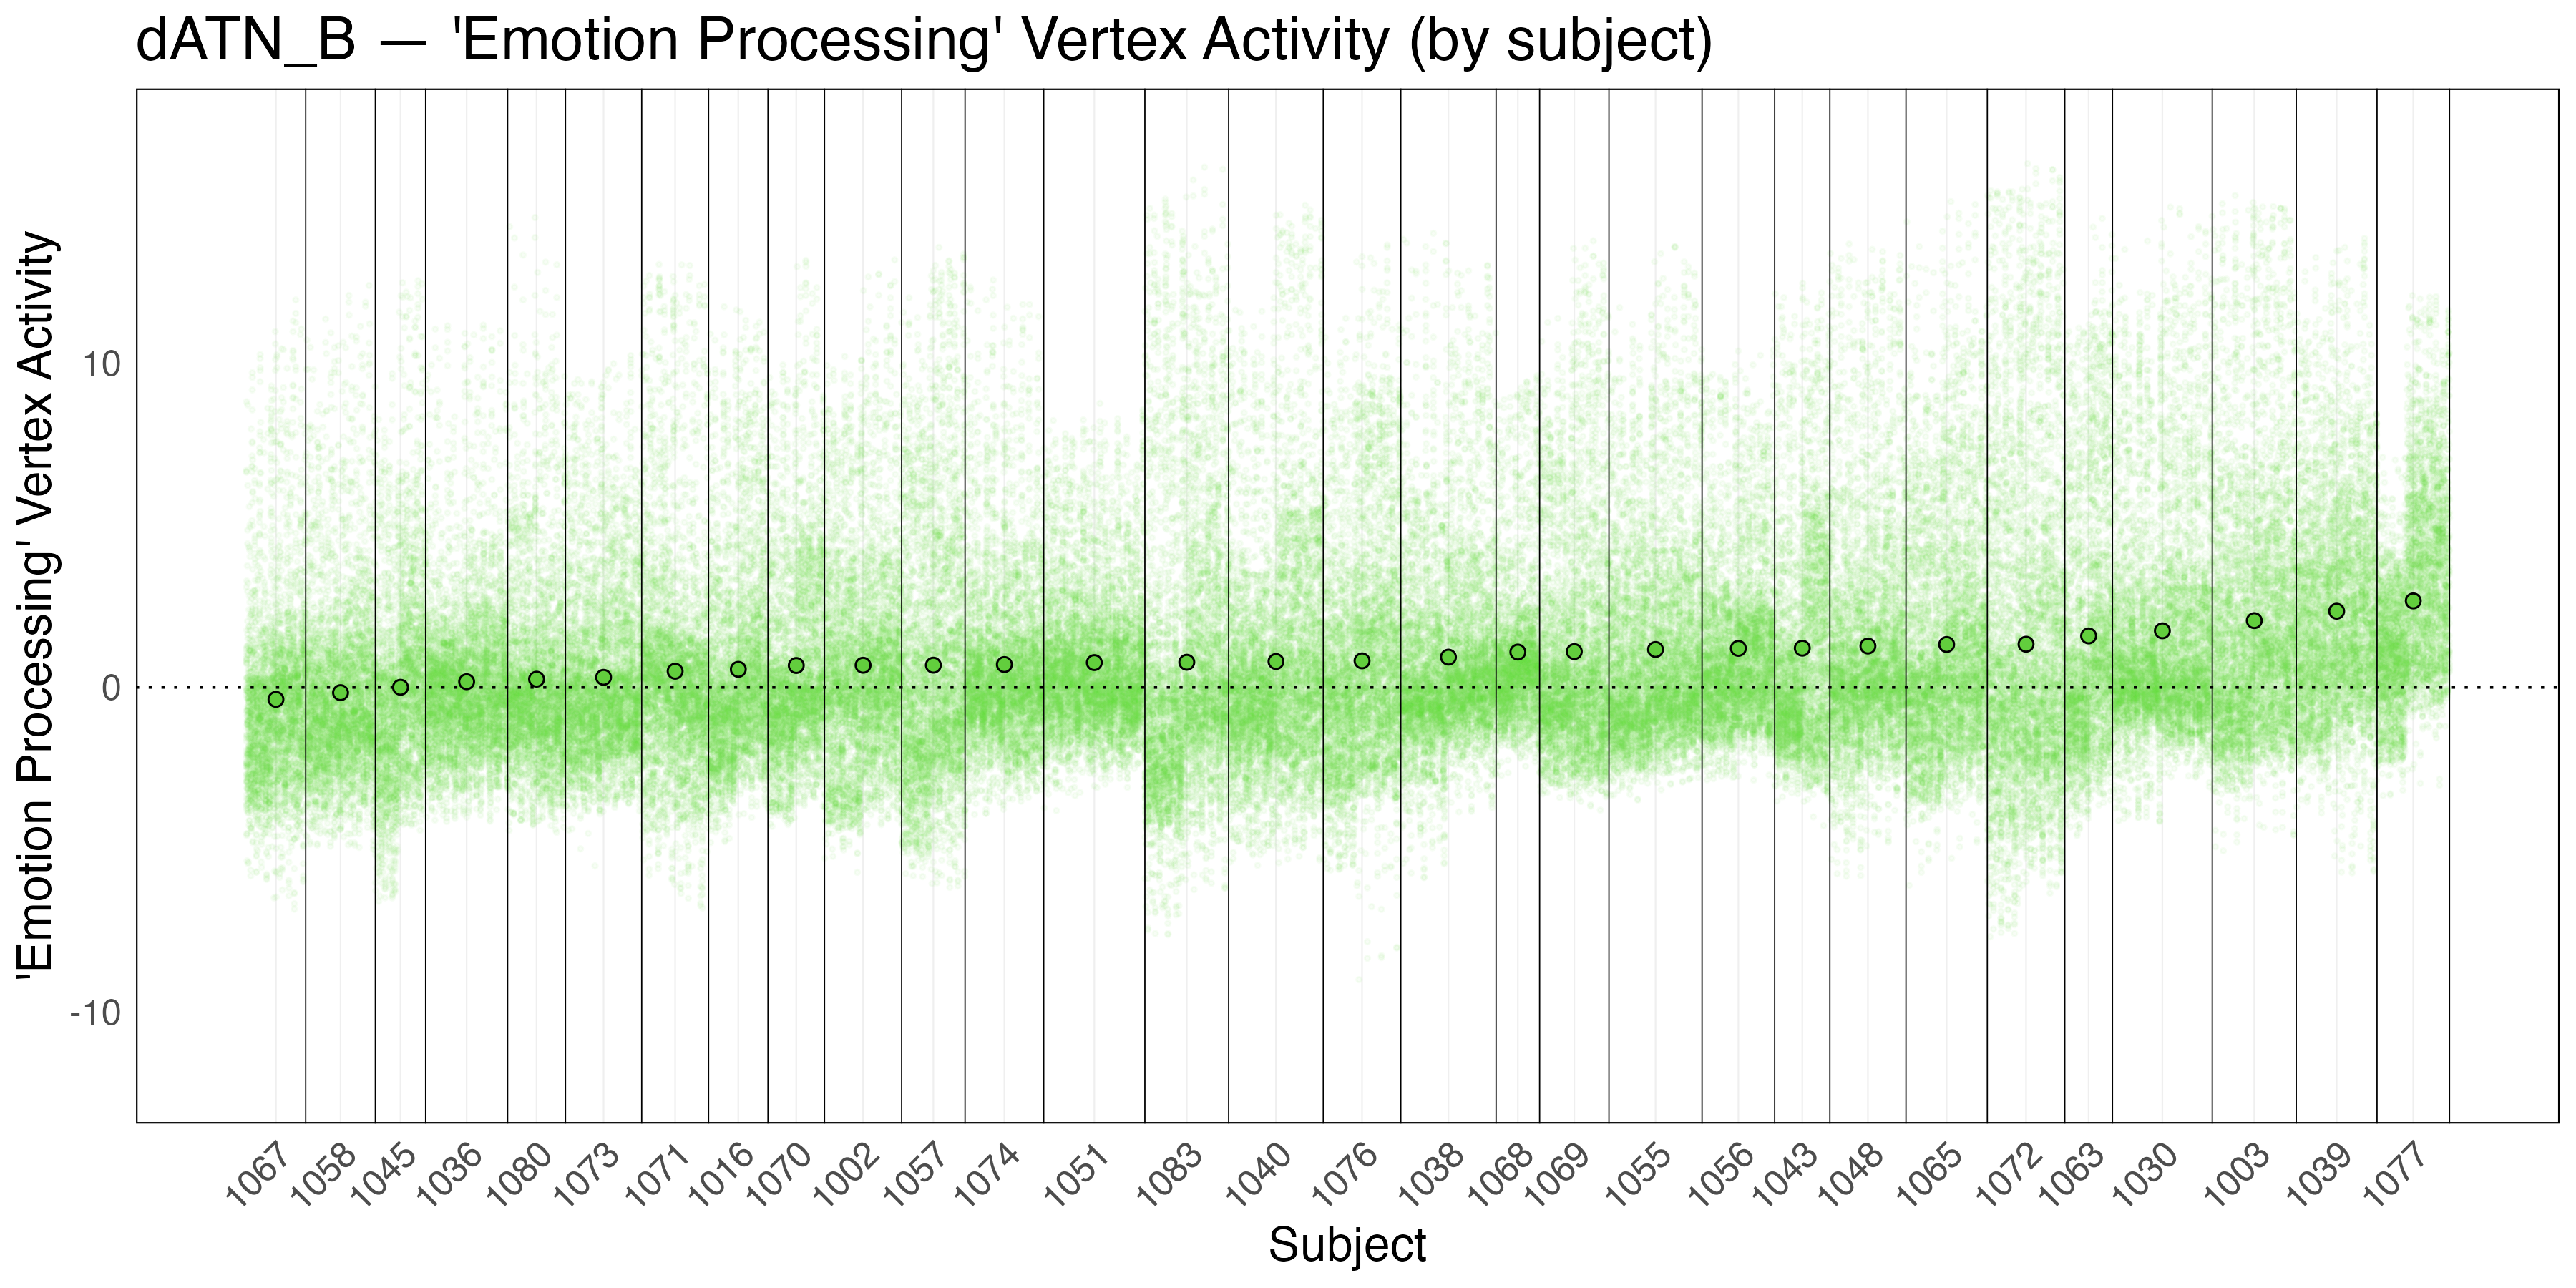
Observations - Vertex Activity Plots. Reviewing the above session-level vertex activity plots, reveals that when average activity increases within a network, the vertices within the network shows a global increase in activity. For three of four sessions, across subjects, all vertices within the visual-central network (VIS-C) show an increase in activity well above zero. Though some vertices in one subject-session (1030 - session 4) are below zero, the majority of vertices are above zero. A similar pattern of global vertex activity increase is seen for the dorsal attention network B (dATN-B) for all subjects across all sessions, where the whole distribution of vertices increases above zero. In section 3, I will quantify these visual observations by examining the percent of vertices within each network that show an increase in activity above zero for each network across all subjects and sessions.
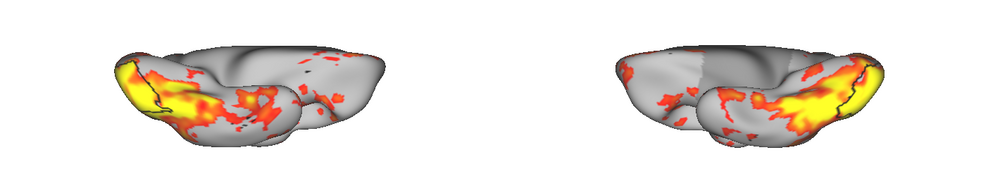
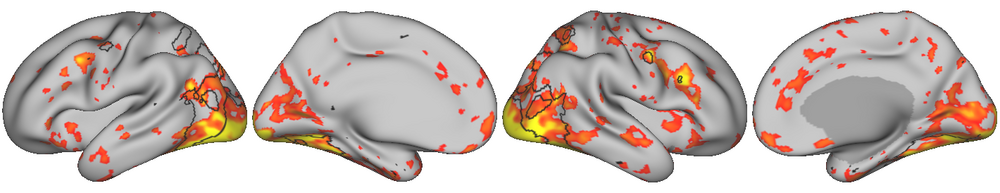
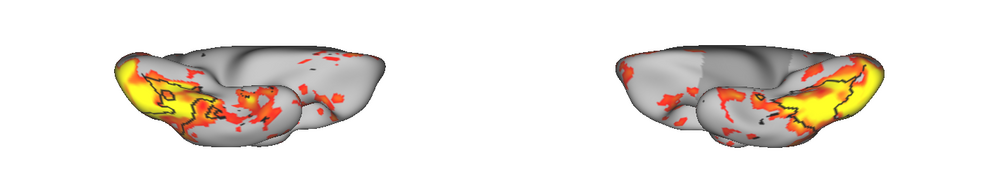
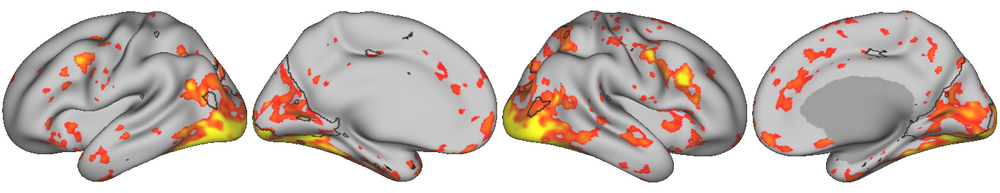
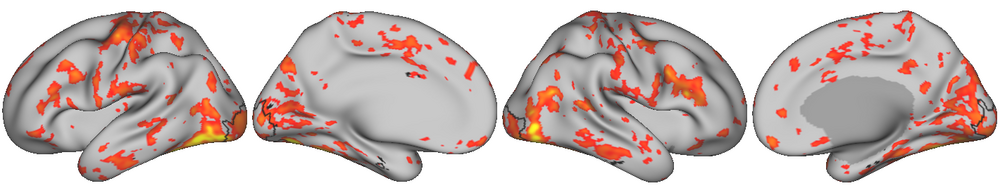
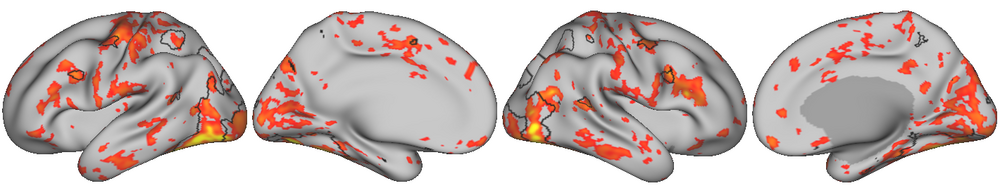
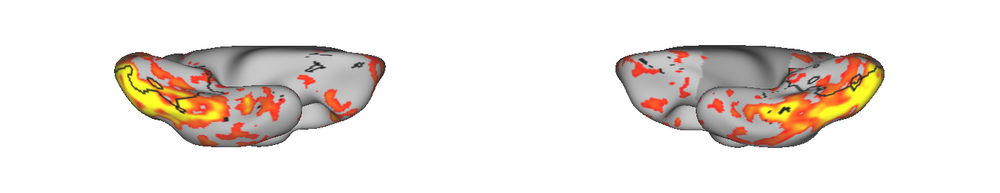
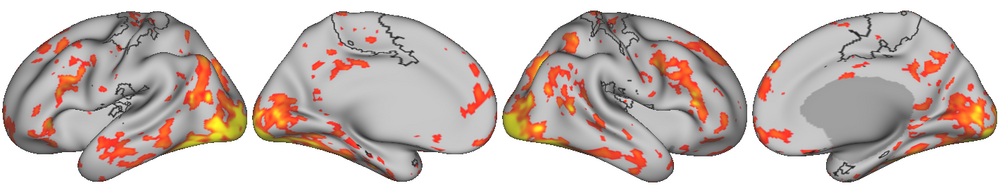
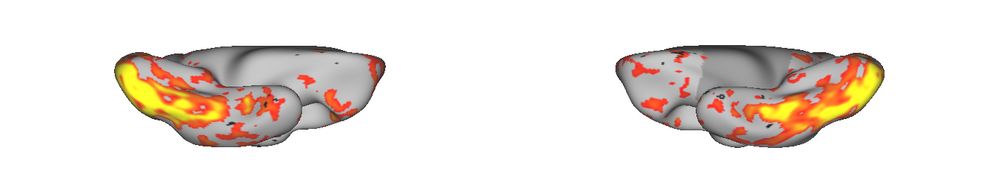
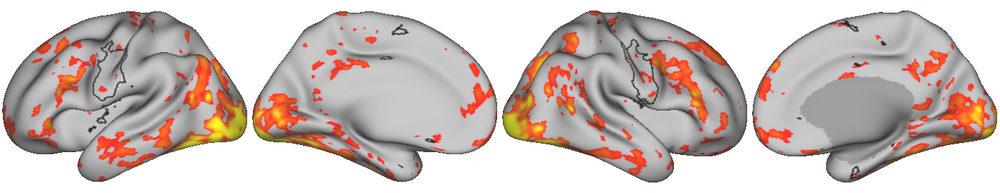
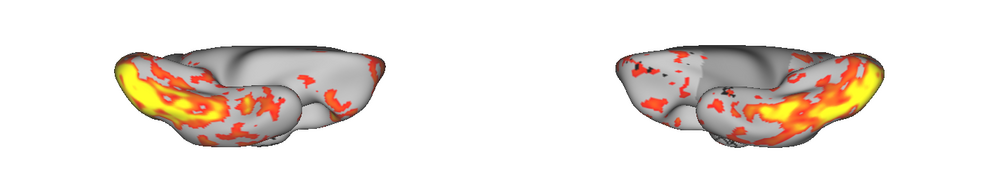
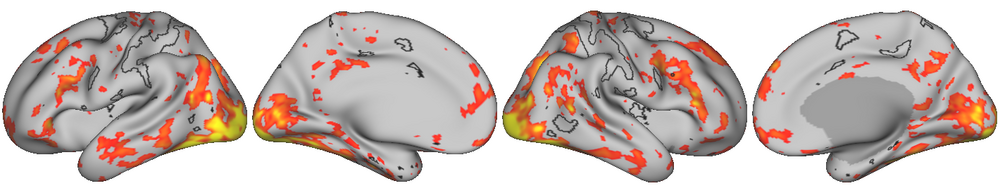
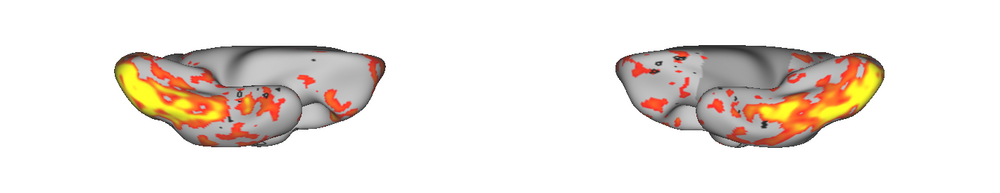
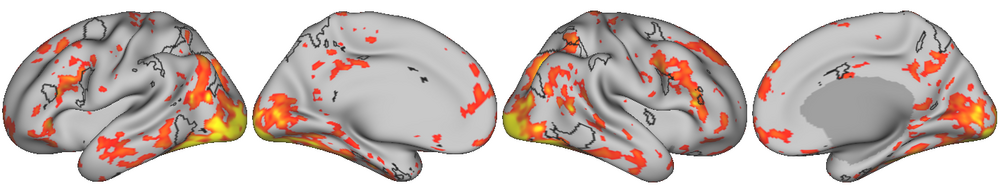
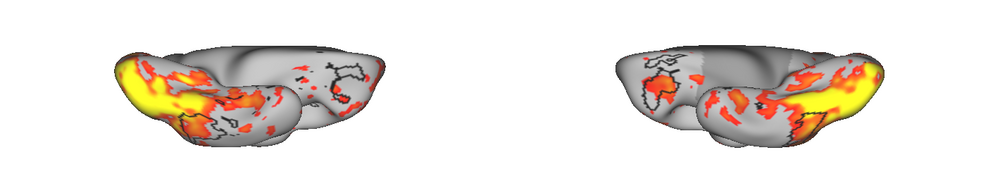
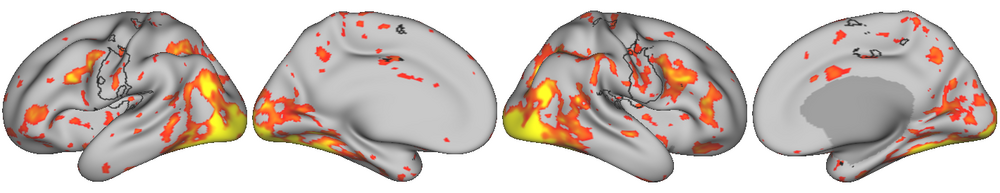
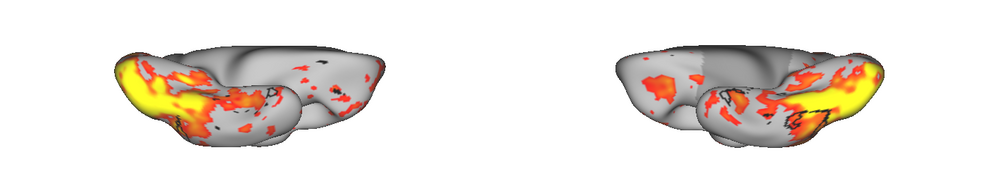
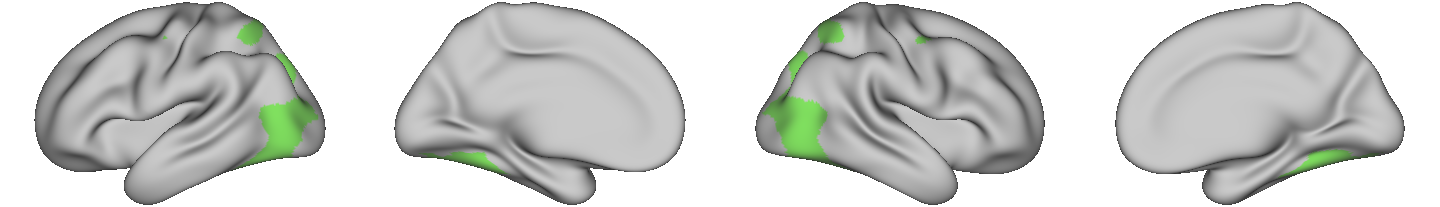
Observations - Boundary-Activity Overlap. The boundary-activity overlays reveal that the ‘emotion processing’ activity observed is well aligned with the boundaries of the networks. It is important to highlight that the network boundaries were defined using independent resting-state data. The fact that the activity observed during the emotion processing task aligns well with the boundaries of the networks is a strong indicator that the networks are capturing meaningful brain activity relevant to task-based functioning. Furthermore, the networks that show elevated activity as illustrated by the vertex activity plots (VIS-C and dATN-B in these subject-session examples) encapsulate most of the ‘emotion processing’ activity.
Check out the next tab to see some interesting control network A (CN-A) vertex activity!


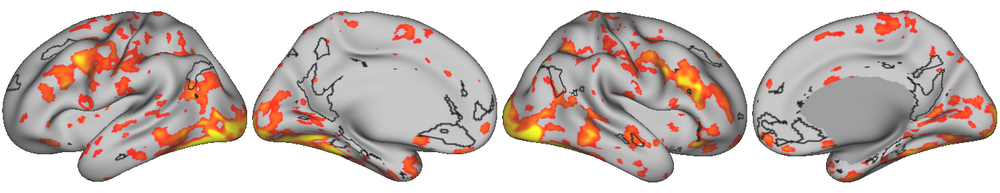


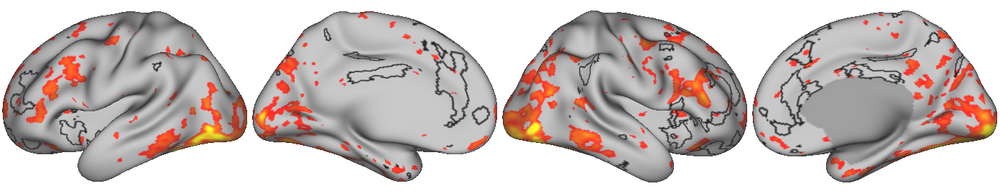


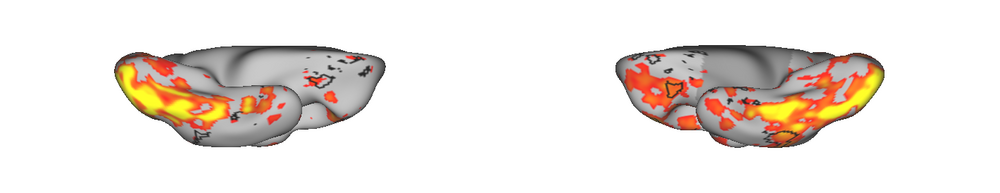

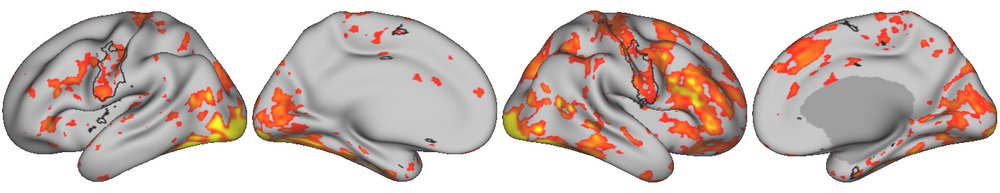


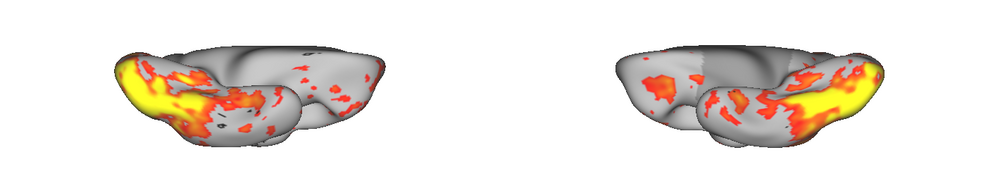


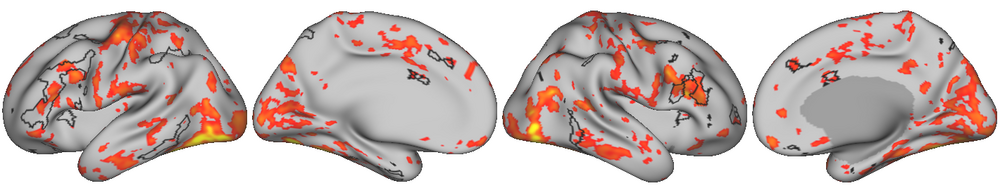
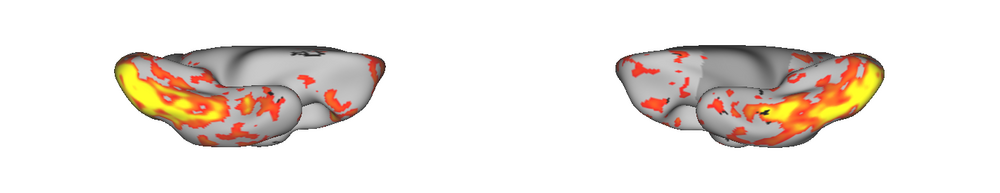
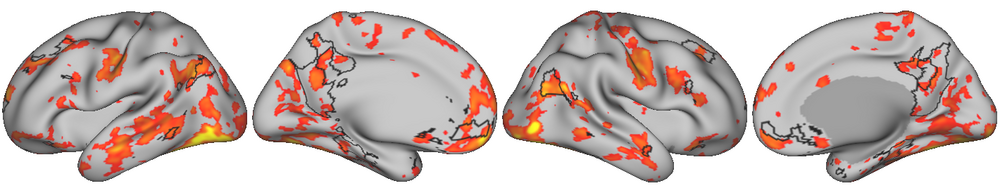
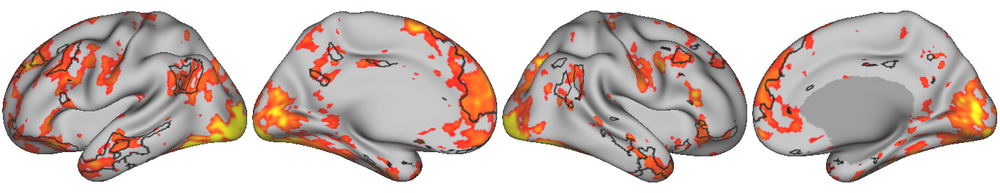
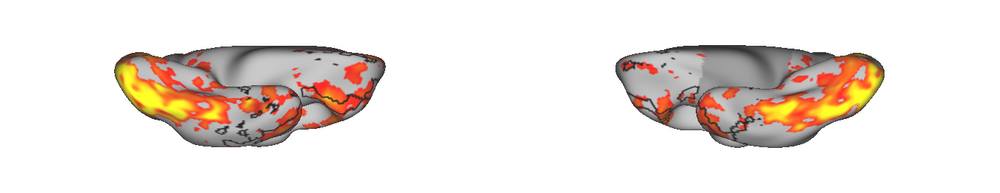
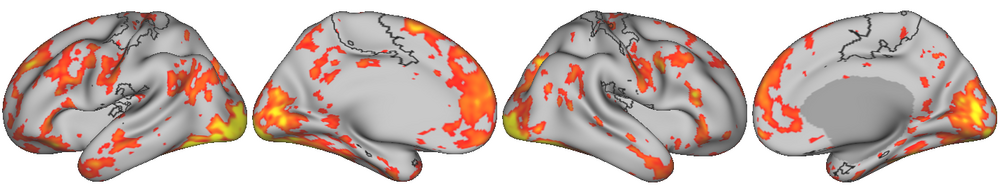
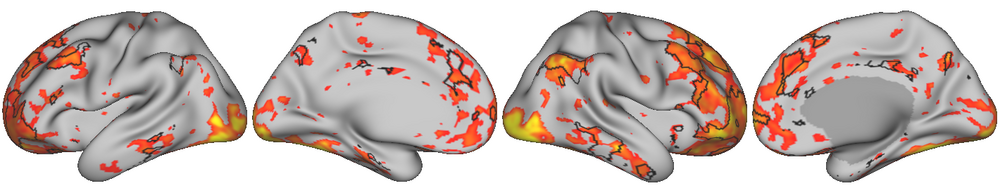
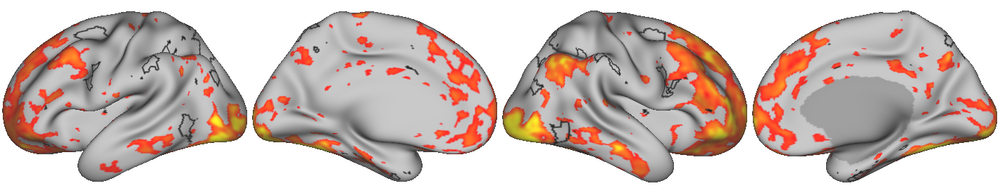
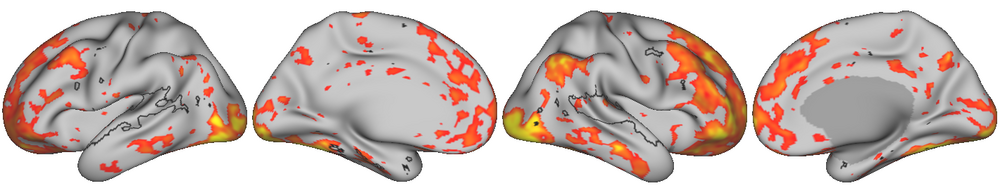
Observations - Vertex Activity. In these session-subject examples, an increase in control network A (CN-A) is also observed along side the standard increase in visual-central network (VIS-C) and dorsal attention network B (dATN-B). Again the increase in activity is global across all the vertices in the distribution. Interestingly, the control network A (CN-A) distribution appears to be tighter relative to the visual-central (VIS-C) and dorsal attention B (dATN-B) networks, implying more coherent vertex activity (ie. the vertices within control network A are acting more as a unit, than VIS-C and dATN-B).
Observations - Boundary-Activity Overlap. In these examples good correspondence between ‘emotion processing’ activity and the network boundaries is observed.
Check out the next tab to see some interesting default network B (DN-B) vertex activity!


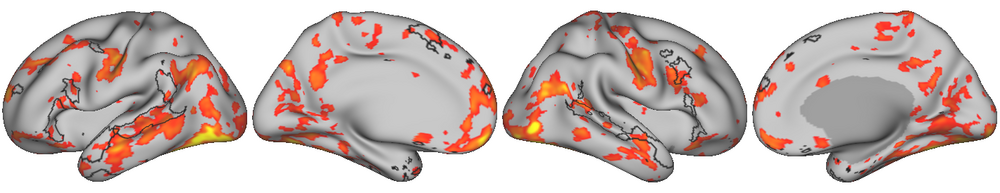

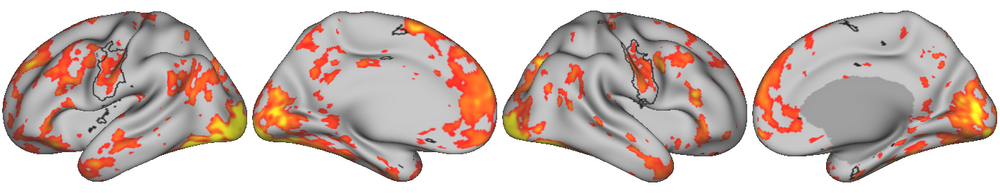

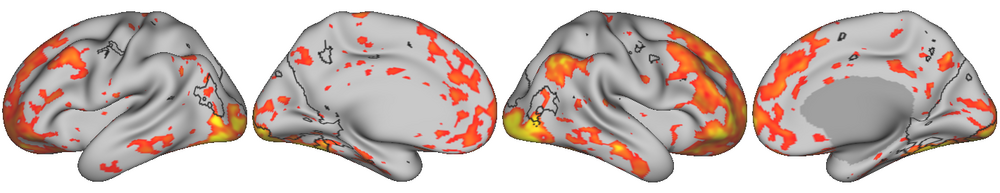


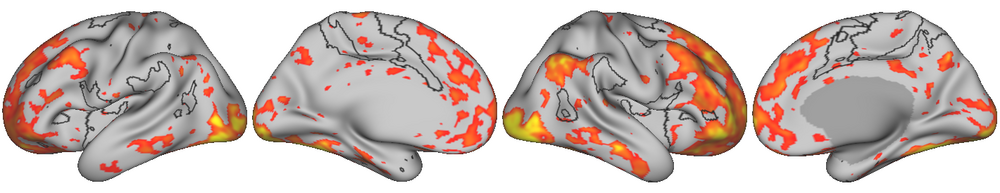

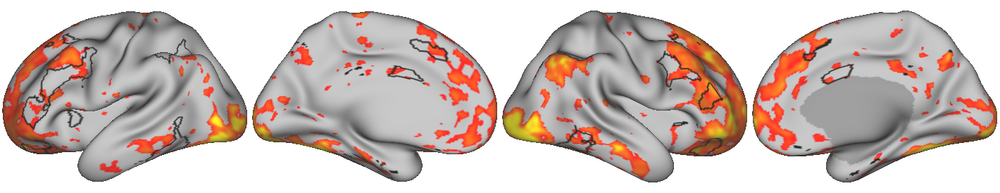


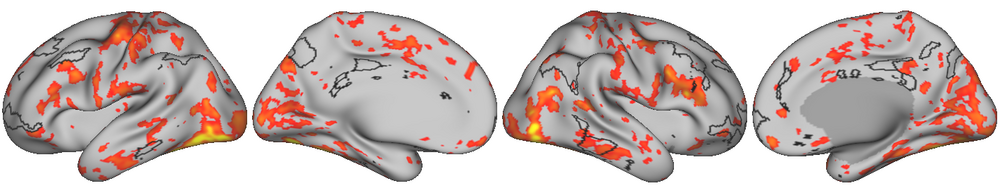
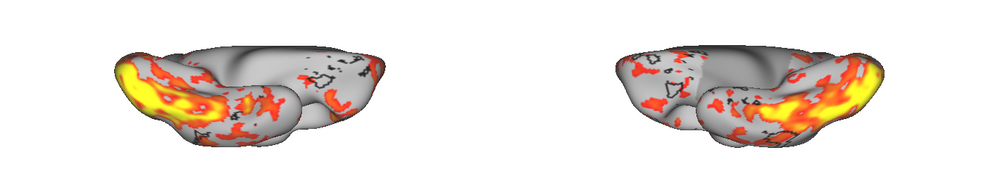
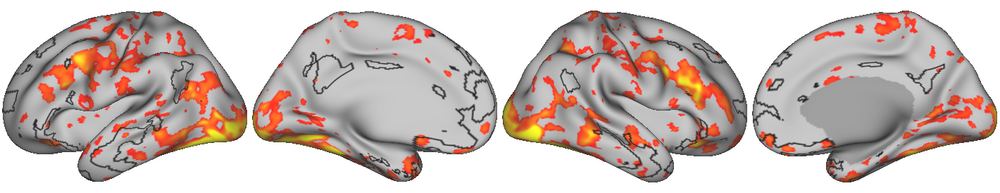
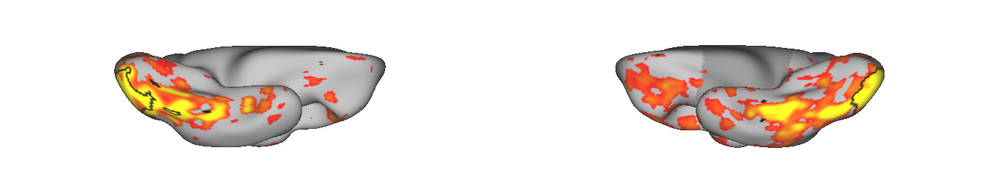
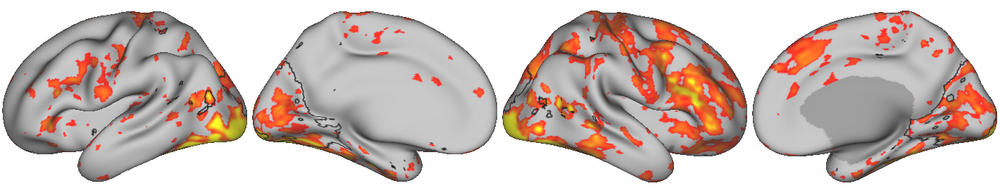
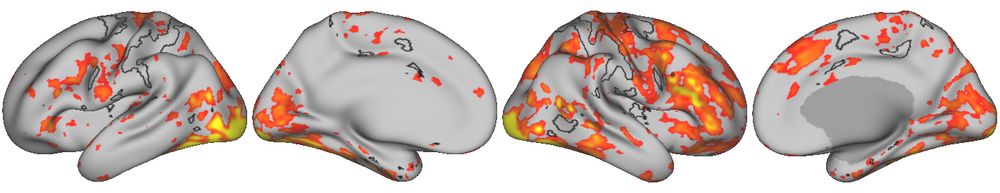
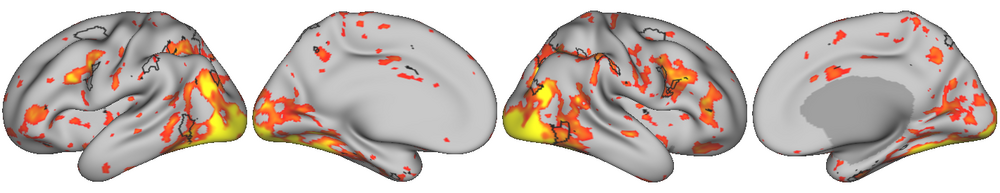
Observations - Vertex Activity. In these session-subject examples, an increase in Default Network A (DN_A is also observed along side the standard increase in visual-central network (VIS-C) and dorsal attention network B (dATN-B). Again I can see that the increase in activity in global across all the vertices in the distribution. Interestingly, the distribution of default network A vertices is much tighter (ie. has less variance) than both the Visual Central Network Distribution as well as the dorsal attention network B distribution. This is interesting because it suggests that the default network A vertices are more homogeneous in their activity levels than the other networks.
Observations - Boundary-Activity Overlap. The boundary-activity overlap for activity within the default network A is the most striking.
Summary of Observations (Section 1)
In summary, the above examples visually demonstrated significant network-level activity appears to be underscored by a global increase in activity across most if not all of the vertices in the network. In section 3, this visual observation will be quantified by calculating the proportion of vertices that exhibit activity greater that 0, however this visual illustration provides an initial piece of evidence to suggest that activity is occurring at the network-level during ‘emotion processing’. Furthermore, the observed activity was well circumscribed by the network boundaries, strikingly so given that the network boundaries were established using an entirely independent data set.
But, what would it look like for only a single isolated region to exhibit an increase in activity relative to the rest of a network? Reviewing a natural example of discrete region-level activity (as opposed to network-level activity) can serve to further bolster the visual intuition of what network-level vertex activity looks like.
Section 2: Example of Isolated Region-Level Vertex Activity
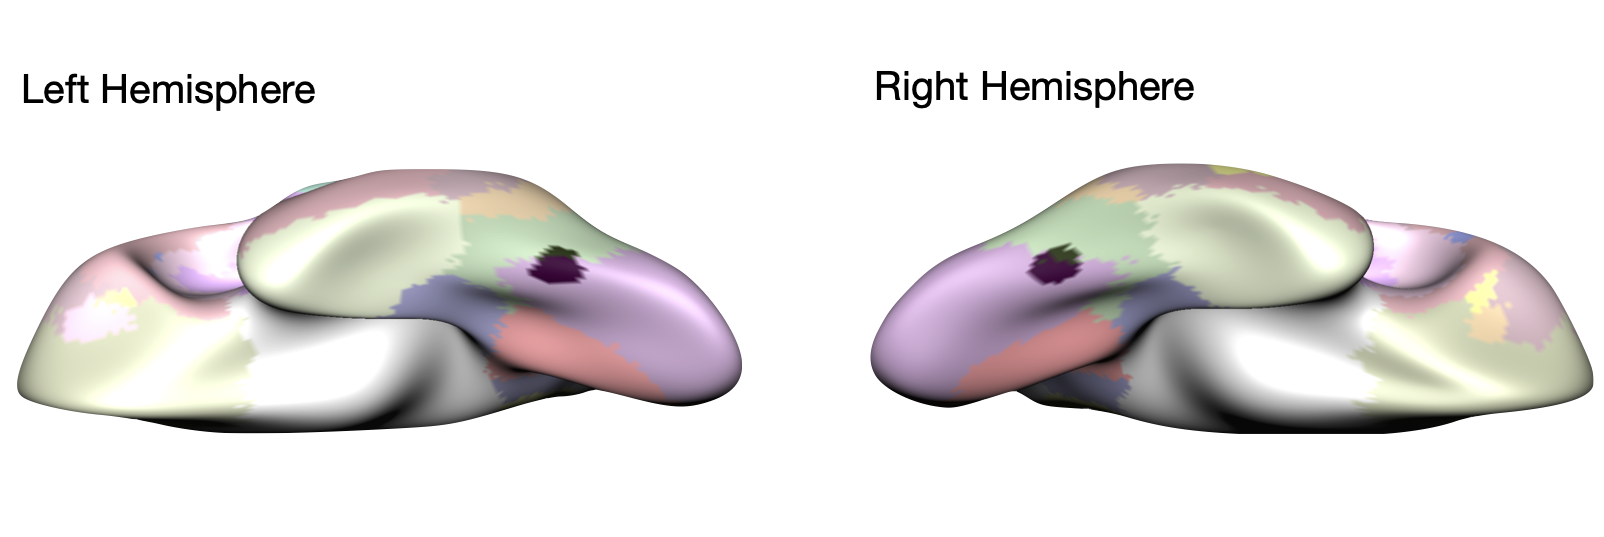
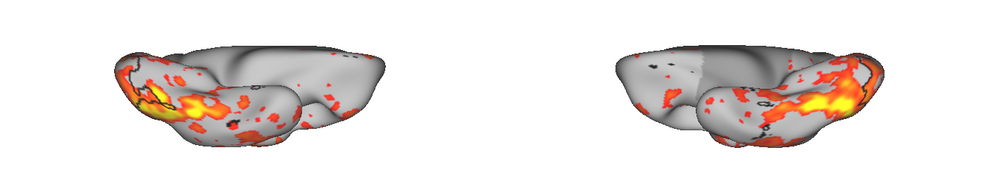
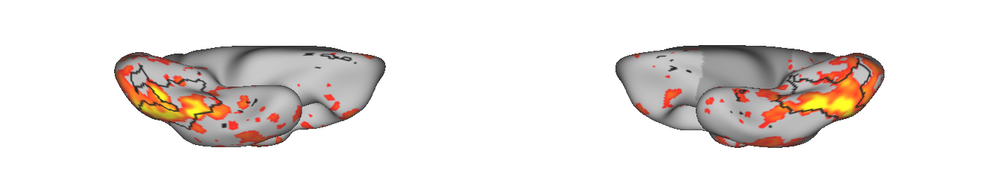
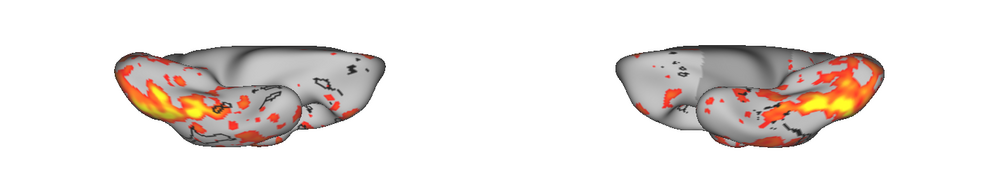
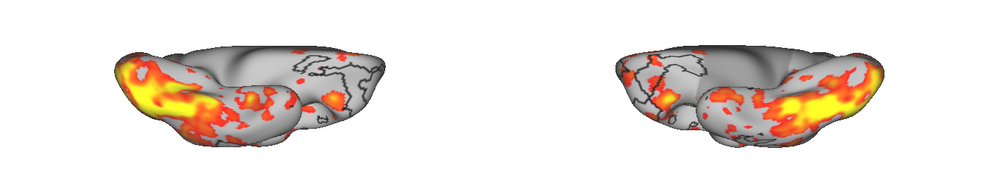
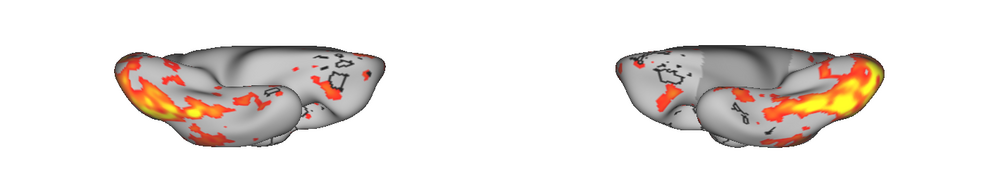
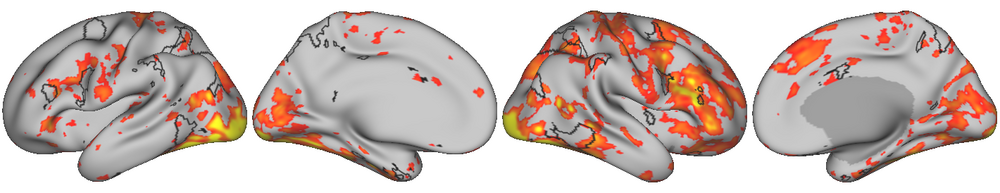
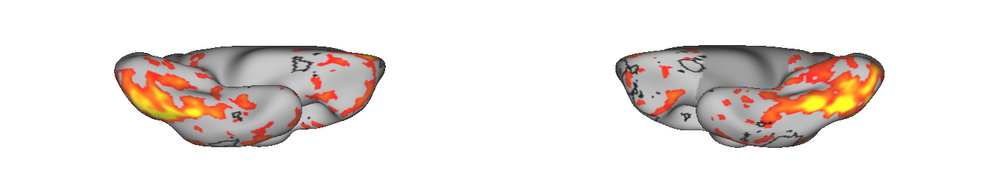
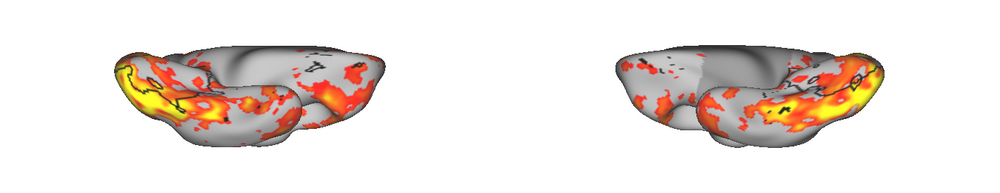
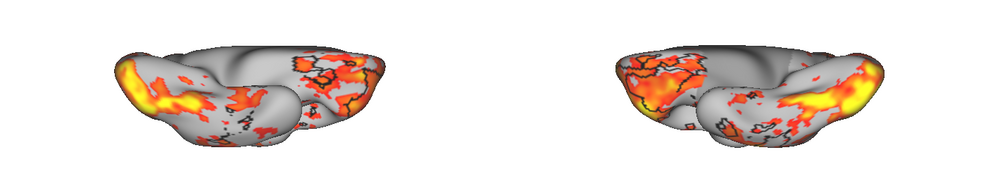
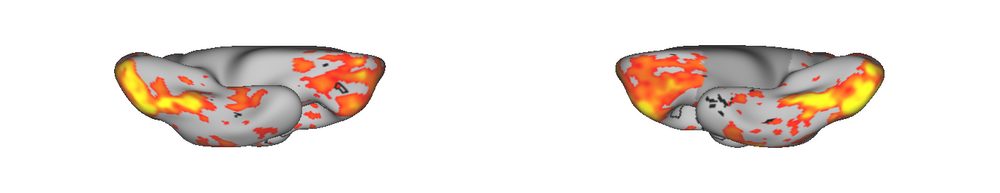
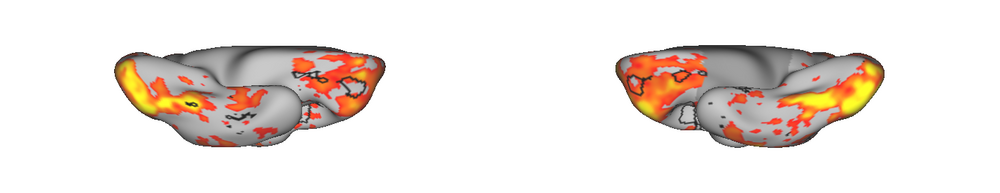
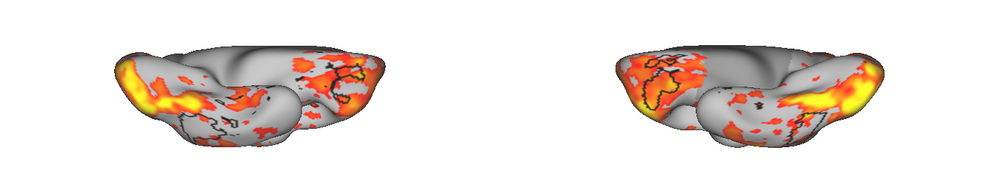
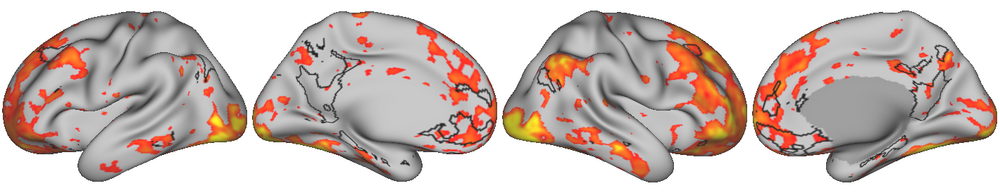
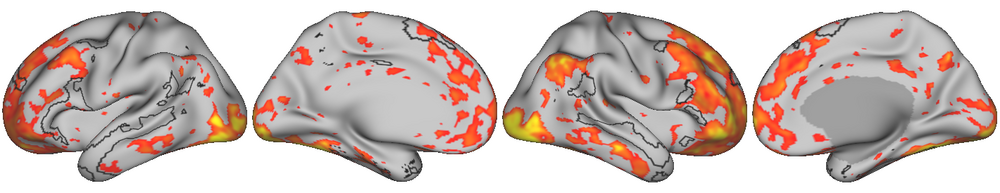
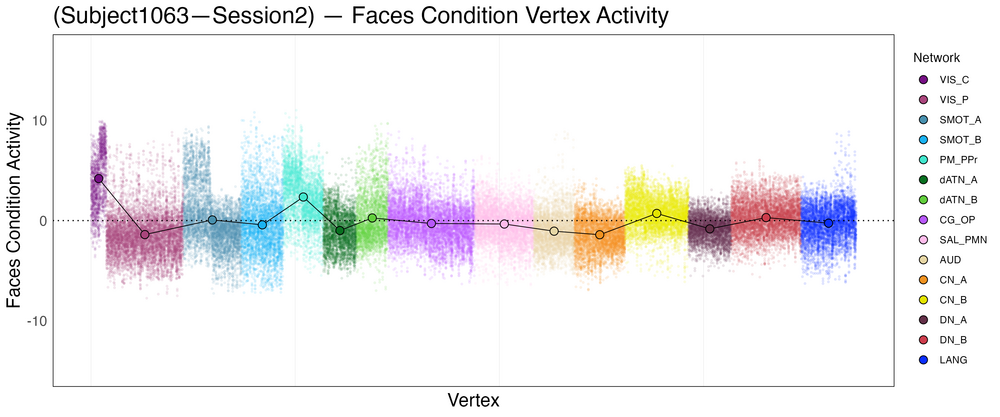
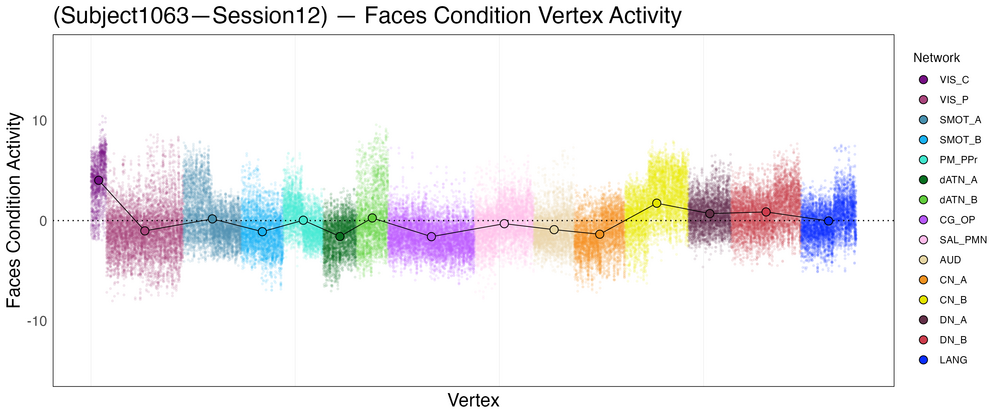
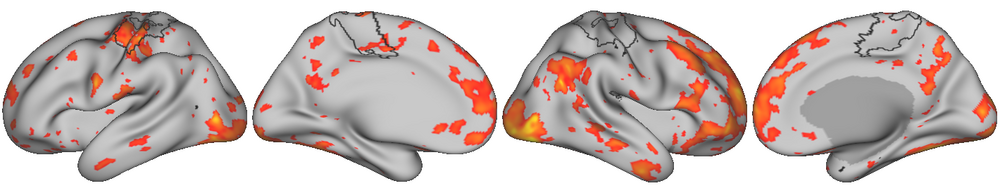
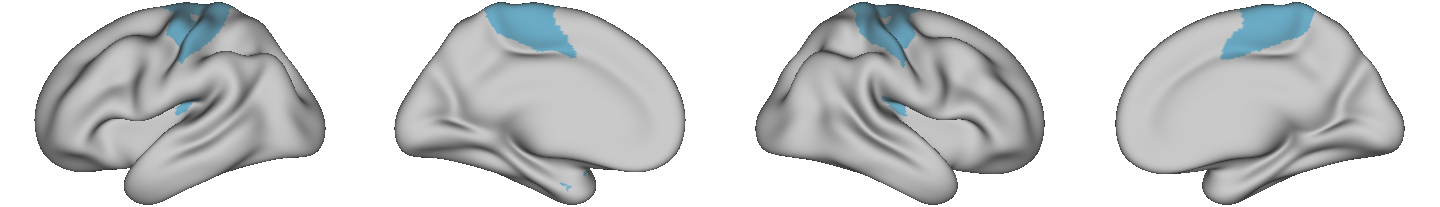
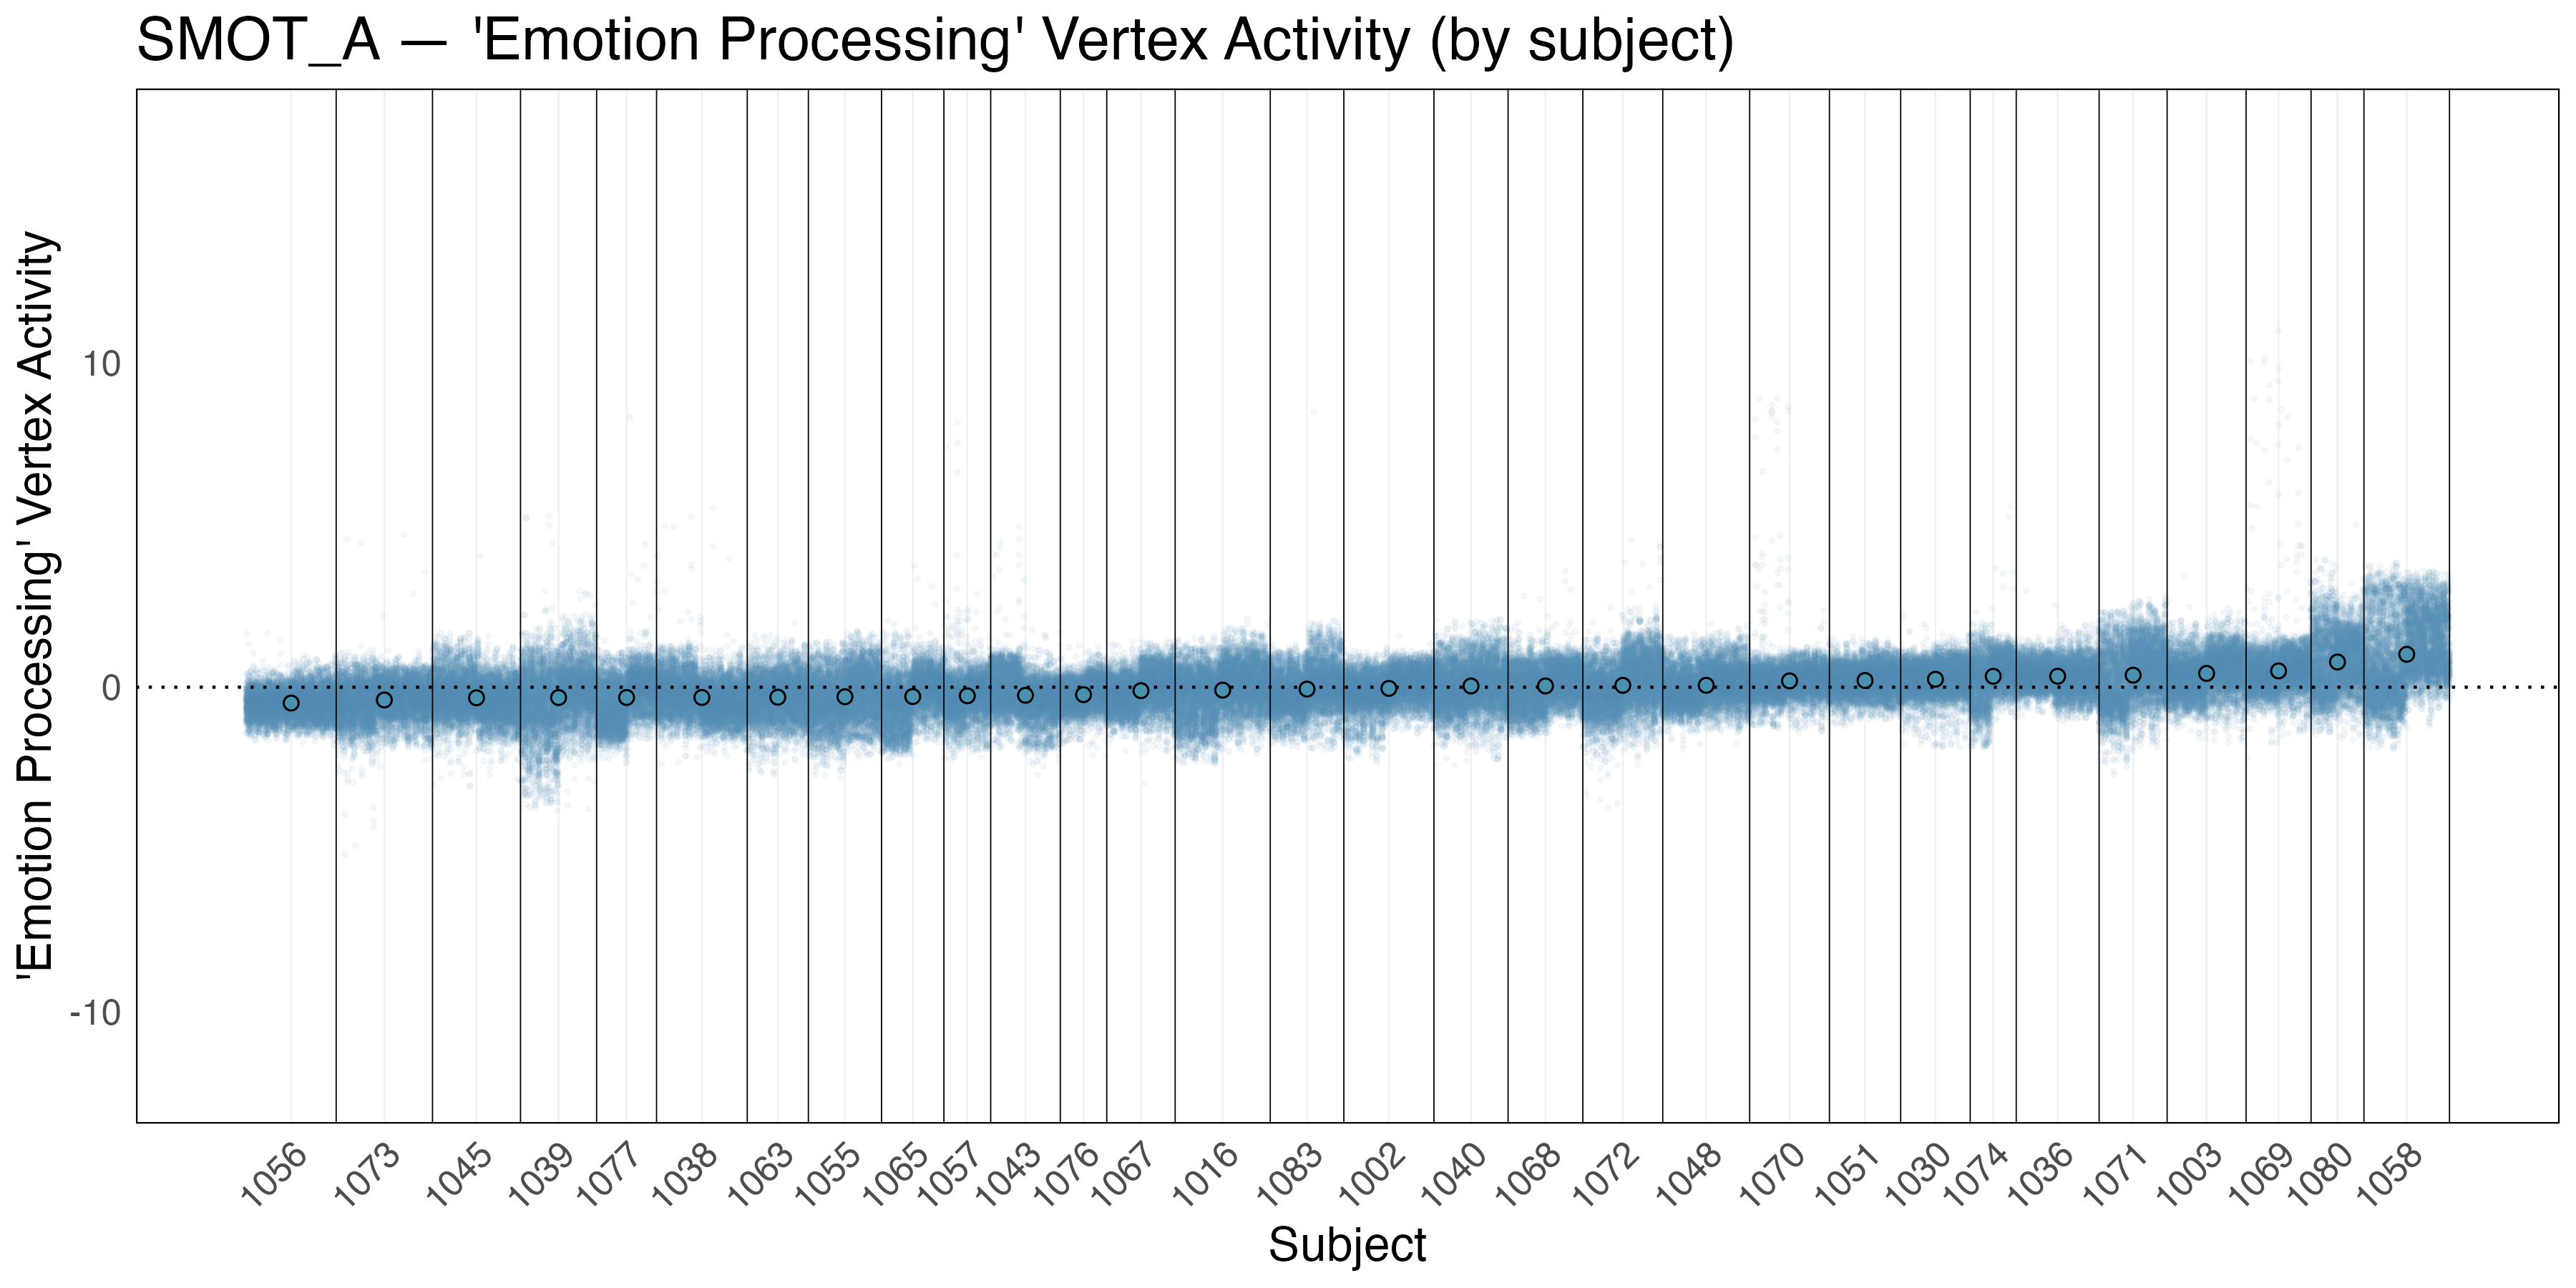
Reviewing the vertex-level activity for the faces and shapes conditions revealed that a subset of vertices in the somatomotor network A (SMOT_A) exhibited a notable increase in activity. In these examples, a subset of the vertices in the left hemisphere (note the left right split of the vertices) pull away from the overall distribution and band at a higher level of activity. The observed left lateralized region-level vertex activity likely reflects subject 1063 (right handed) making button press to indicate their responses during task. This activity not visible in the ‘emotion processing’ activity contrast (when activity in the shapes condition is subtracted from that of the faces condition), as both conditions contain a button press motor action.
As seen in the vertex activity plots below, this lateralized regional activity while notable, is not enough to drive activity in the whole network much above an average of 0. Reviewing the boundary-activity overlay images also further illustrates that the observed activity falls within only one portion of somatomotor network A.
SMOT-A Boundary-Activity Overlay
SMOT-A Boundary-Activity Overlay
SMOT-A Boundary-Activity Overlay
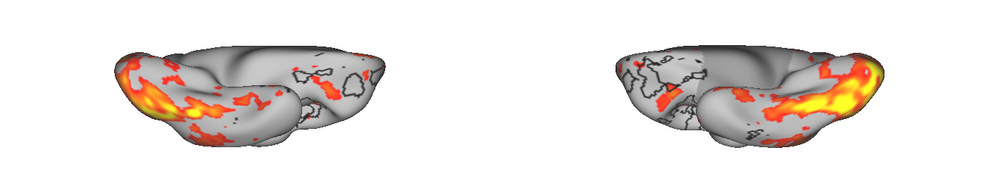
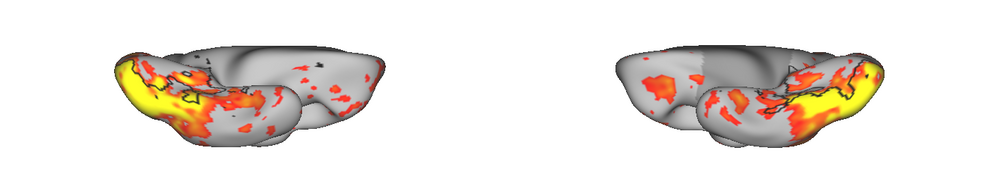
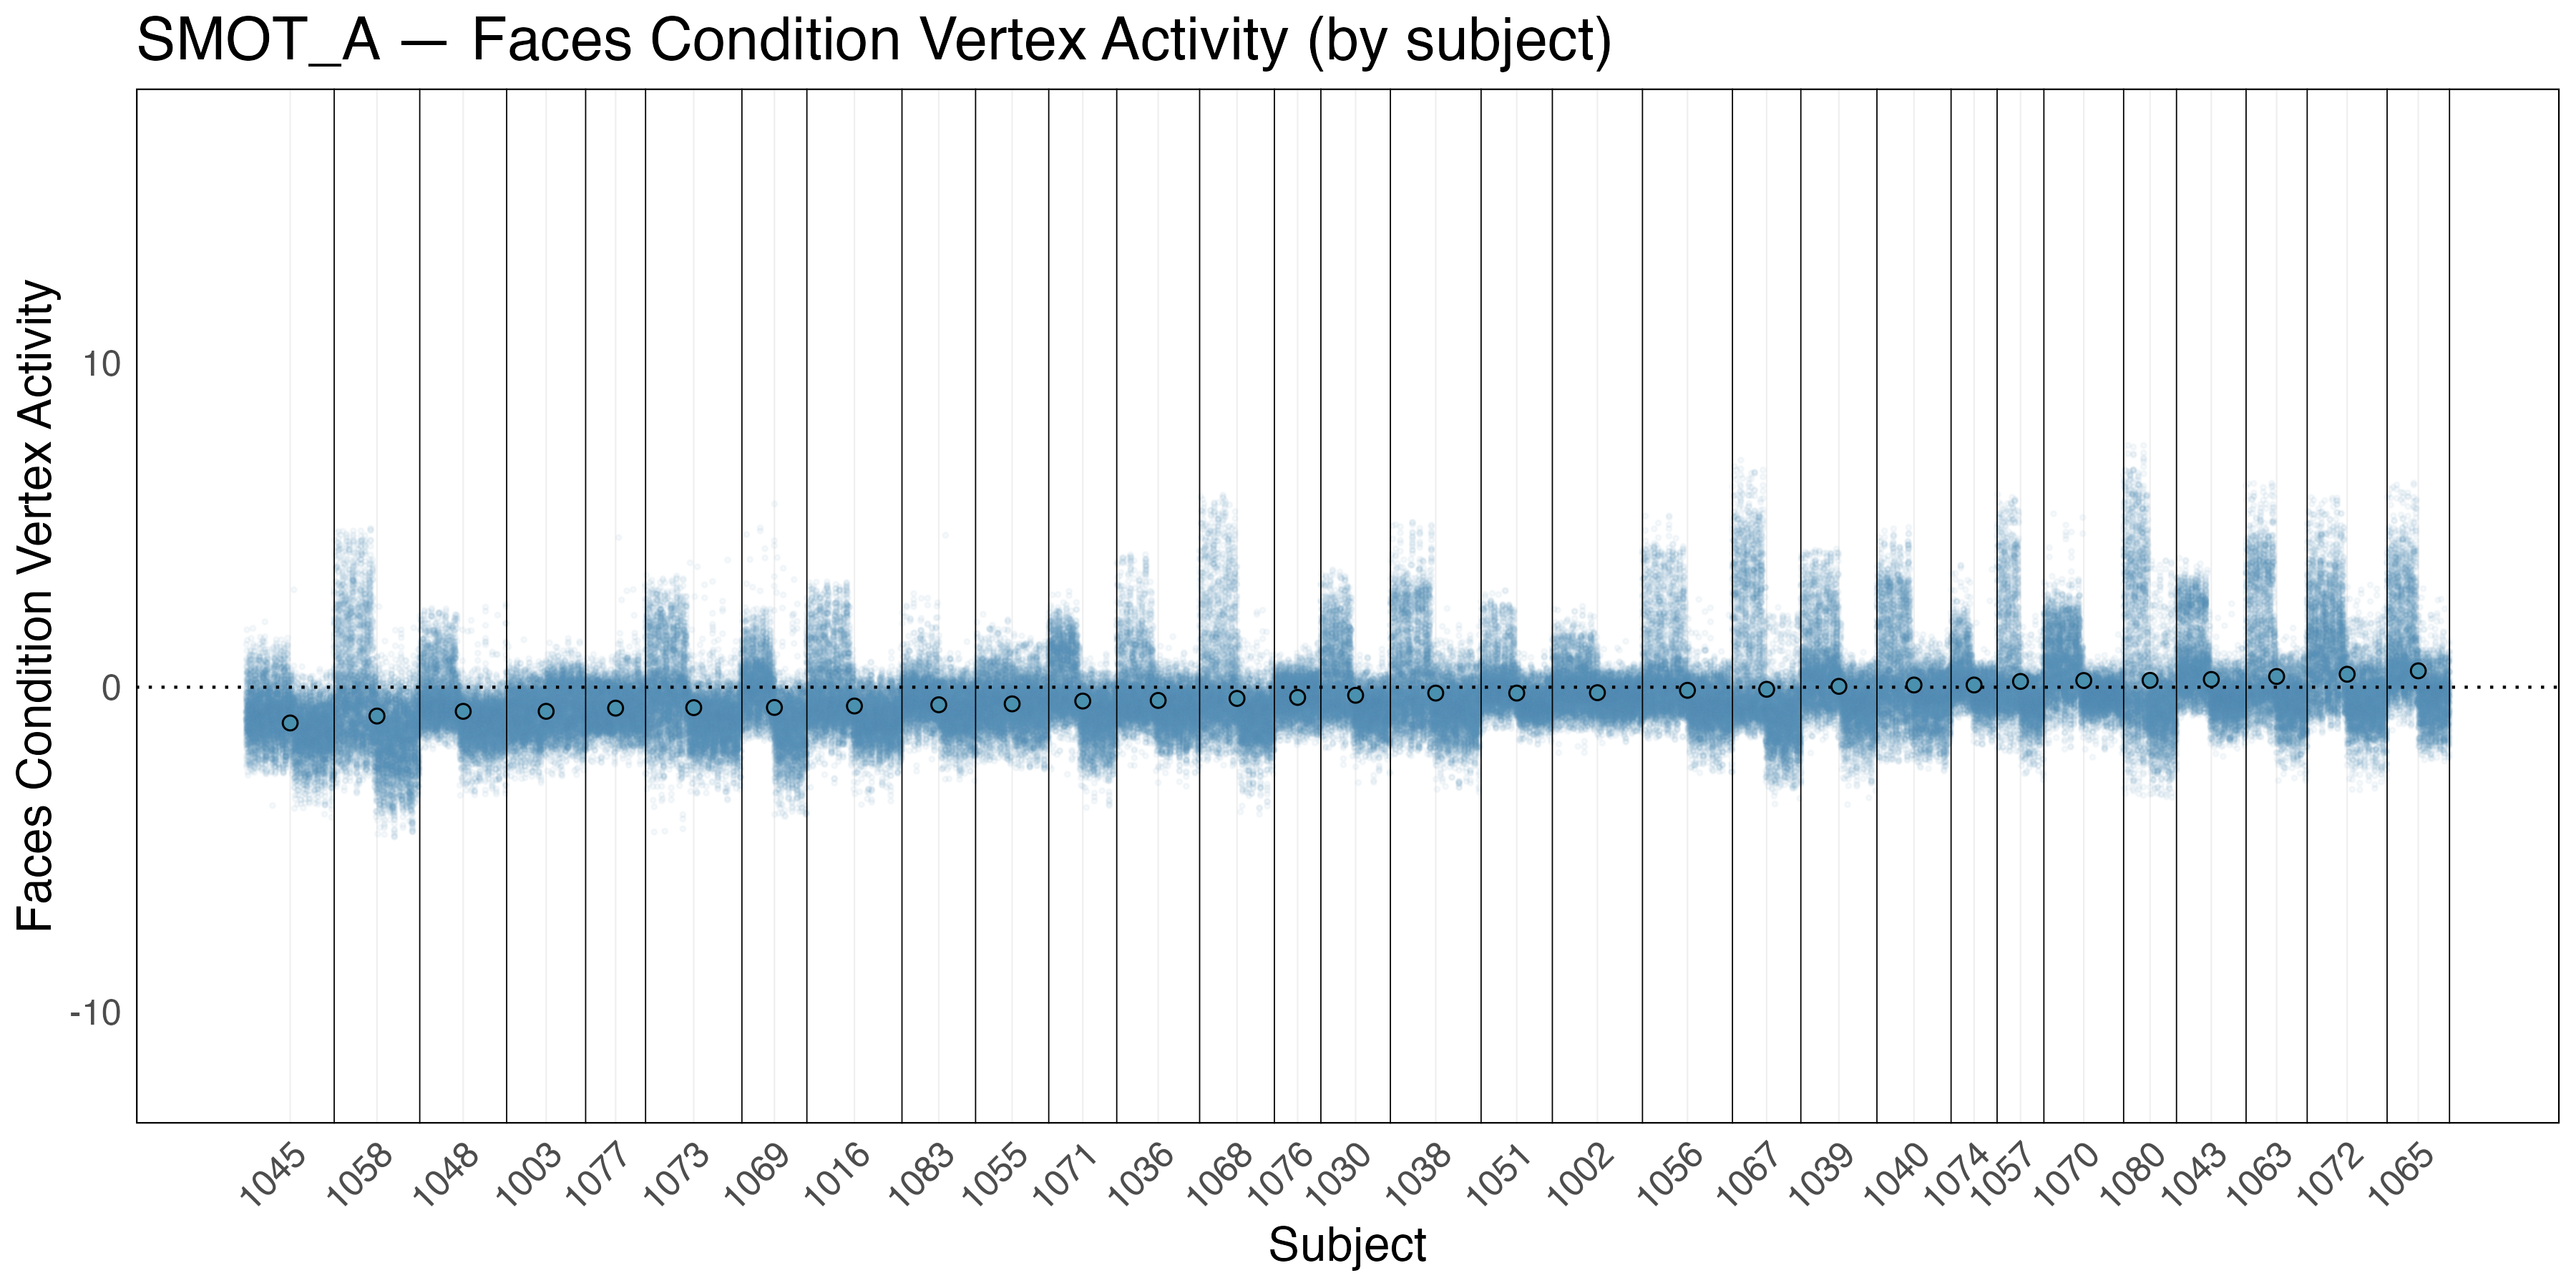
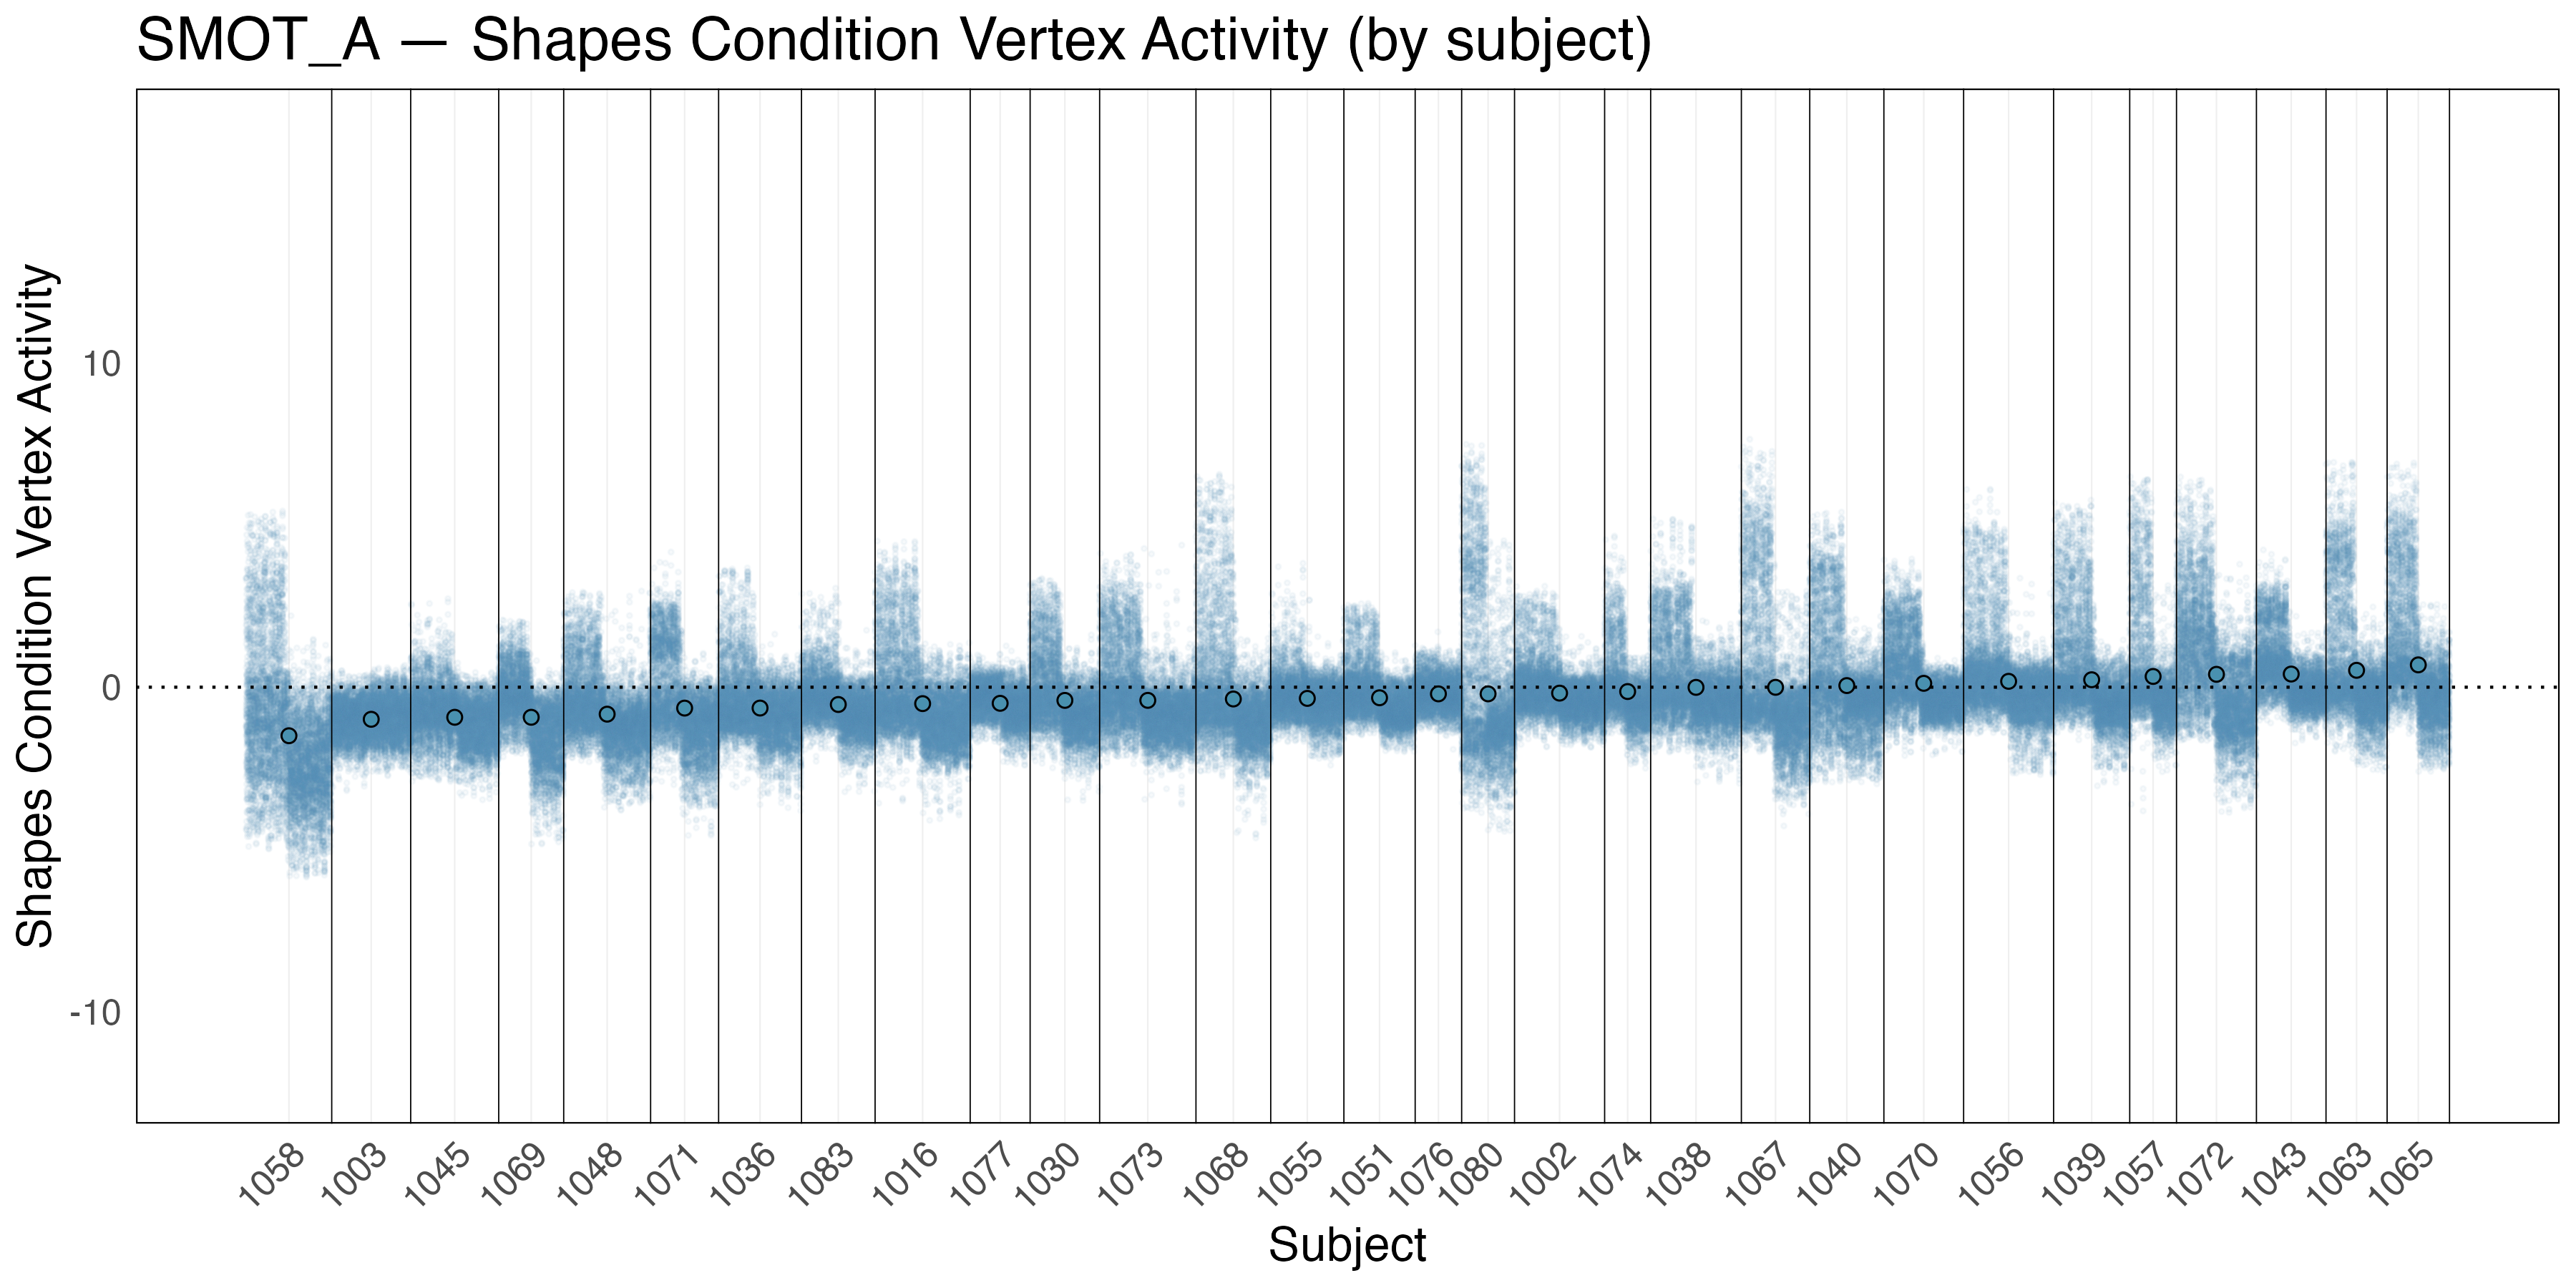
This pattern of lateralized region-level vertex activity during the faces and shapes conditions is also visible when averaging the vertex-level activity across sessions within subject, as seen below.
Subject Averages - Somatomotor Network A (SMOT-A)
Summary of Observations (Section 2)
In summary, the two sections above provide examples that visually demonstrate the difference between network-level and region-level vertex activity. The examples in section 1 show network-wide increases in vertex activity that correspond to a significant increase in the network average. In contrast, the examples in section 2 illustrated that isolated region-level vertex activity does not necessarily drive a significant increase in network-level activity.
Section 3. Quantifying the percentage of active vertices within each network
While the first two sections provided visual evidence that network-level activity is occurring during the emotion processing task, I wanted to quantify this visual observation. To do so I examined the percent of vertices within a network that exhibit activity greater than zero (percent vertex activity above zero). This metric is a simple way to quantify what was observed visually in the subject-session examples in section 1 — ie. when a network exhibits ‘emotion processing’ activity, a majority of the vertices in the network exhibit activity above zero.
Percent Vertex Activity Above Zero
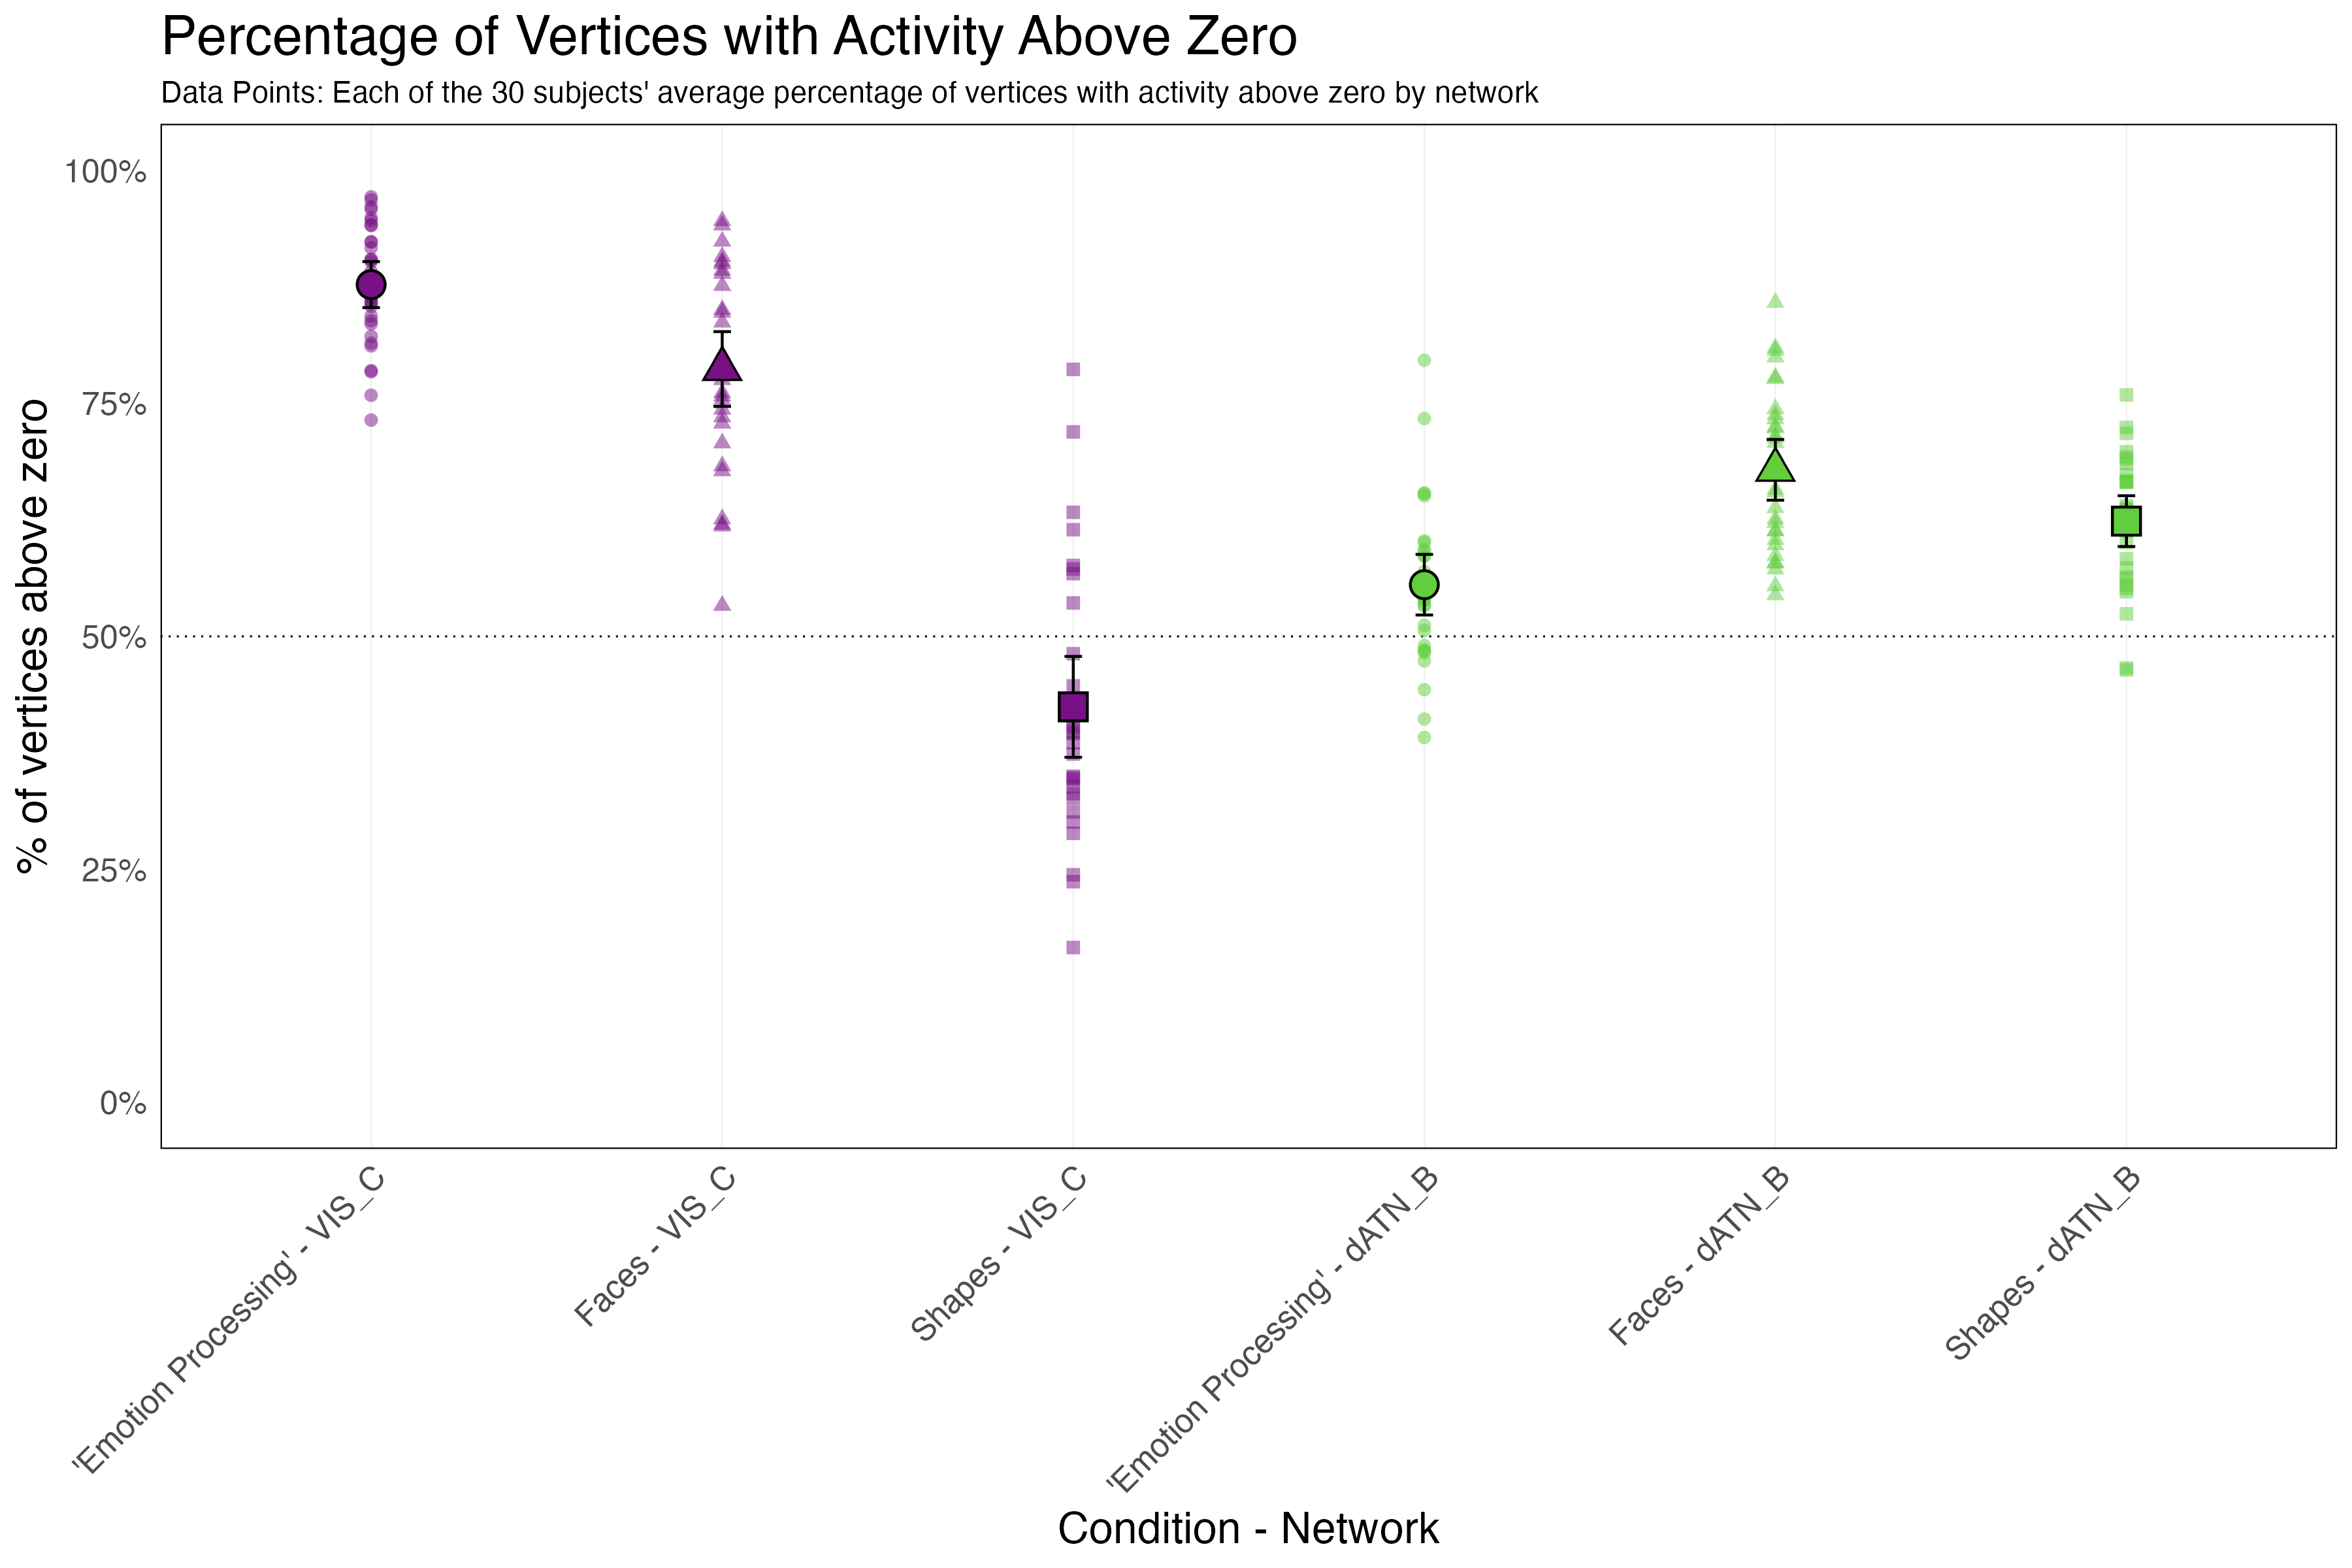
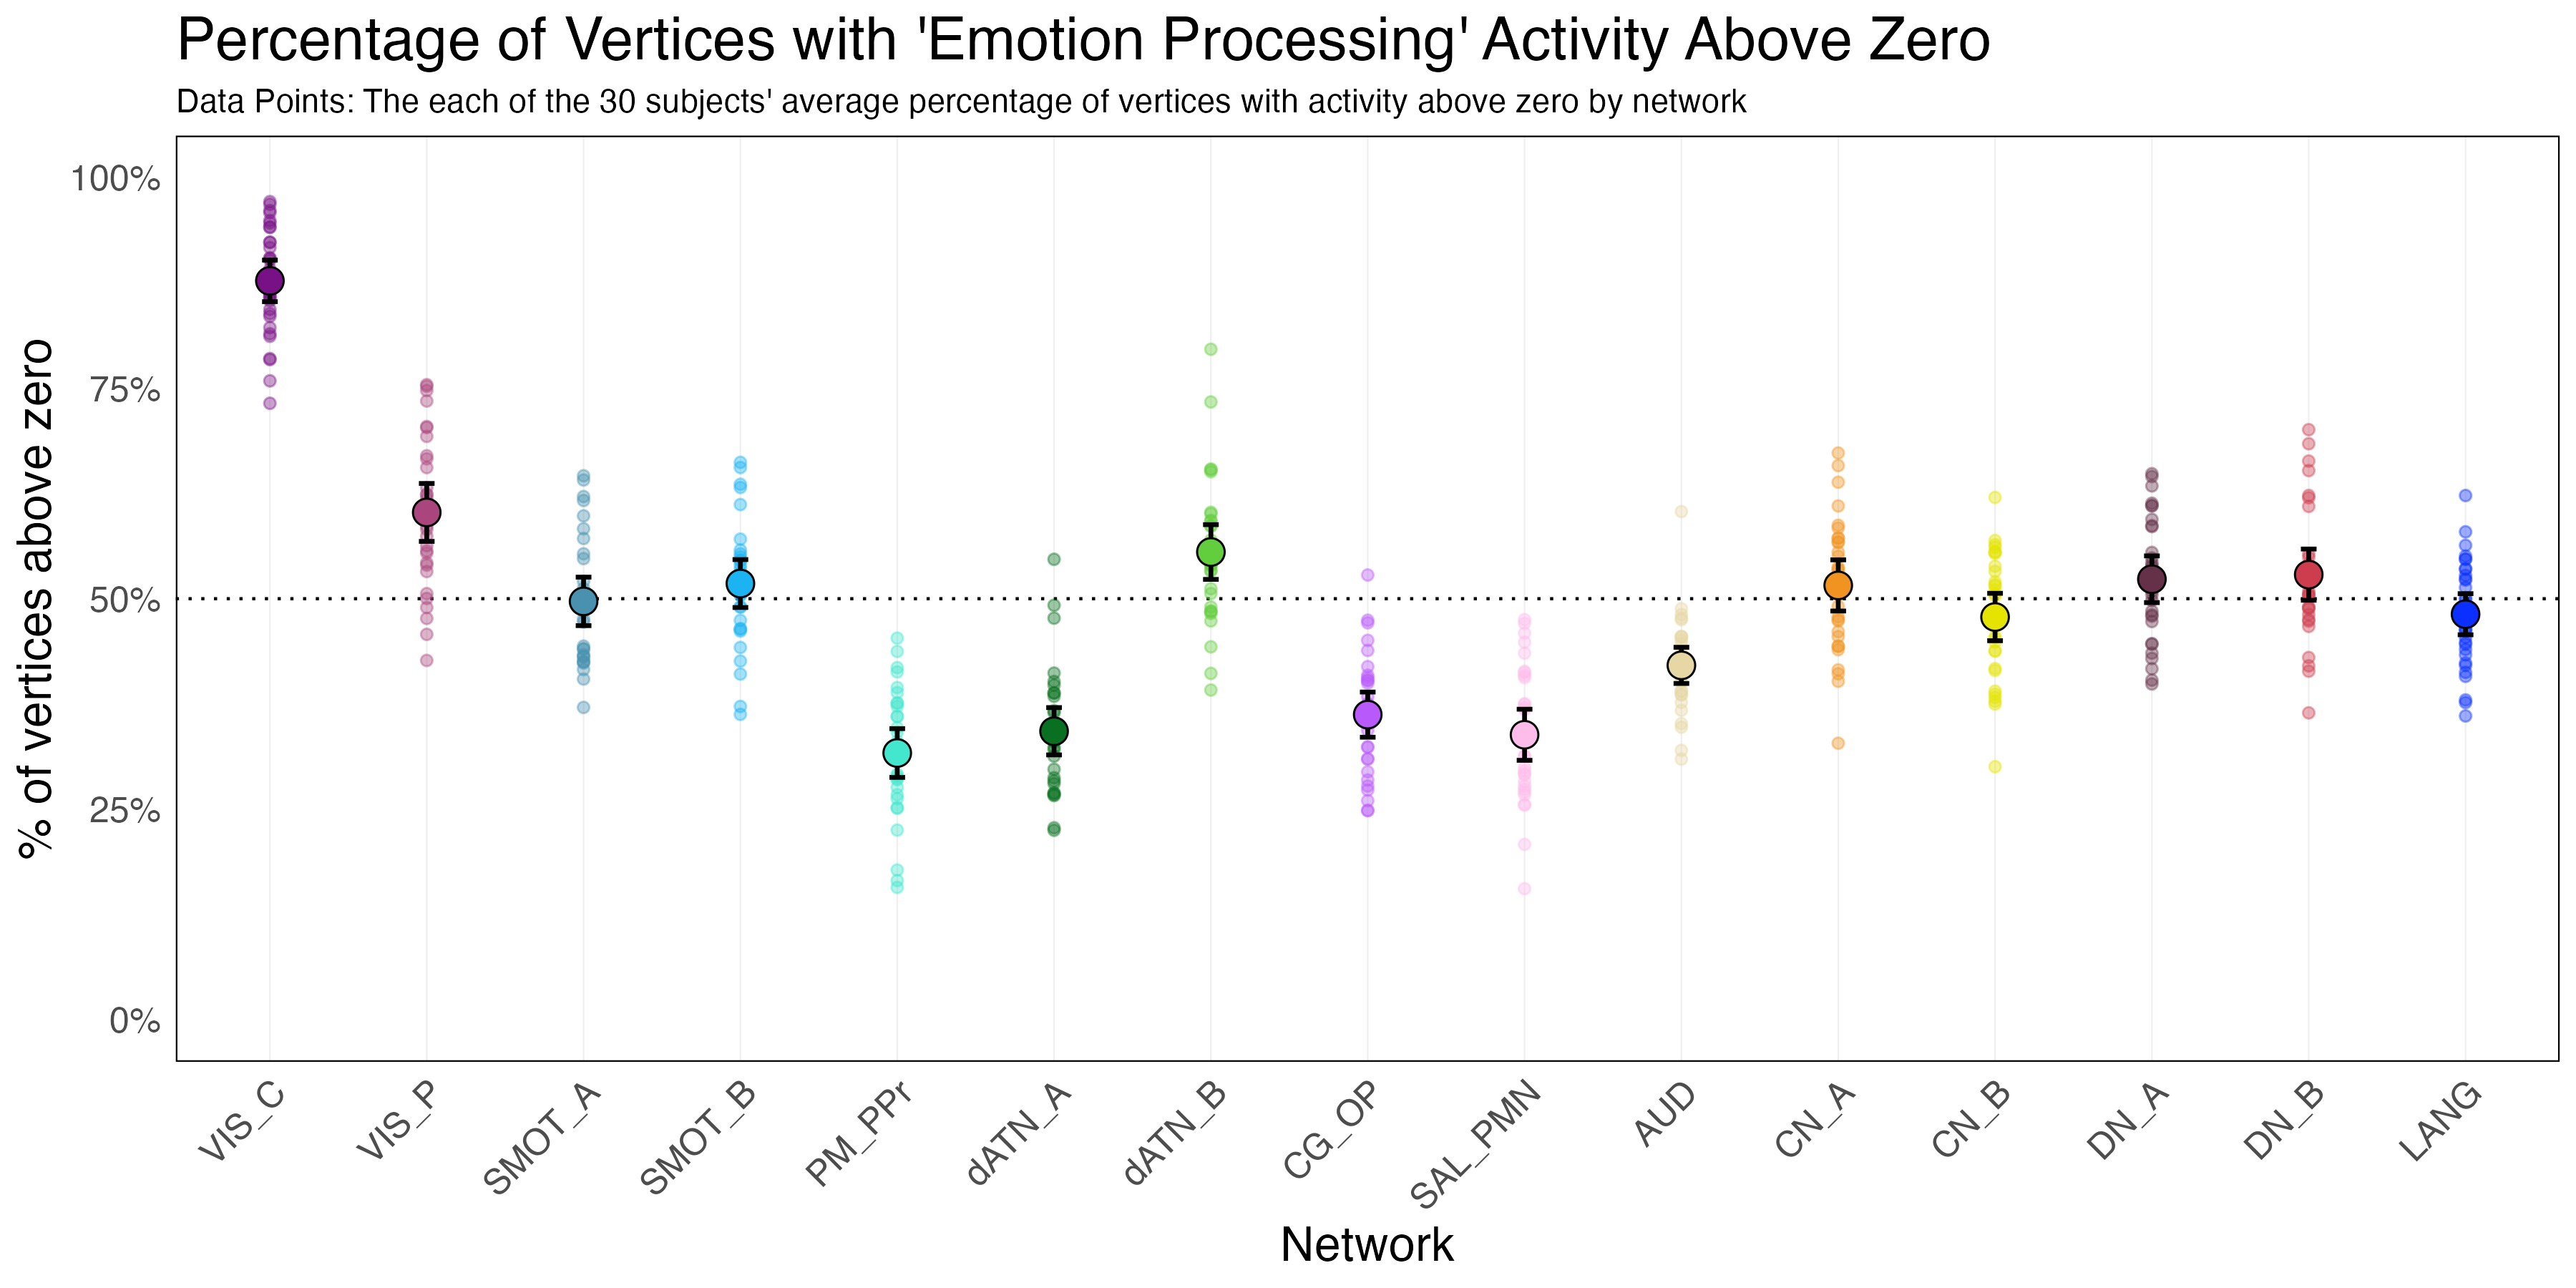
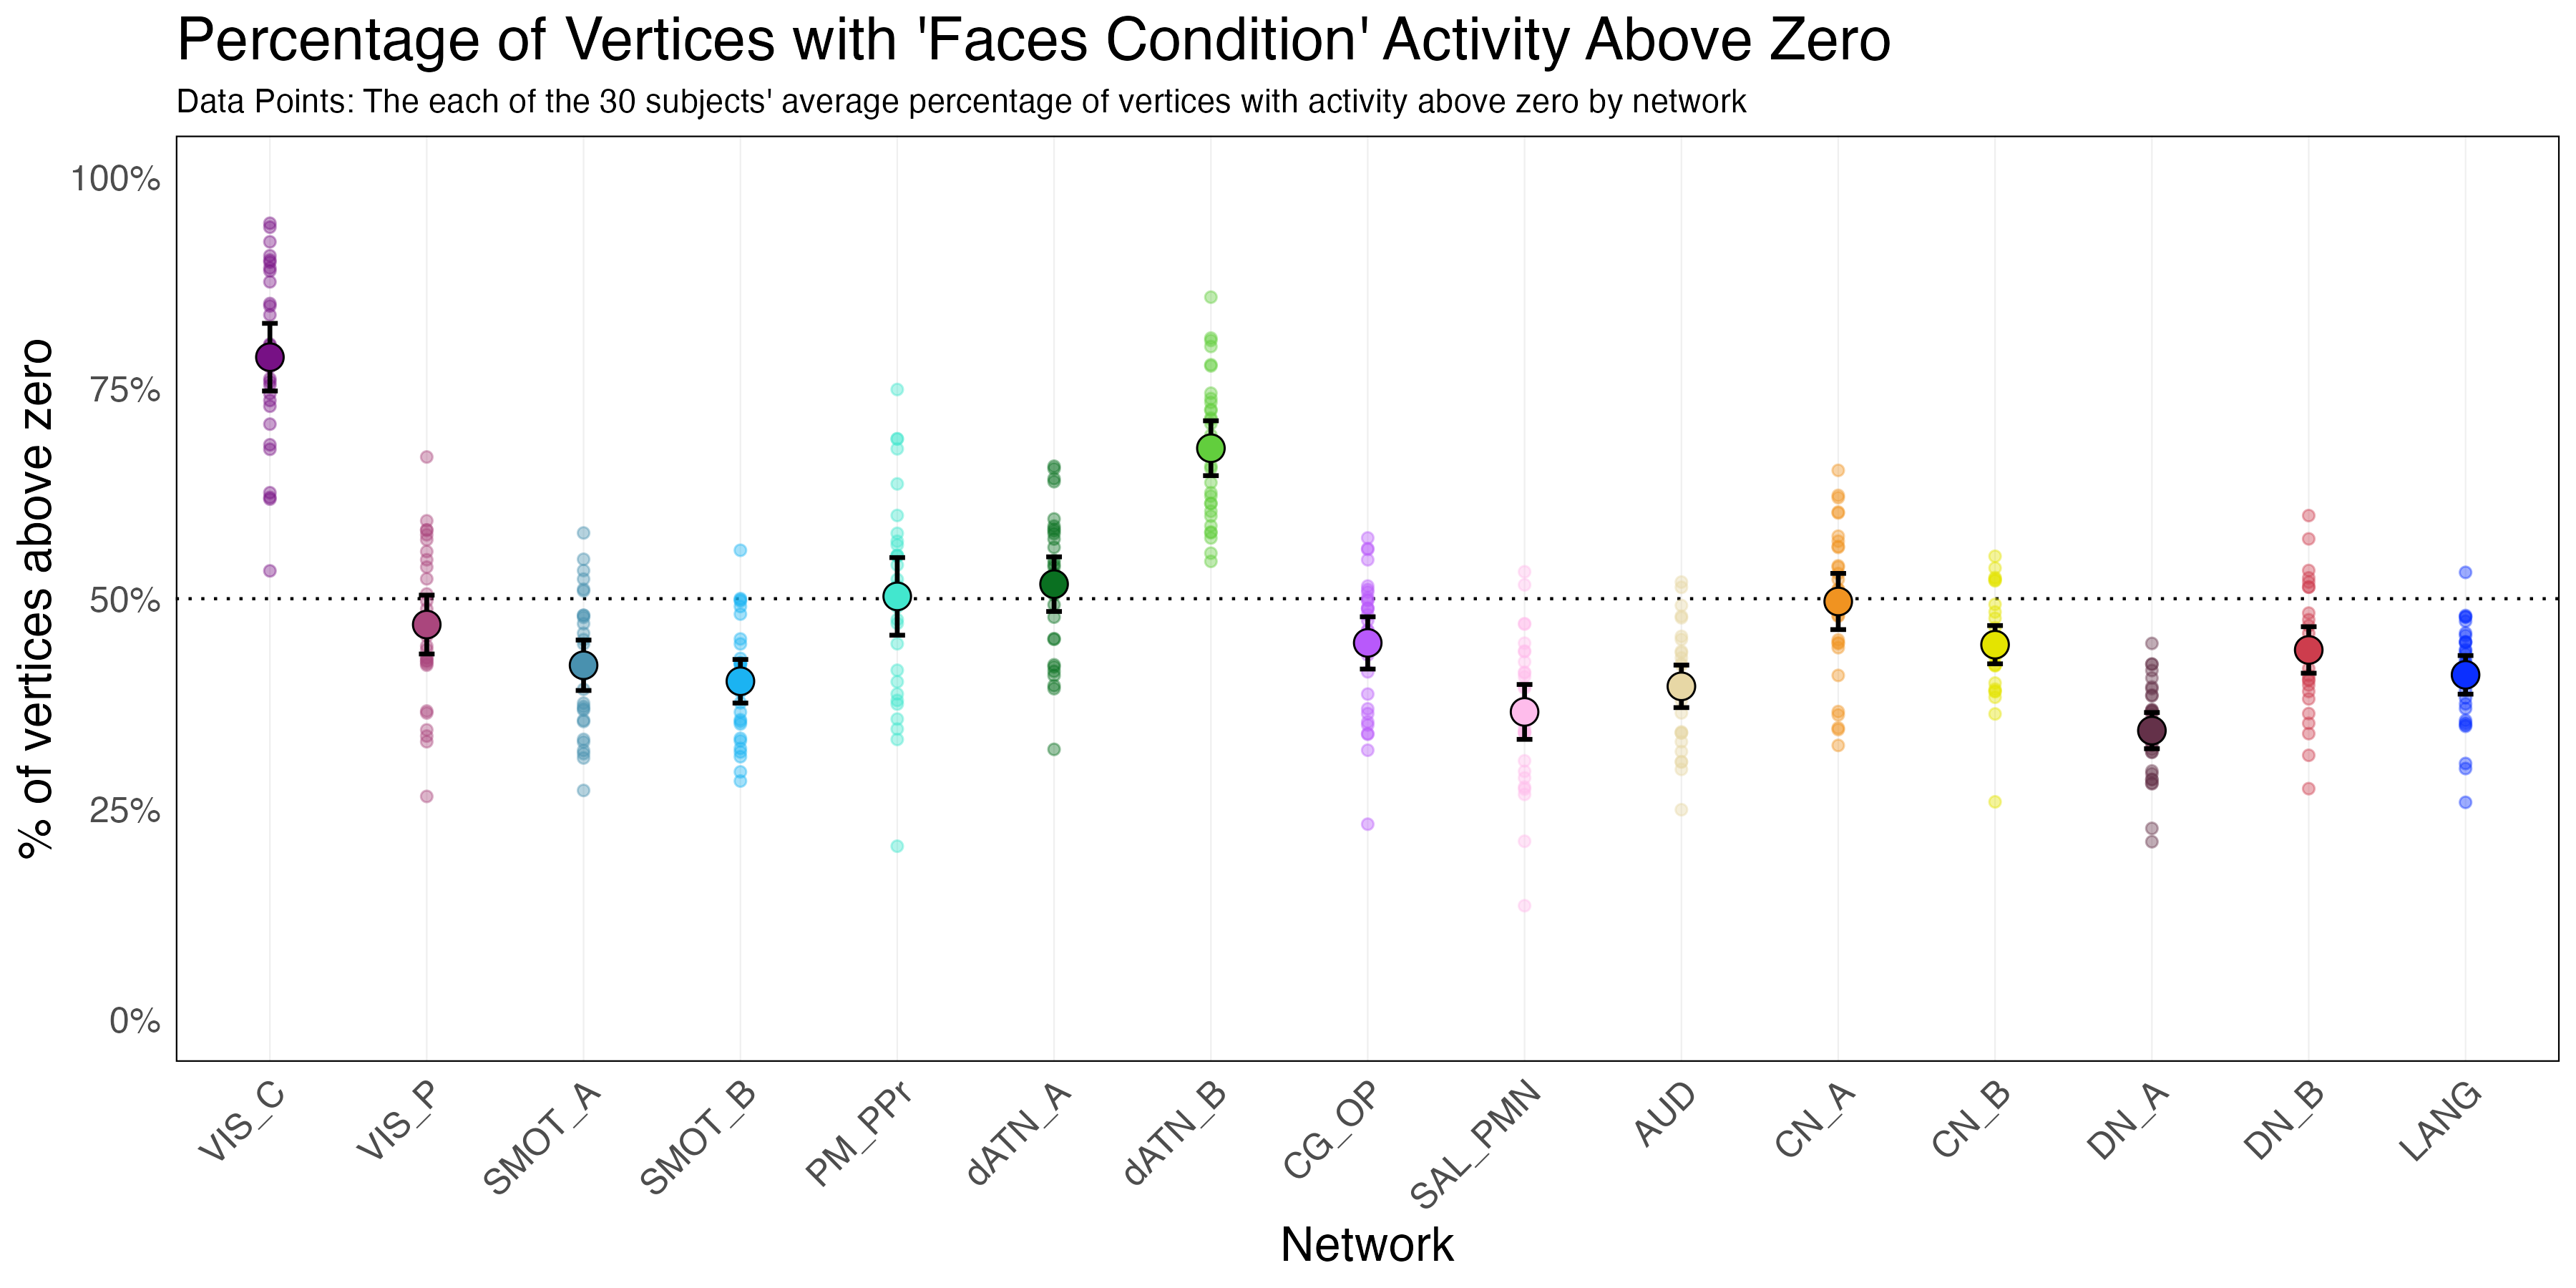
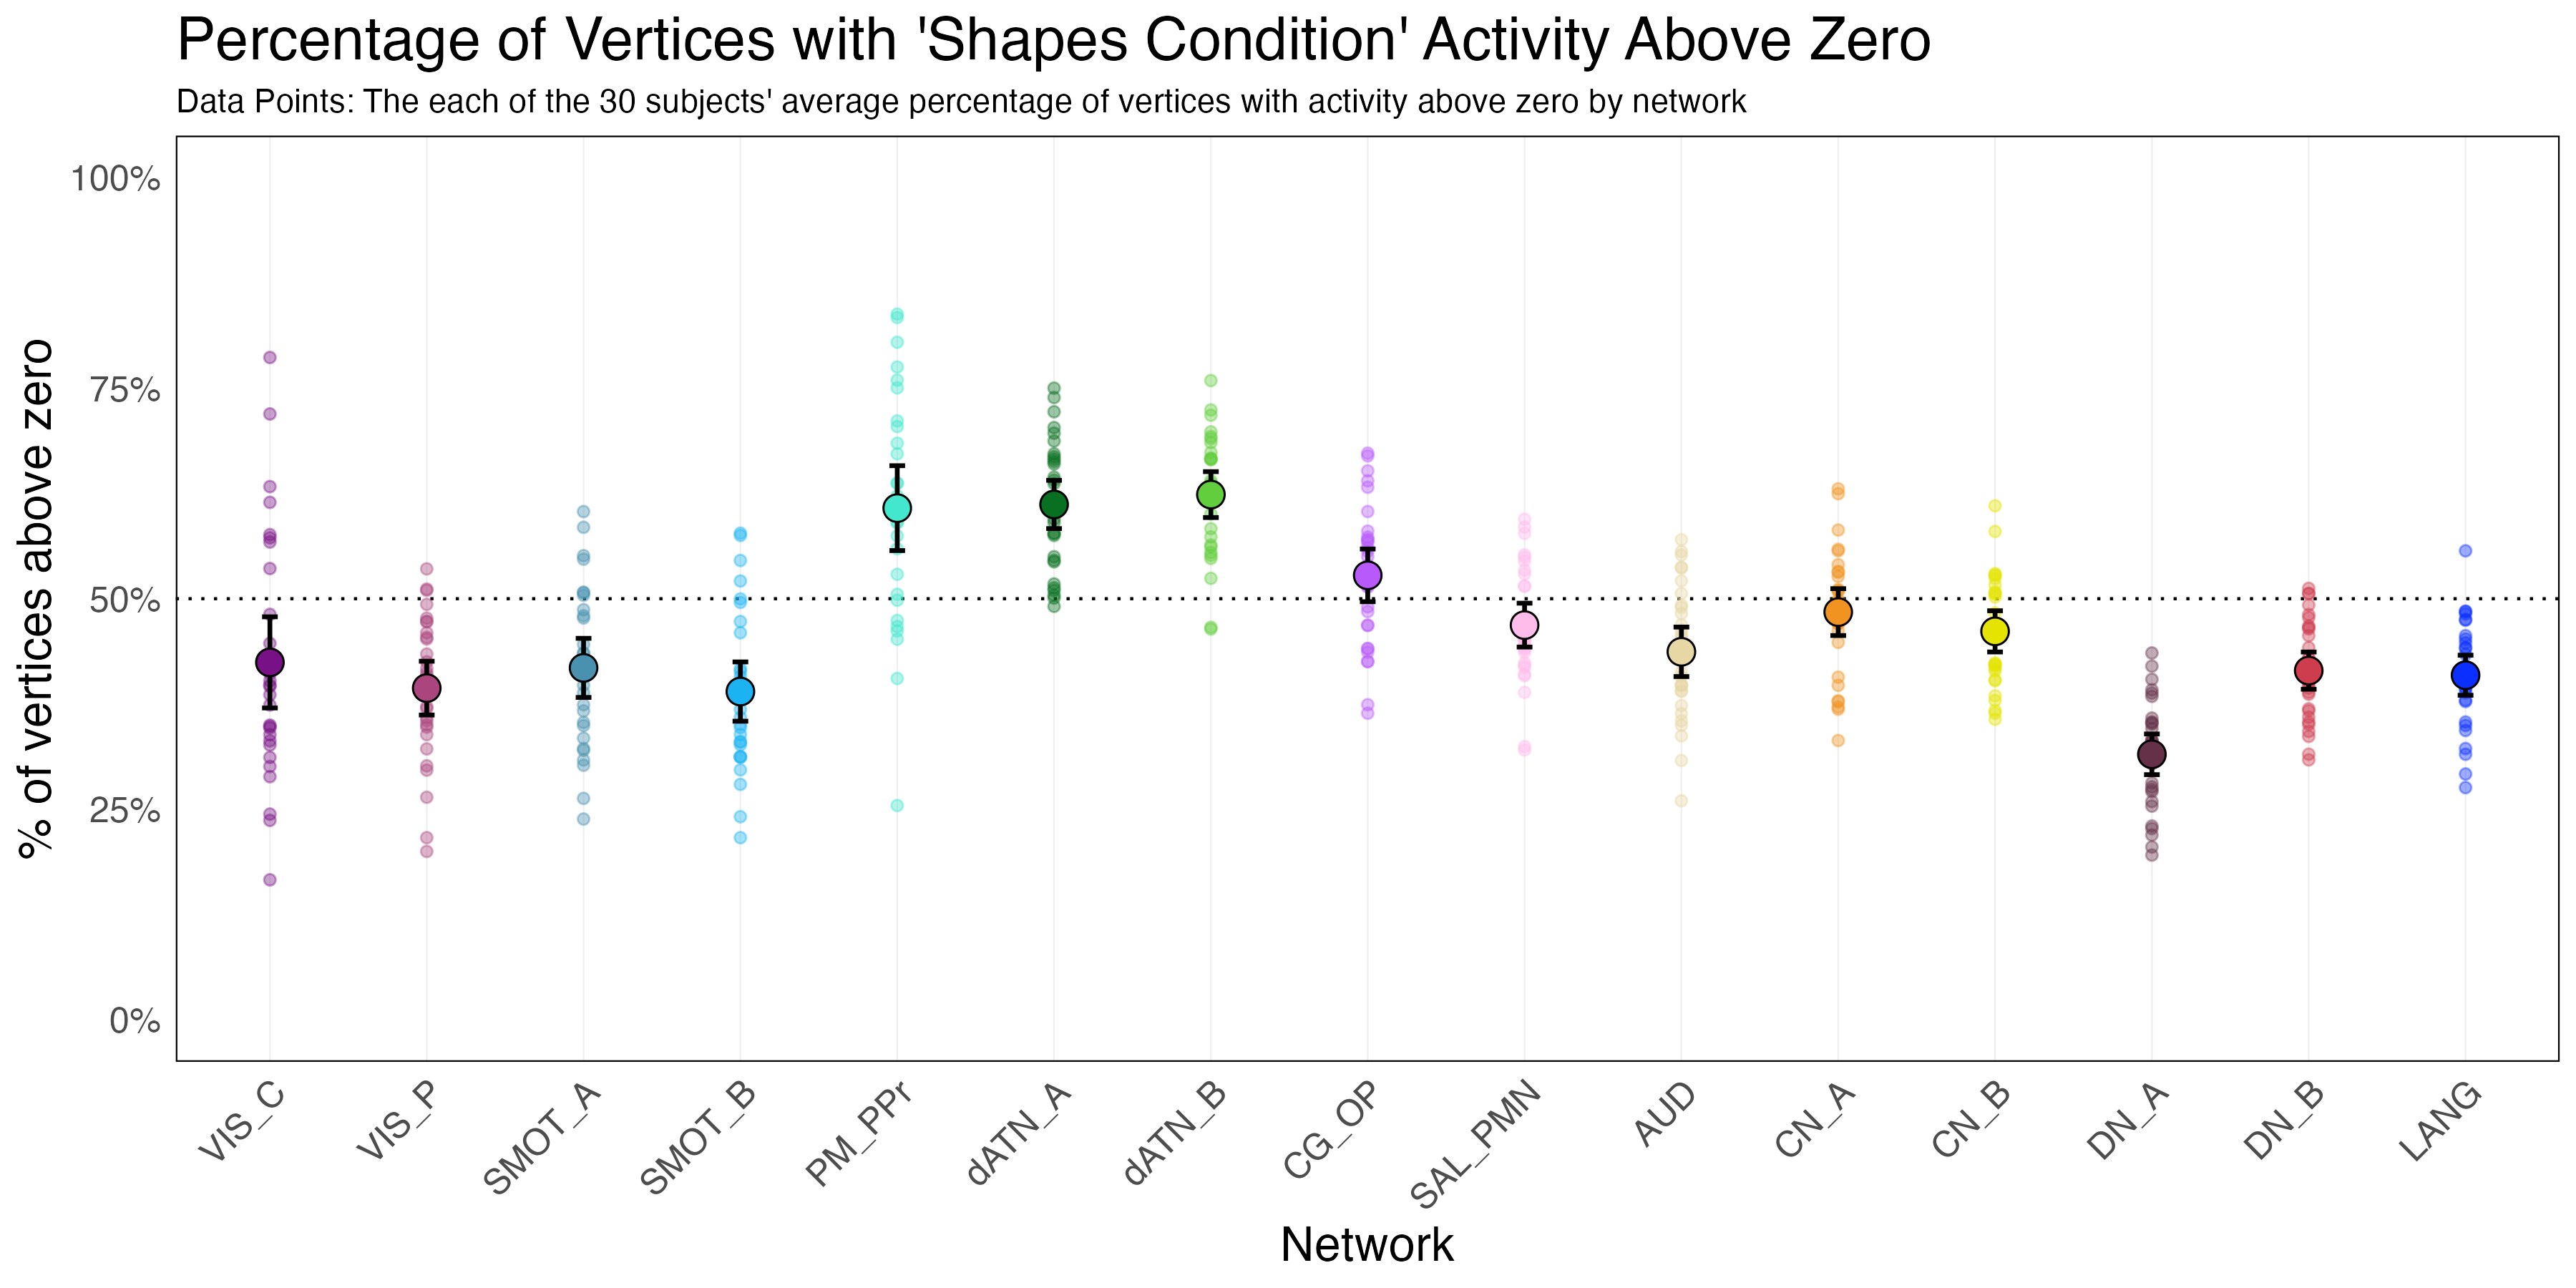
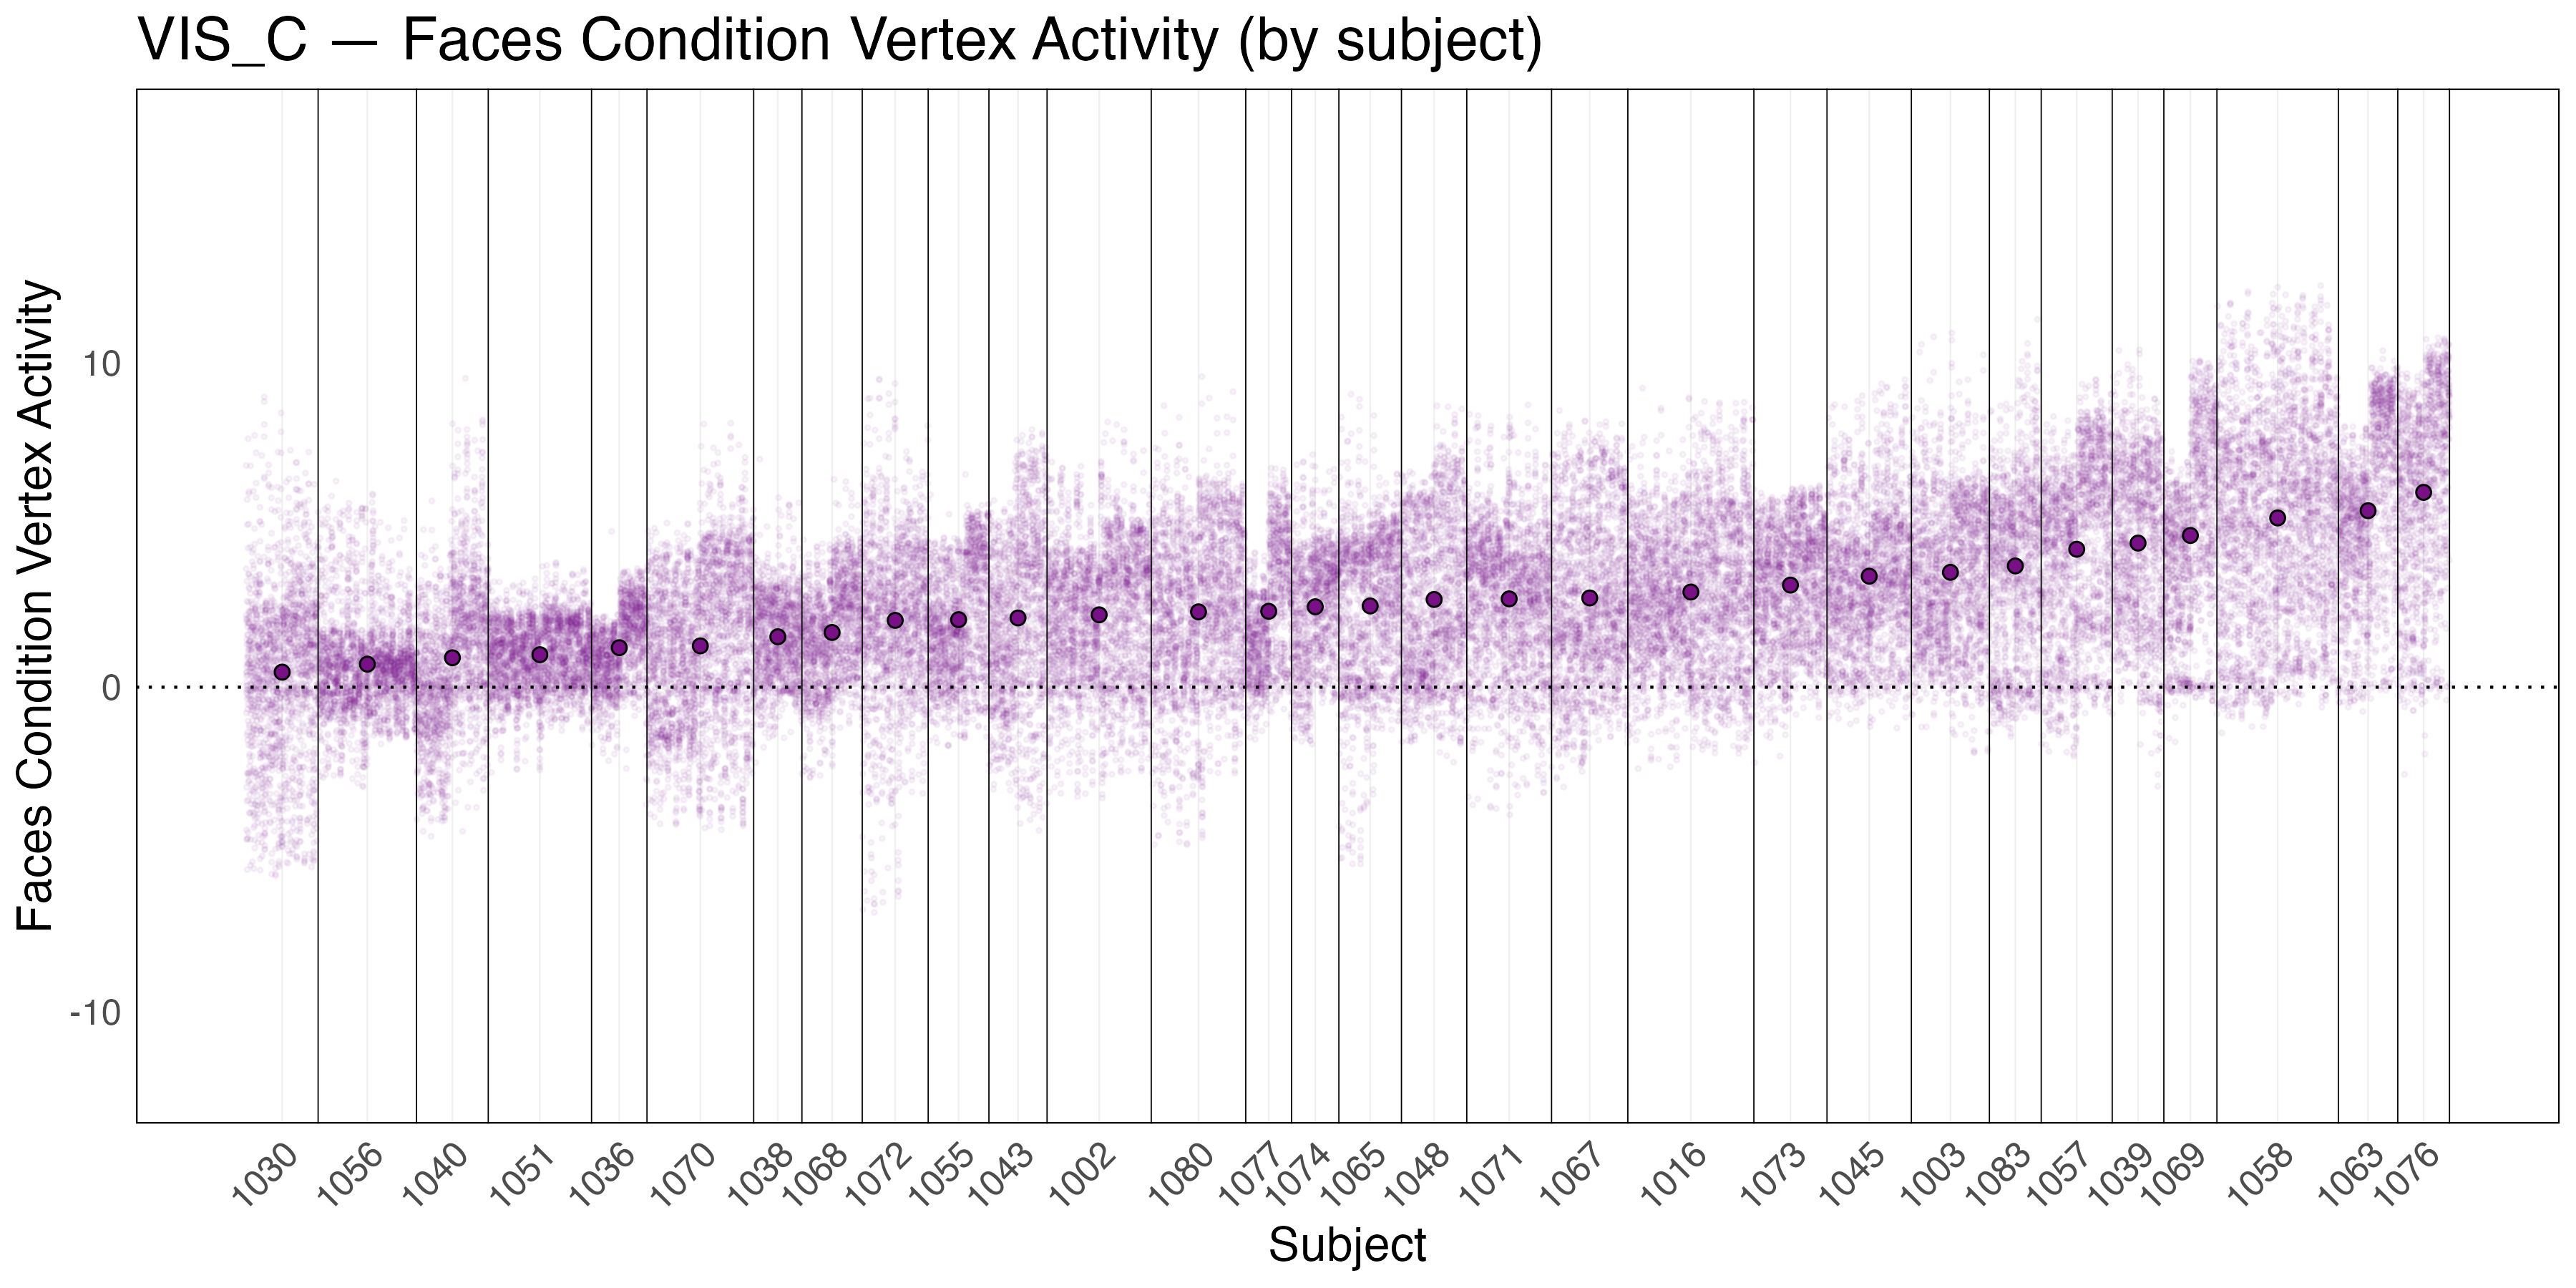
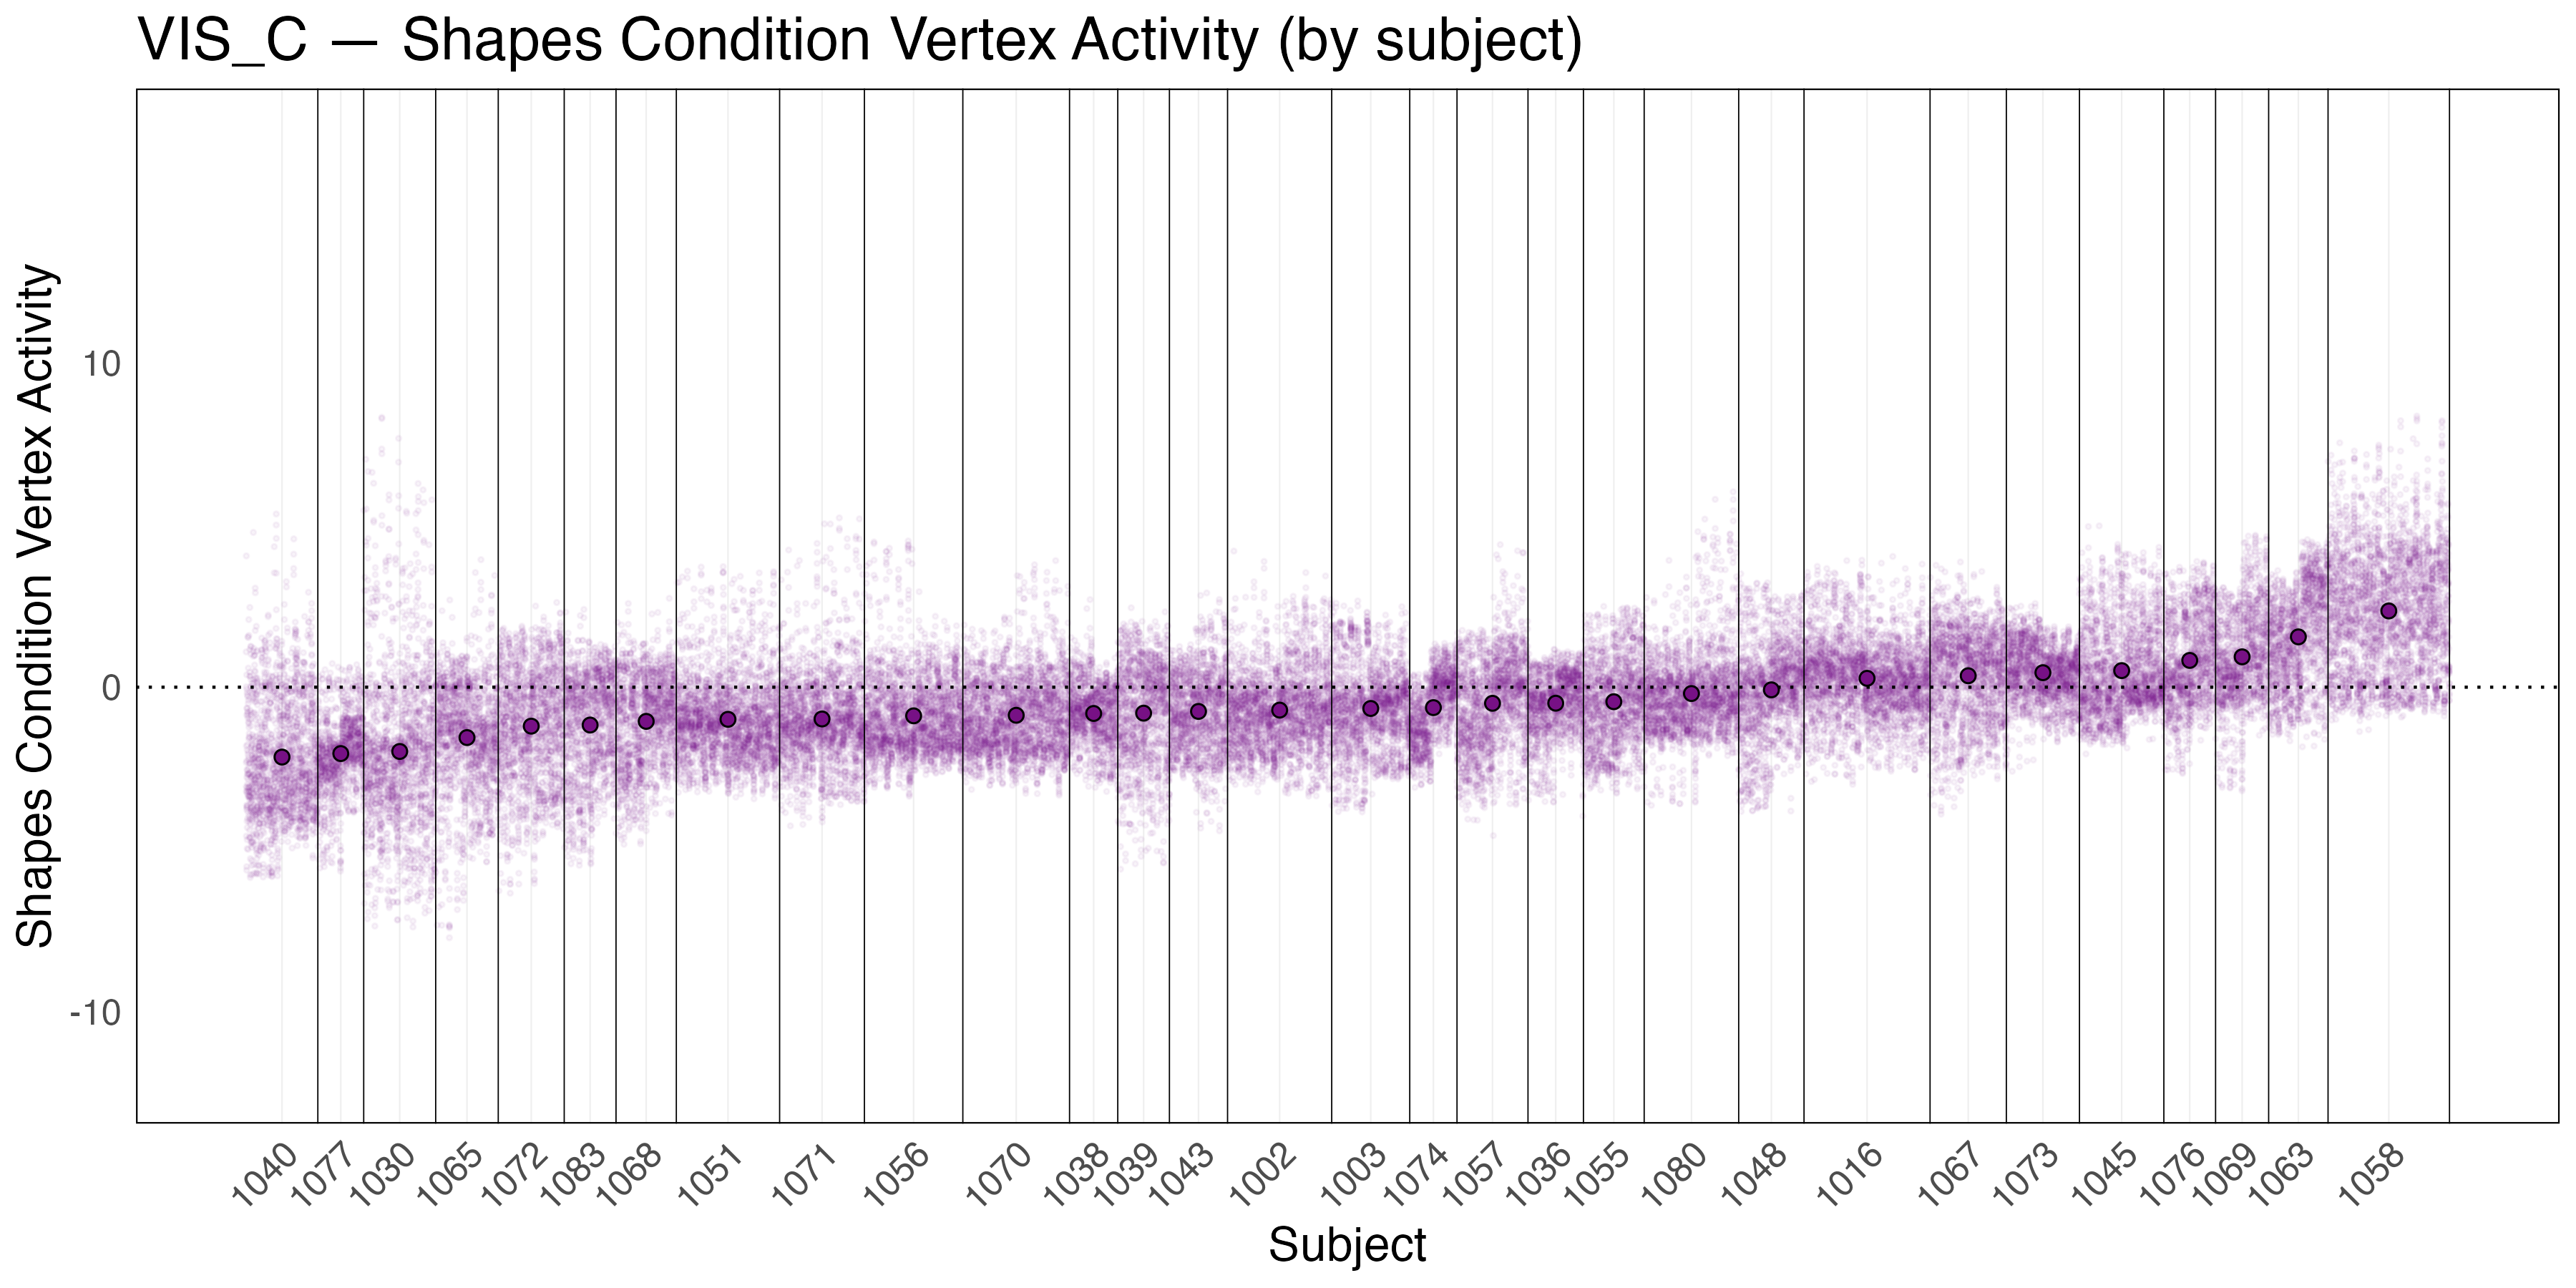
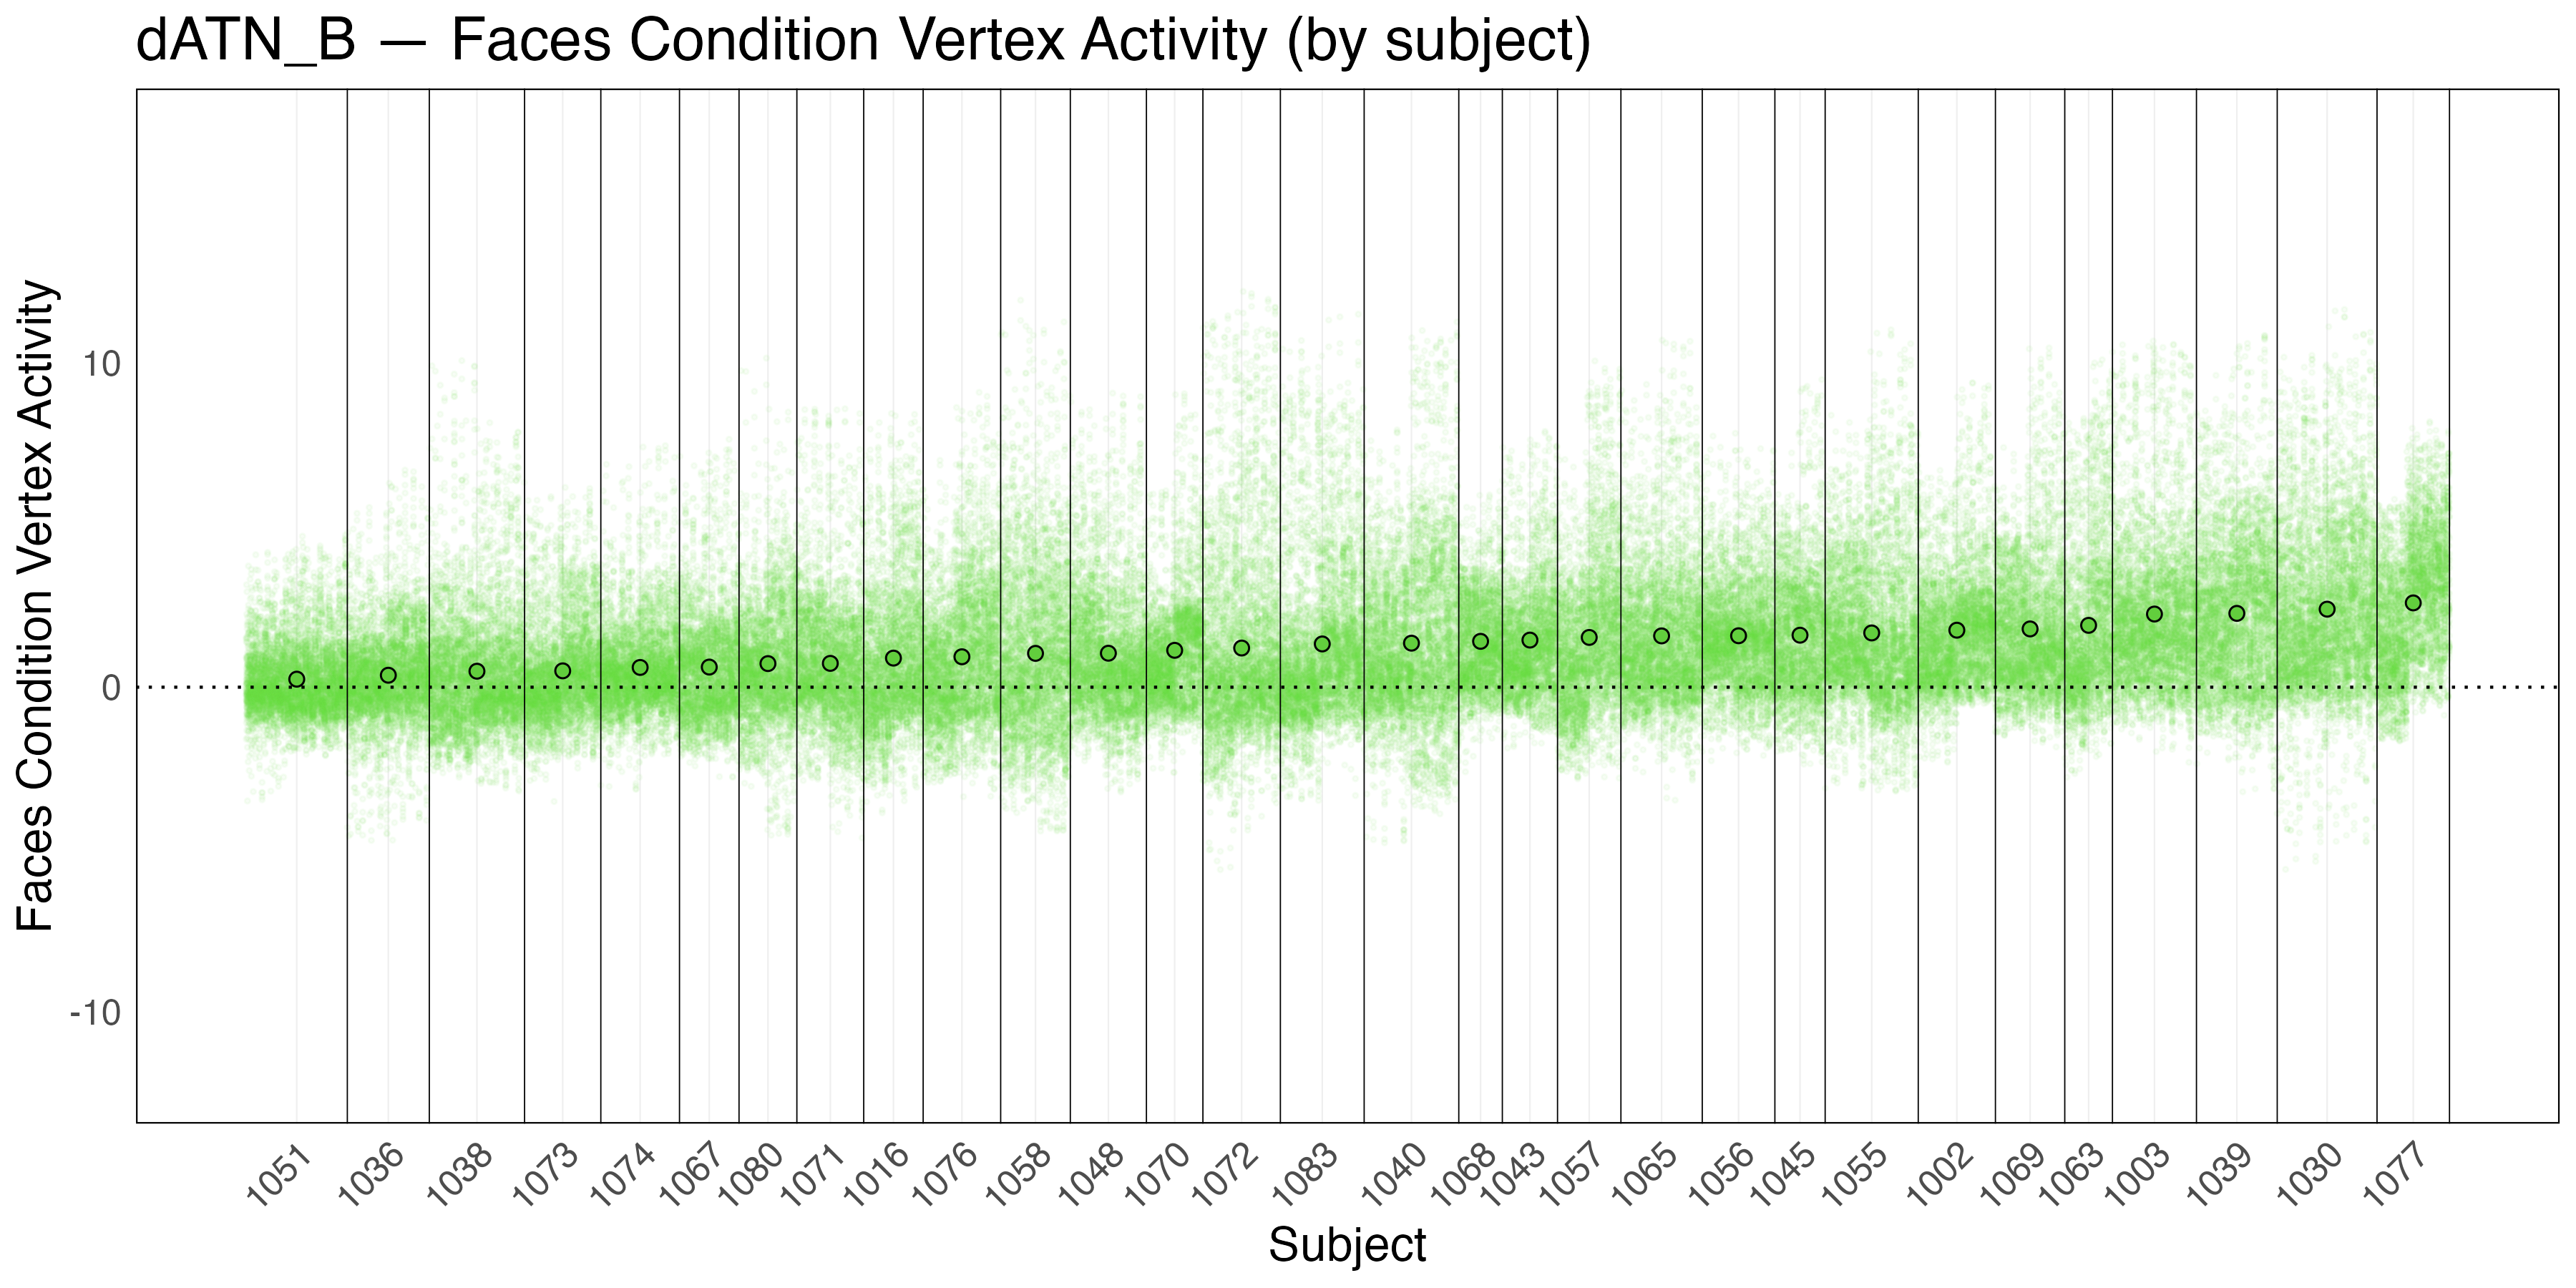
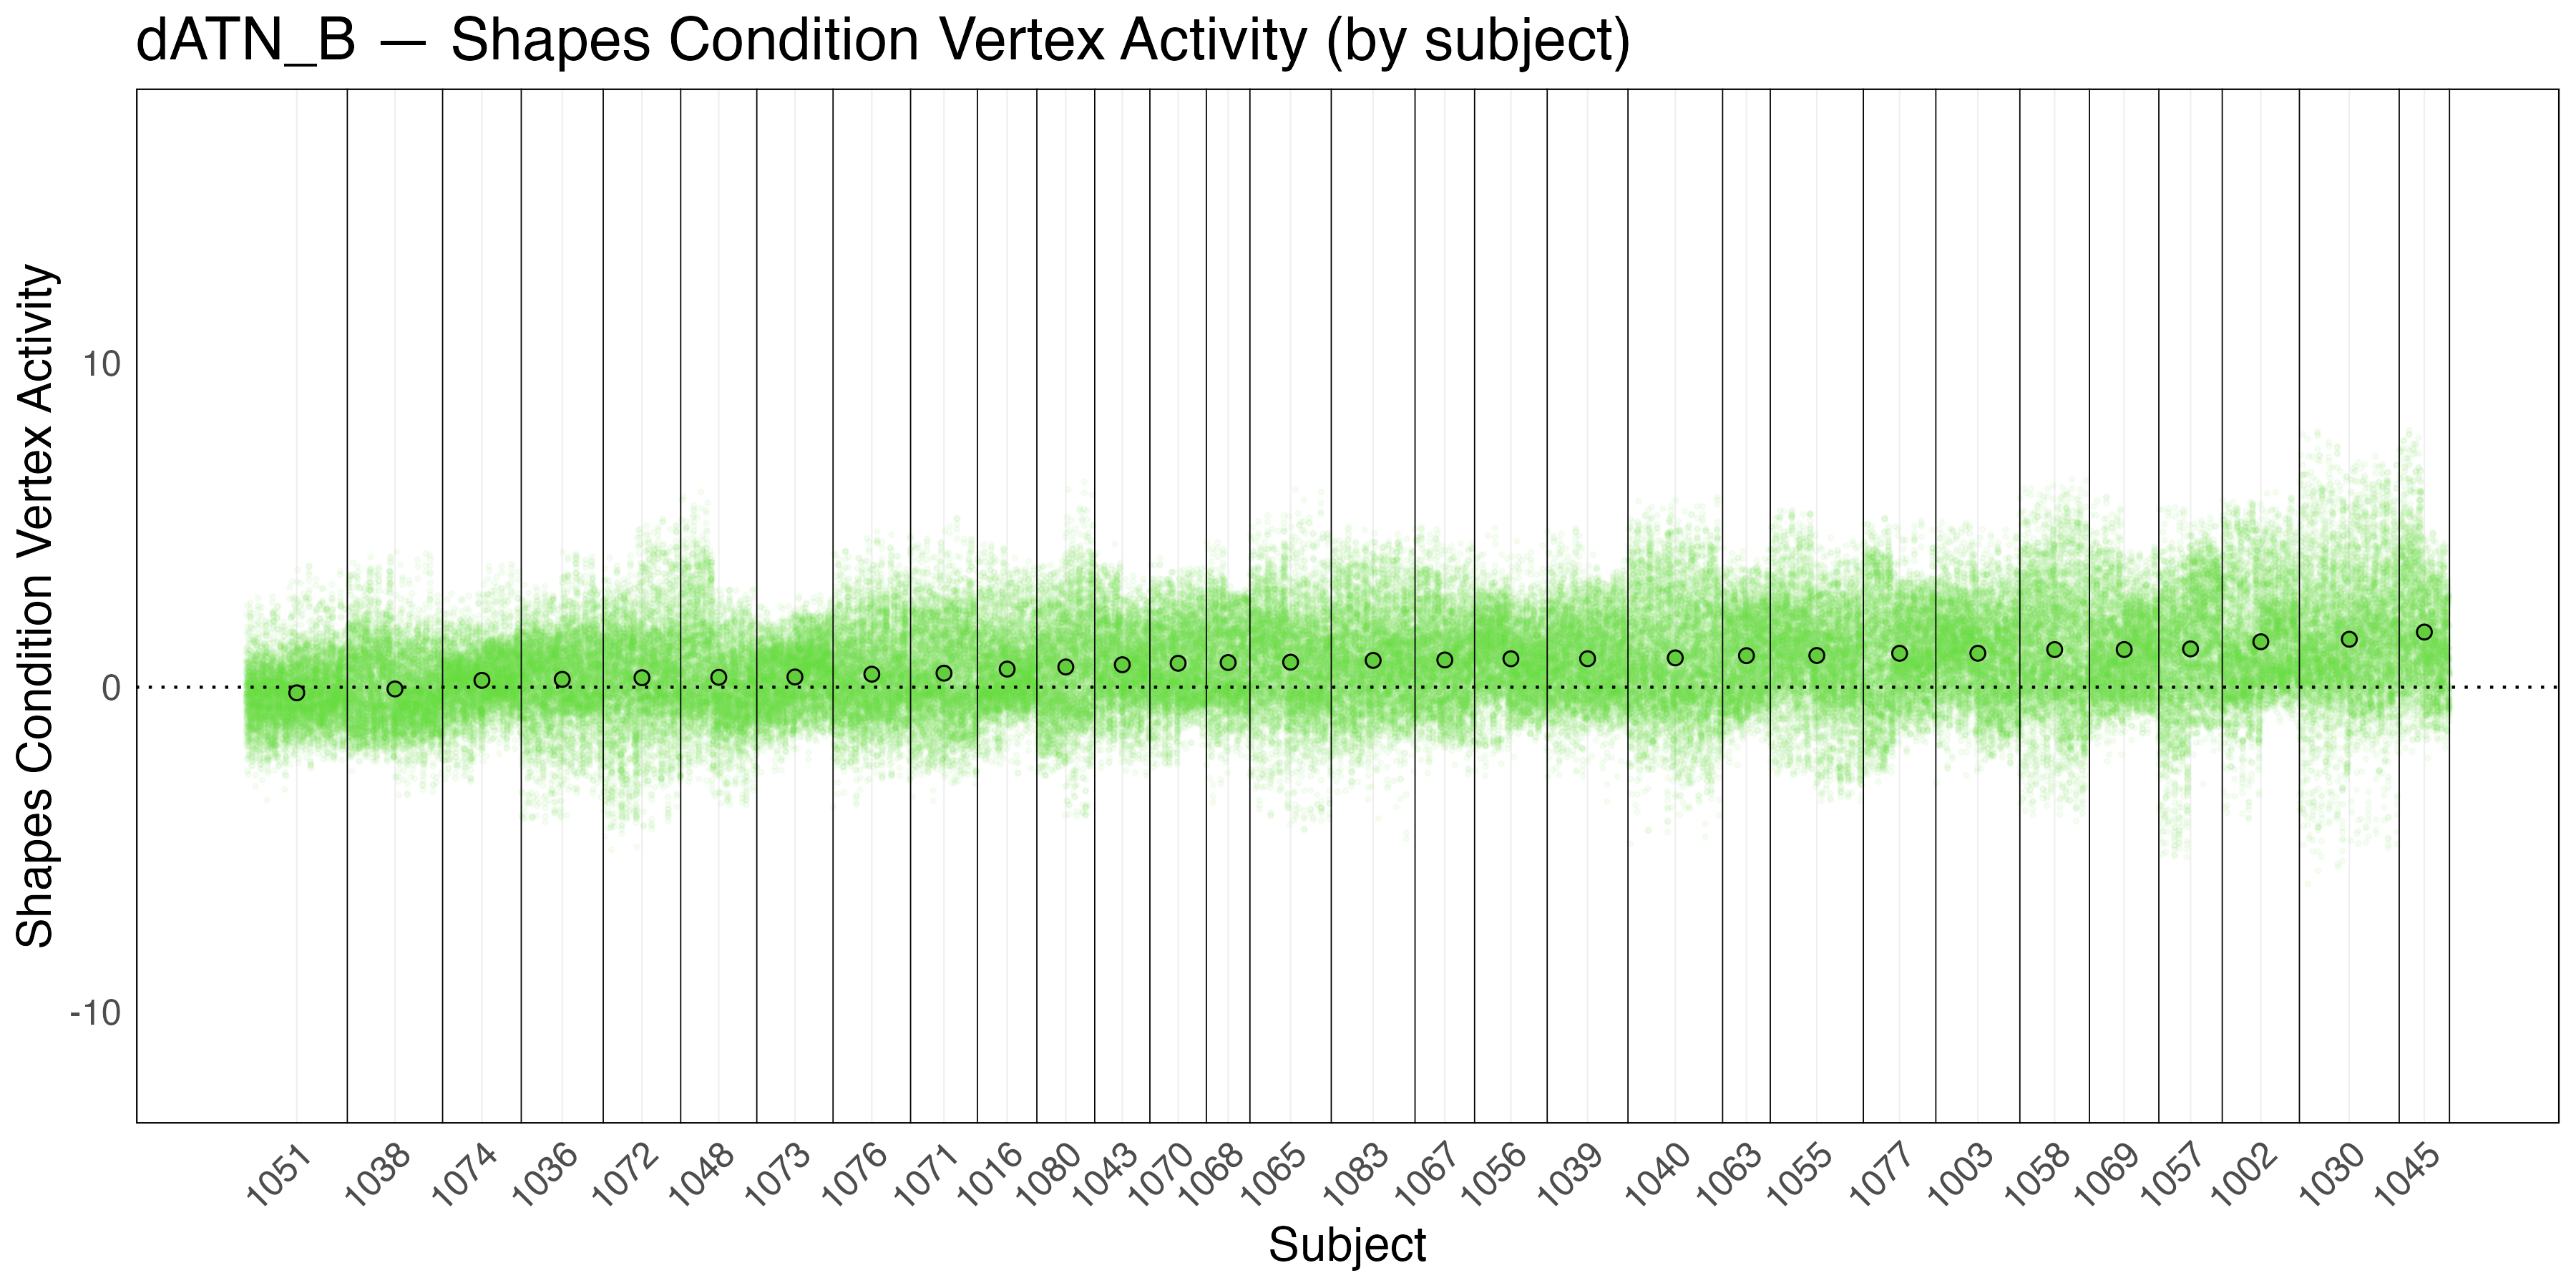
Percent Activity Above Zero - Observations. As seen in the plot above, on average, 88% of vertices in the visual-central network (VIS-C) have ‘emotion processing’ activity above zero. The average percent activity above zero for the dorsal attention network B (dATN_B) is much lower at 56%. However, the averages for each condition independently are higher (faces at 68% and shapes at 62%). Examining the plot in the second tab (Tab 2) shows that the visual-central network (VIS-C) and the dorsal attention network B (dATN_B) are the only networks that exhibit meaningful percent activity above 0.
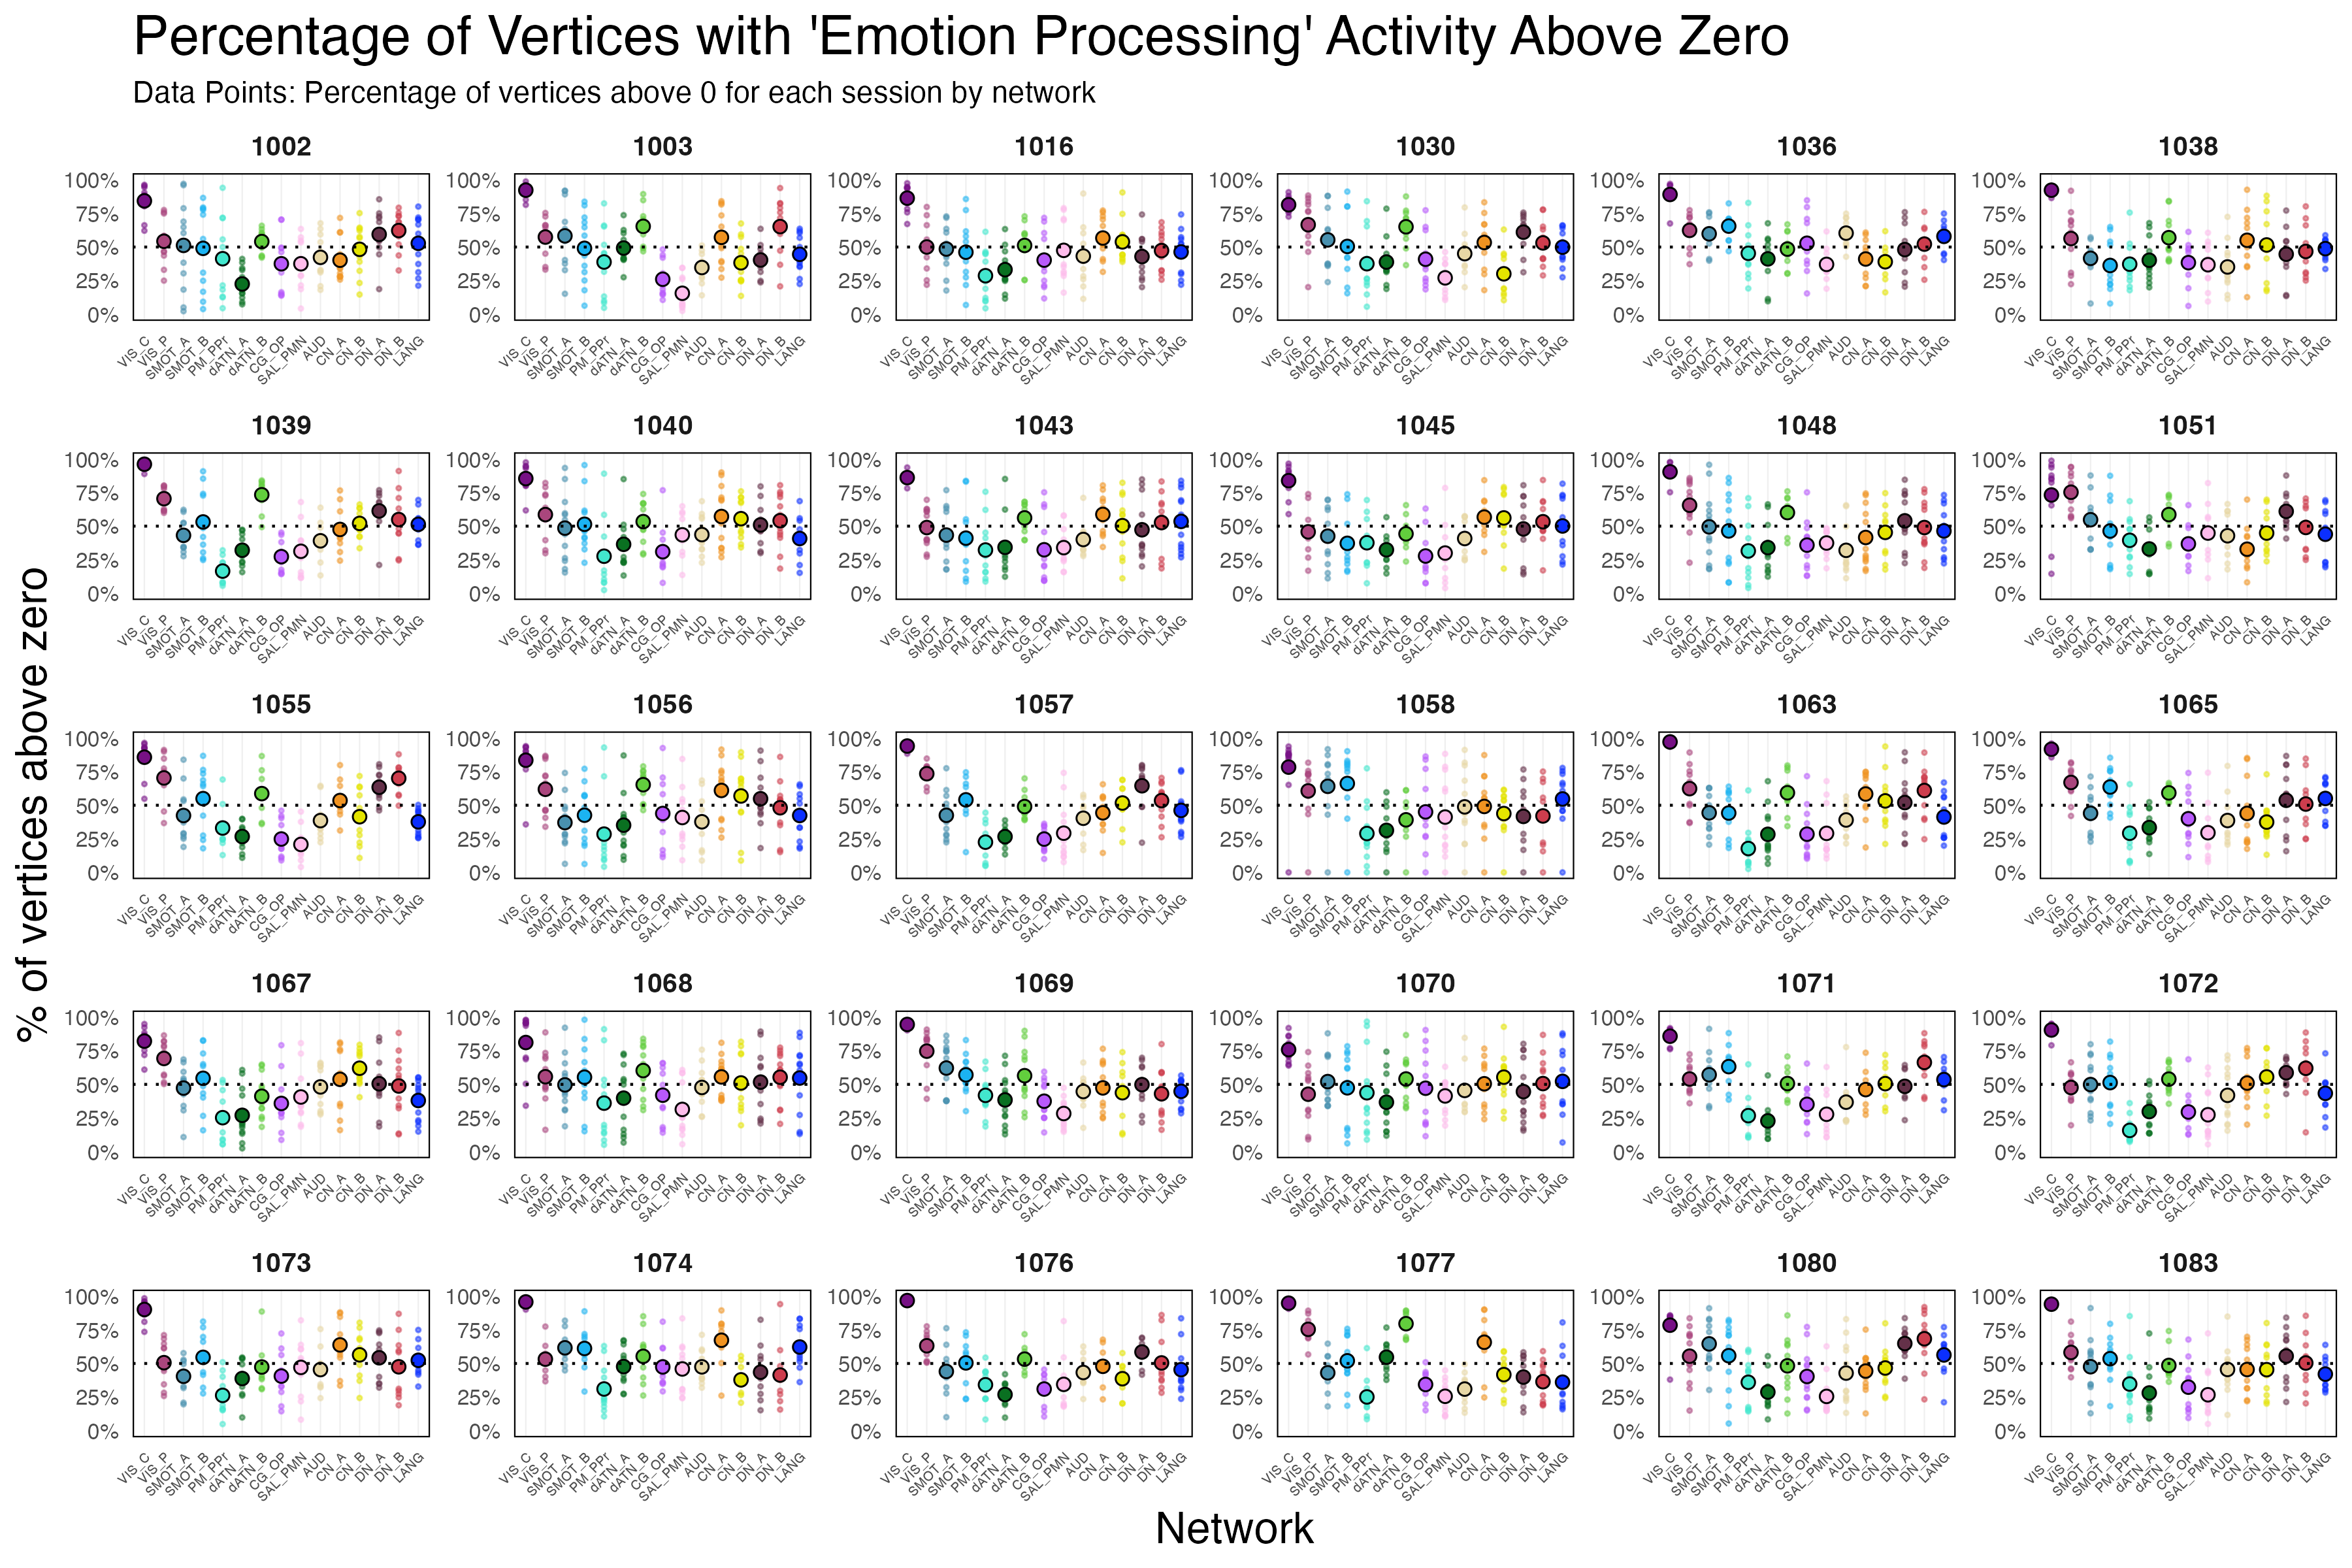
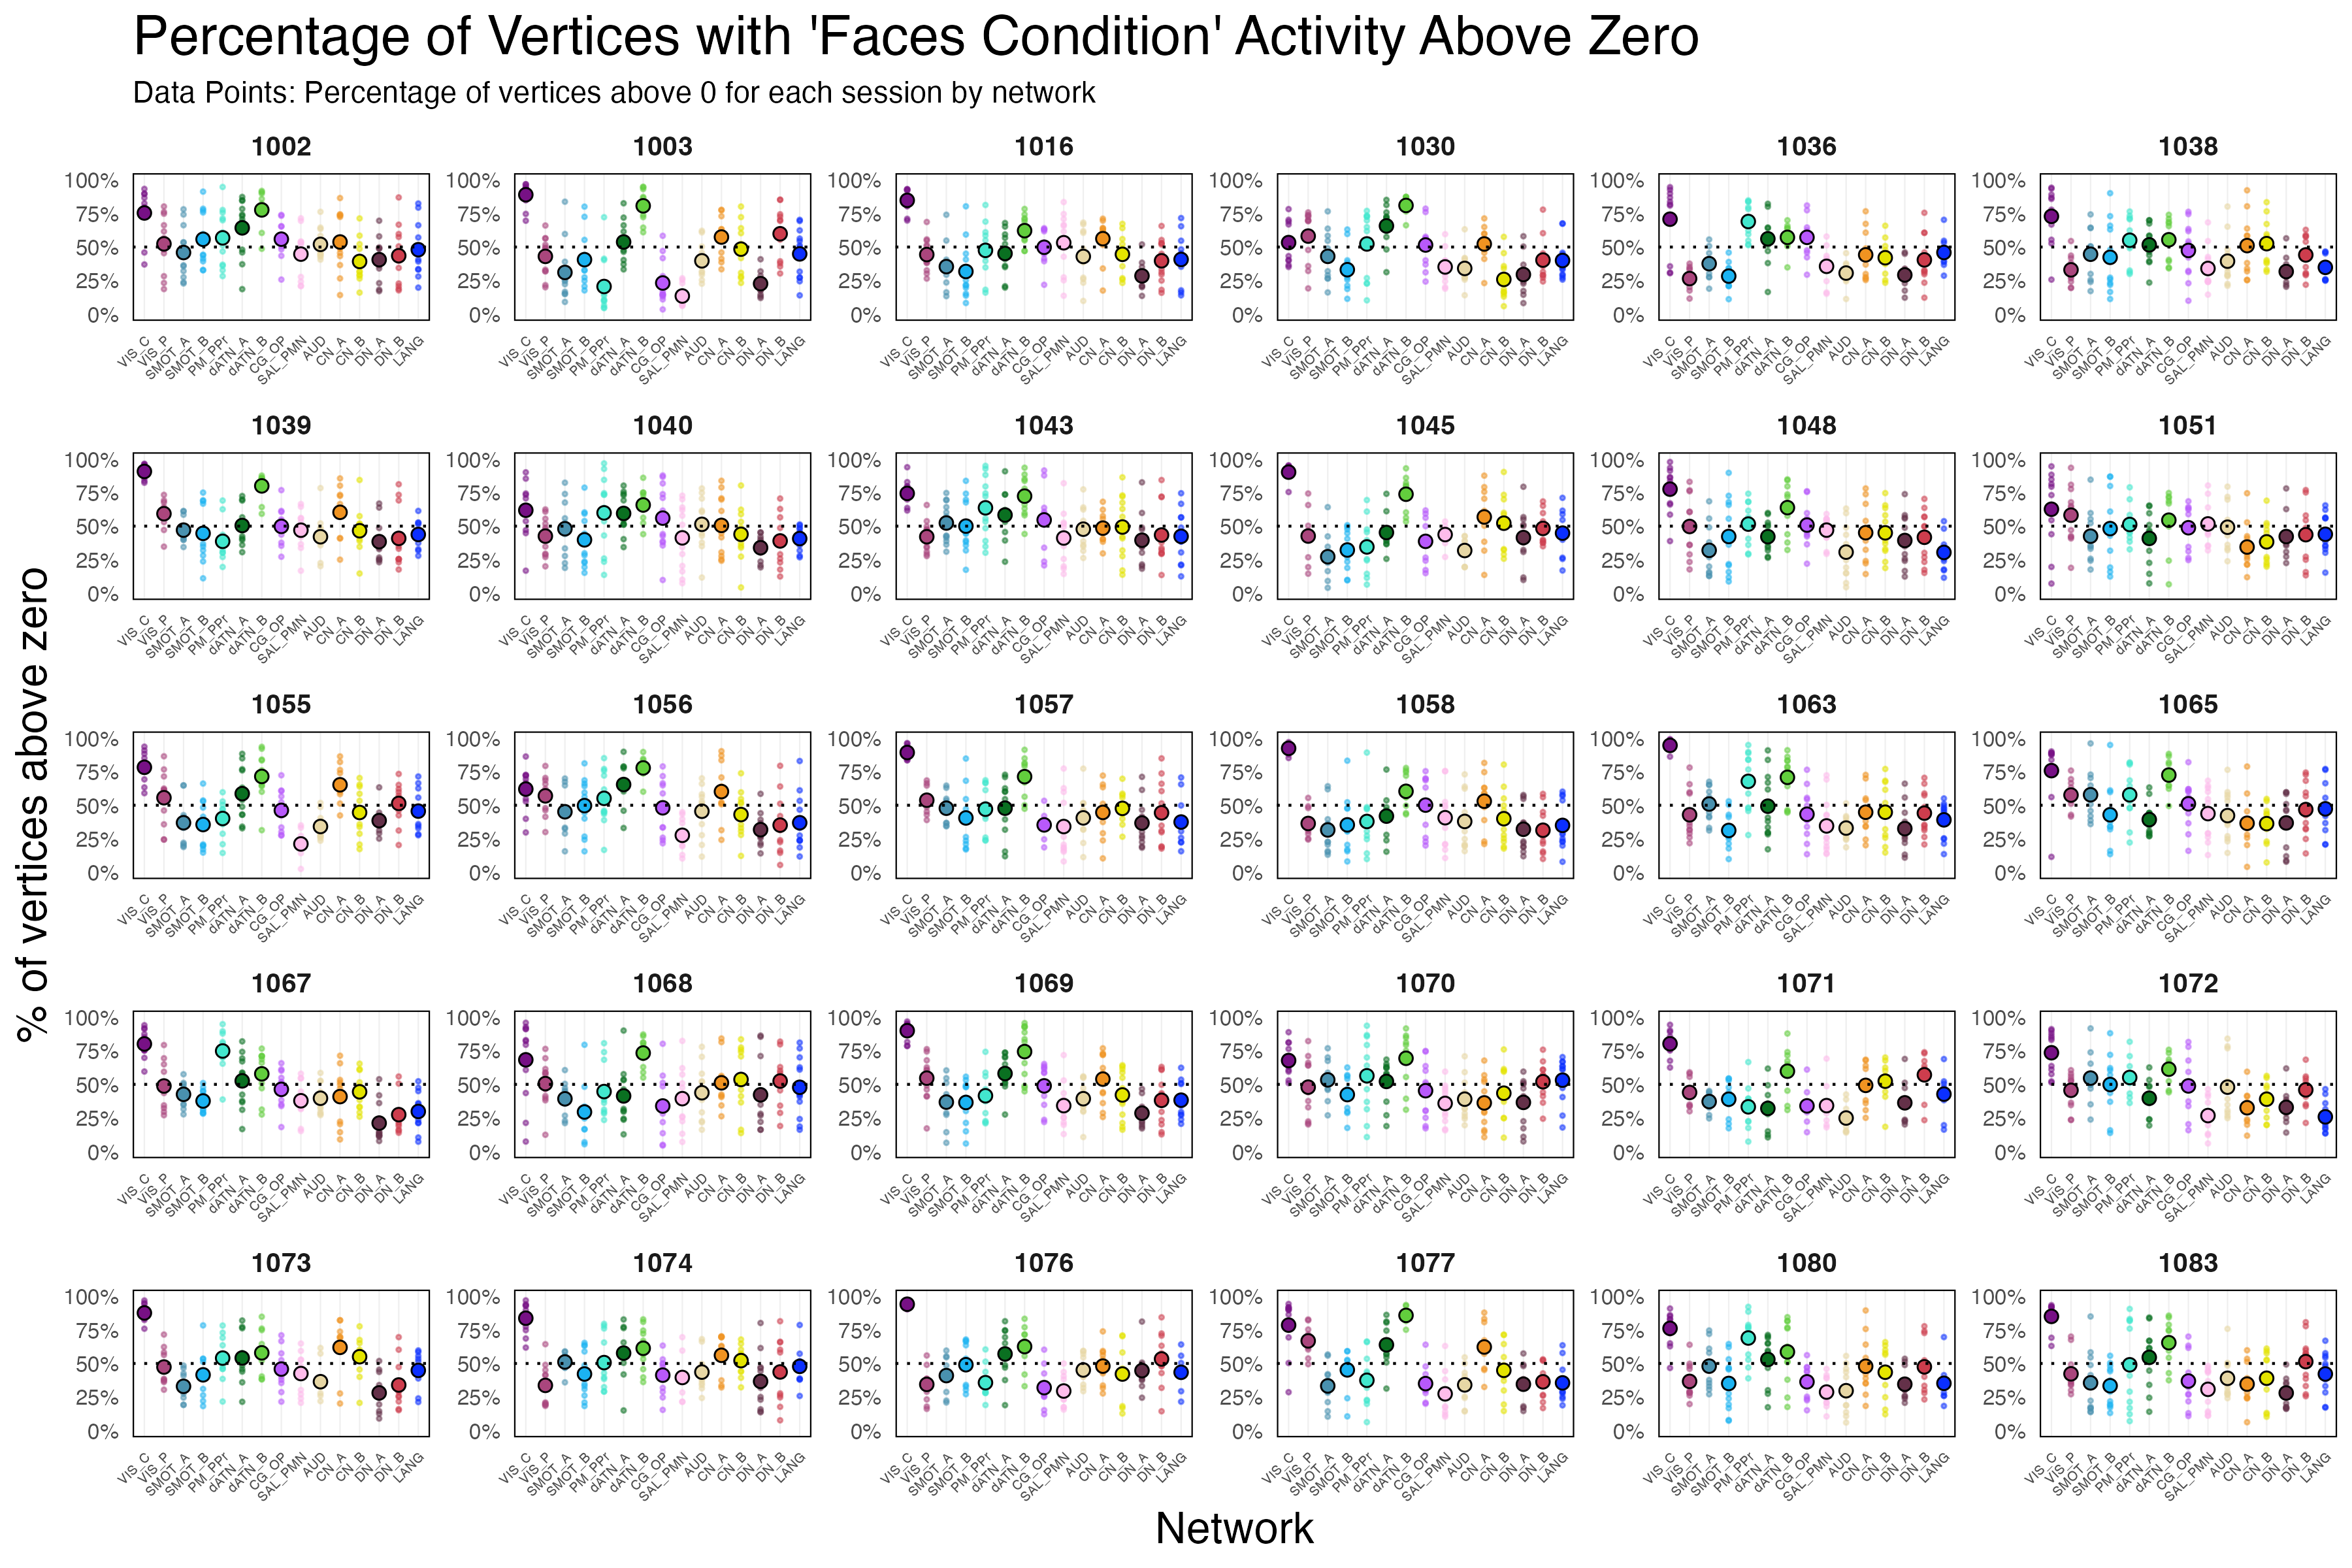
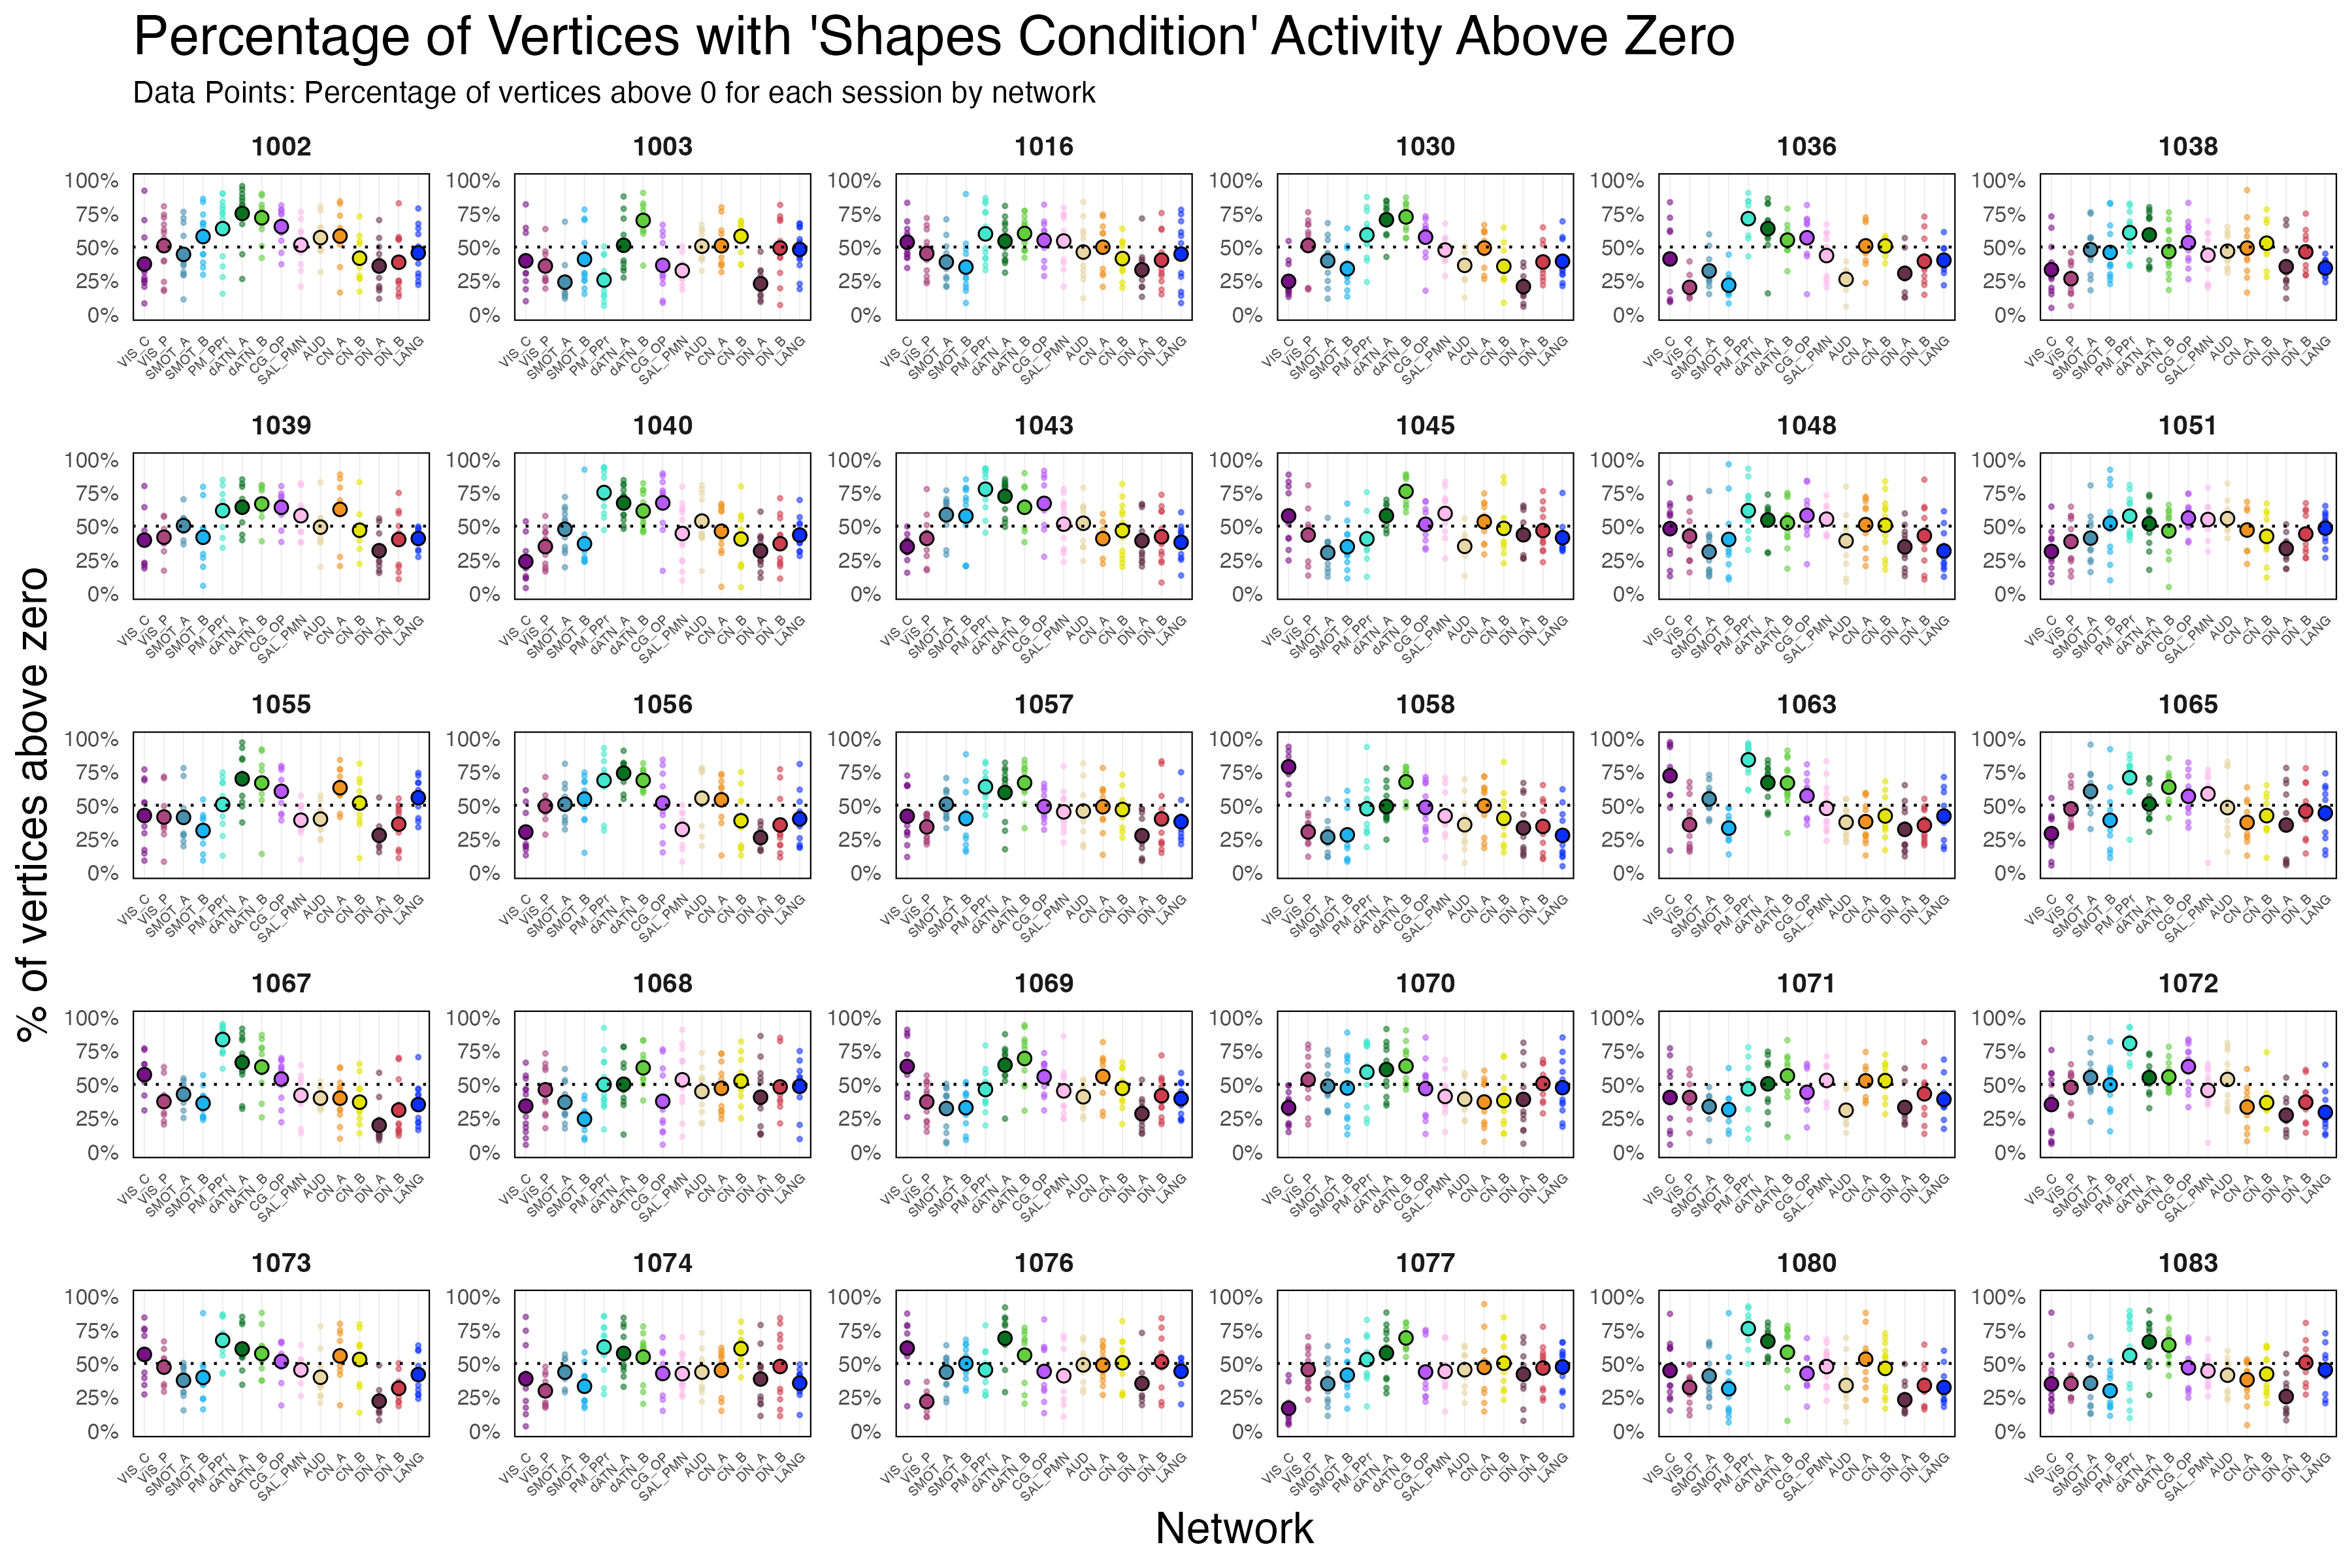
Average Vertex Activity (by subject) Plots. The plots below allow an examination of the average vertex-level activity for each subject (for the visual-central network (VIS-C) and dorsal attention network B (dATN_B)). These plots serve to unpack what is seen in the percent activity above zero plot above — namely that across all subjects most of the ‘emotion processing’ activity at the vertex-level in the visual-central network is on average above zero. The activity within the dorsal attention network B has a more mixed pattern. It is important to note that the subjects selected for section 1 (1003,1030,1039,1063 – the subjects with the highest task performance) exhibit averages where most of the ‘emotion processing’ activity within the dorsal attention network B (dATN_B) is above zero, but this is not true across all subjects, resulting in a reduced average in the group. However, examining the plots for the faces and shapes conditions independently, reveals that the average percent activity above zero is higher and the pattern is more consistent across all the subjects.
Summary of Observations (Section 3)
The visual-central network showed the highest percent ‘emotion processing’ activity above zero followed by dorsal attention network B. No other networks showed notable percent activity above zero. The percent vertex activity above zero in the dorsal attention network B was greater during both the faces and shapes condition than in the Faces > Shapes contrast activity.
Section 4. Quantifying the differentiation of vertex activity between networks
This above analyses focused on verifying that significant activity within a network stems from increased activity across all vertices within a network. While the above approaches allowed for an evaluation of network-level functioning within a network, they did not provide evidence for how well the activity of the vertices is differentiated across the networks. Another method to further investigate network-level functioning is to assess the extent to which the activity within a network can be distinguished from other networks. In other words, do networks exhibit unique activity patterns that enable us to differentiate between them, and is this differentiation quantifiable at the vertex level? This question of differentiating vertex activity between networks will be addressed in this final section.
To examine between-network activity differentiation of vertex-level activity, I calculated a between-network intraclass correlation (ICC) for each session, for each subject. Here the between-network ICC is a ratio of the variability in vertex activity between networks relative to the total amount of variability in vertex activity, which allows for the quantification of how well the activity of the vertices is differentiated by the networks (ICC range: Poor (<0.4); Fair (0.4-0.6); Good (0.6-0.75); Excellent (>0.75)(Koo and Li, 2016)). For a given session, if each network exhibits a unique level of activity during ‘emotion processing’, and further this network-level structure is observable within the vertex-level data, then the ICC will be high. Again this is a between-network measure and will be high when the vertex activity is well described by the networks. I wanted to have a meaningful comparison for the between-network ICCs observed, so additionally calculated ICCs for data in which 50% of the vertices in each network were randomly assigned to a different network. Randomizing the vertex-level data in this way should disrupt network-level structure present in the data, if such structure is present. If the ICCs for the original data are significantly higher than the ICCs for the 50% randomized data, this would suggest that the vertex-level data is differentiated by network and thus the networks inherently exhibit unique levels of activity.
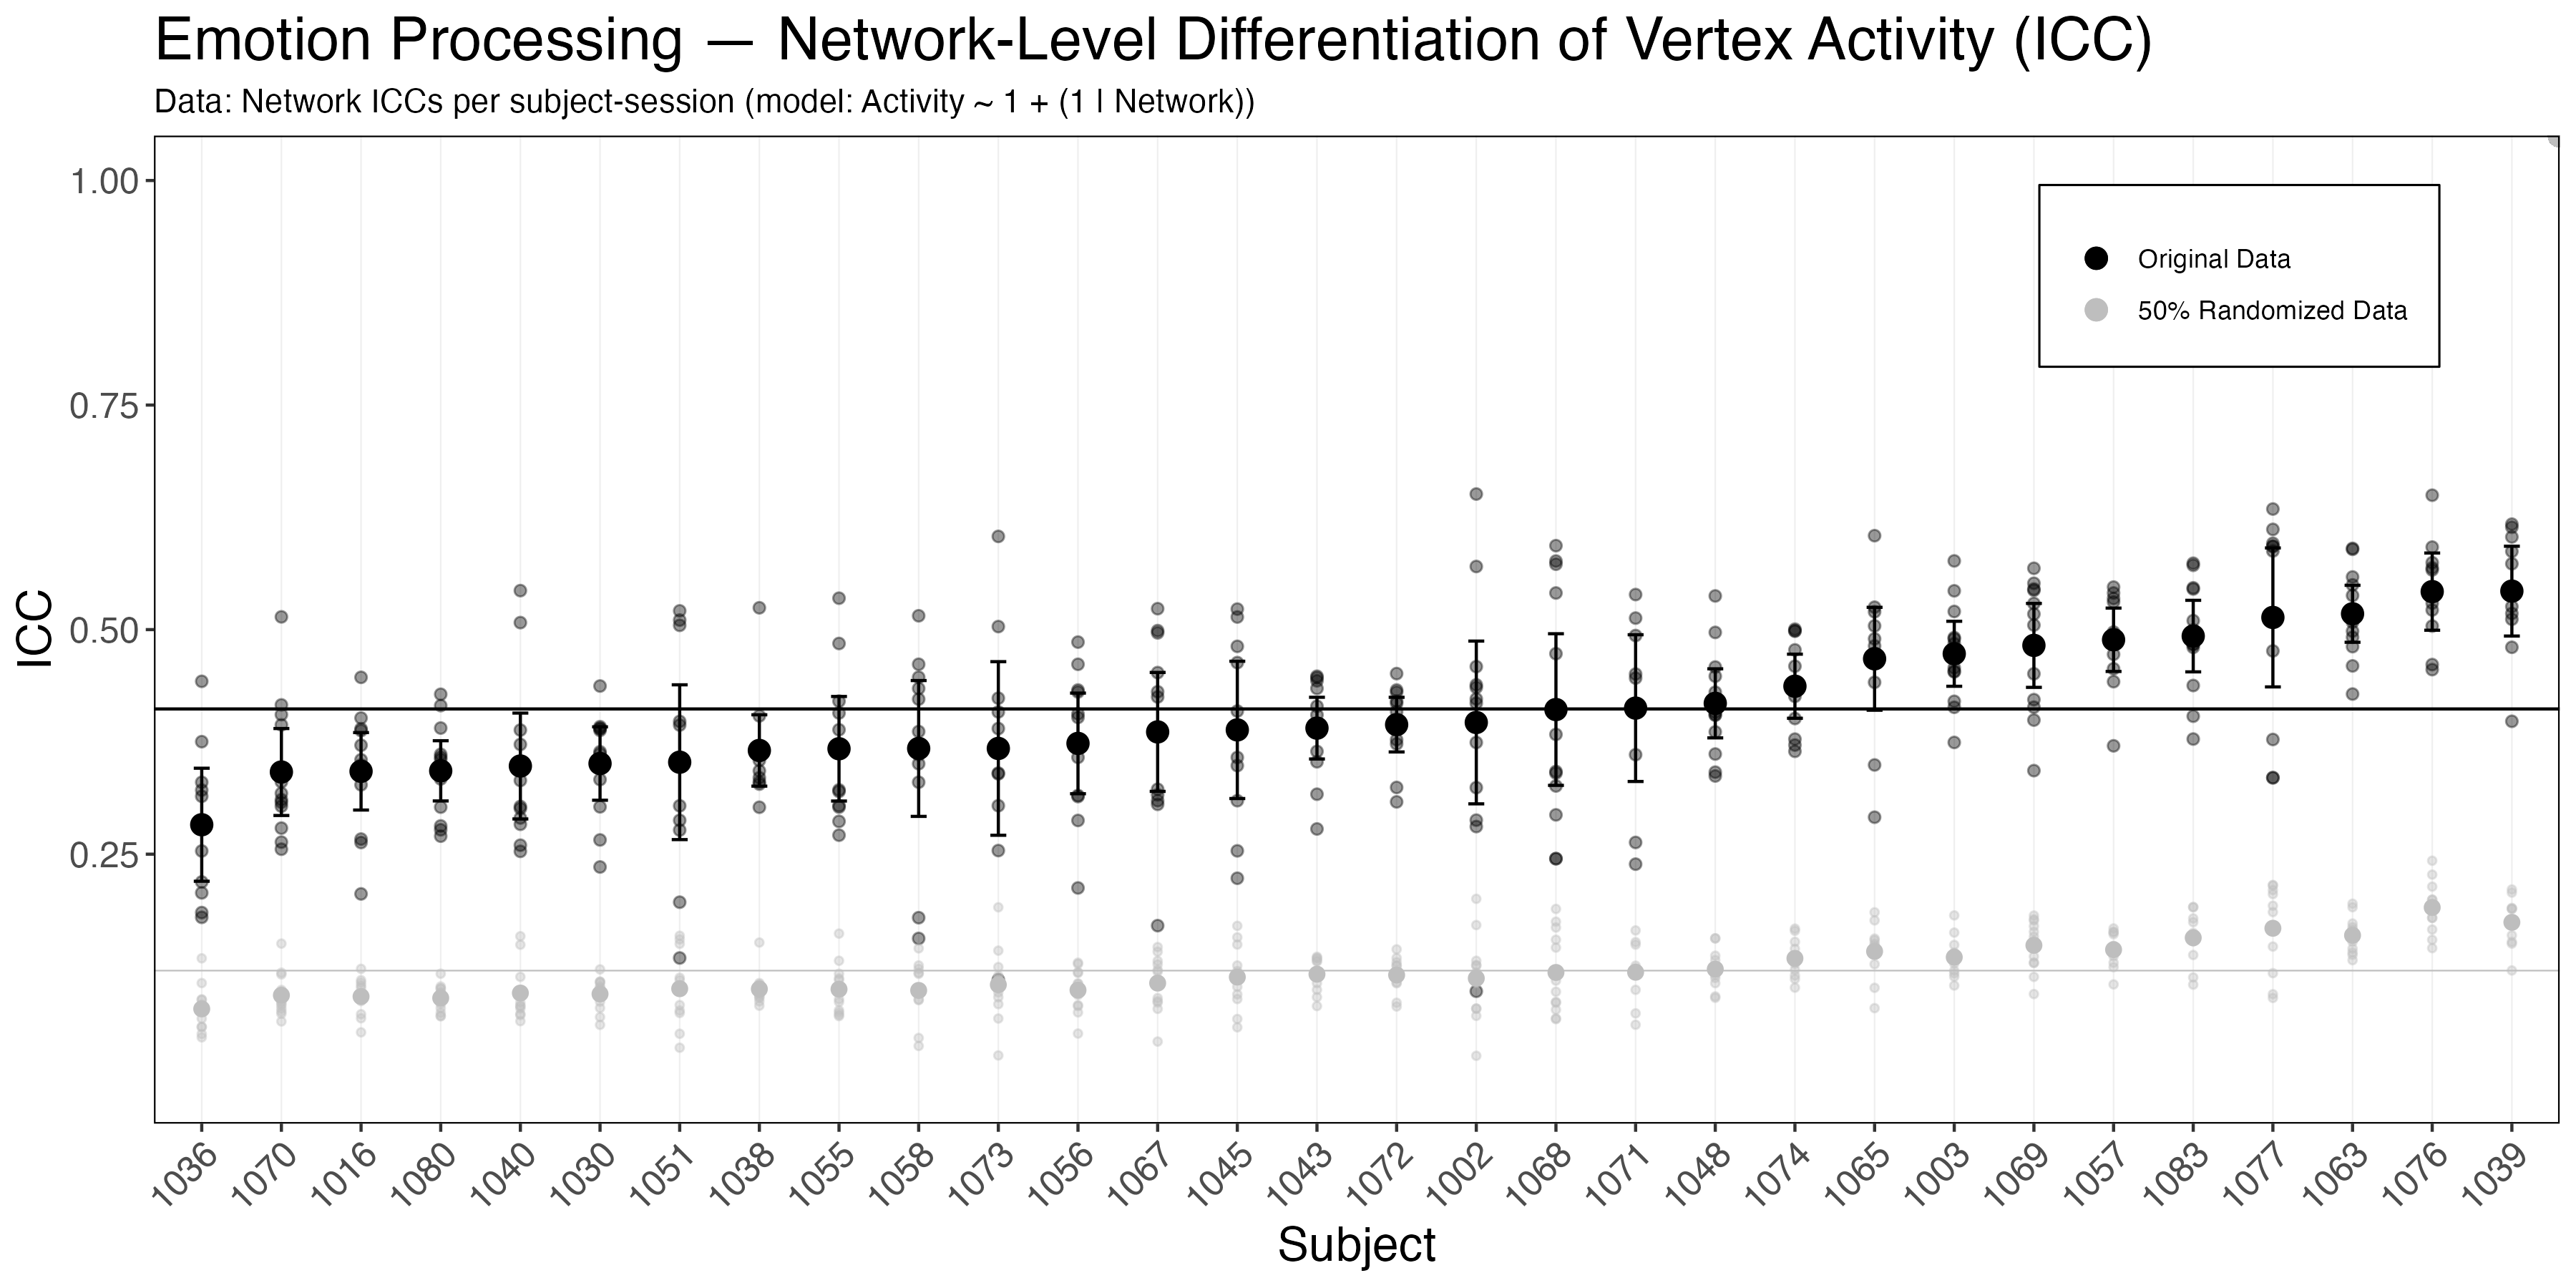
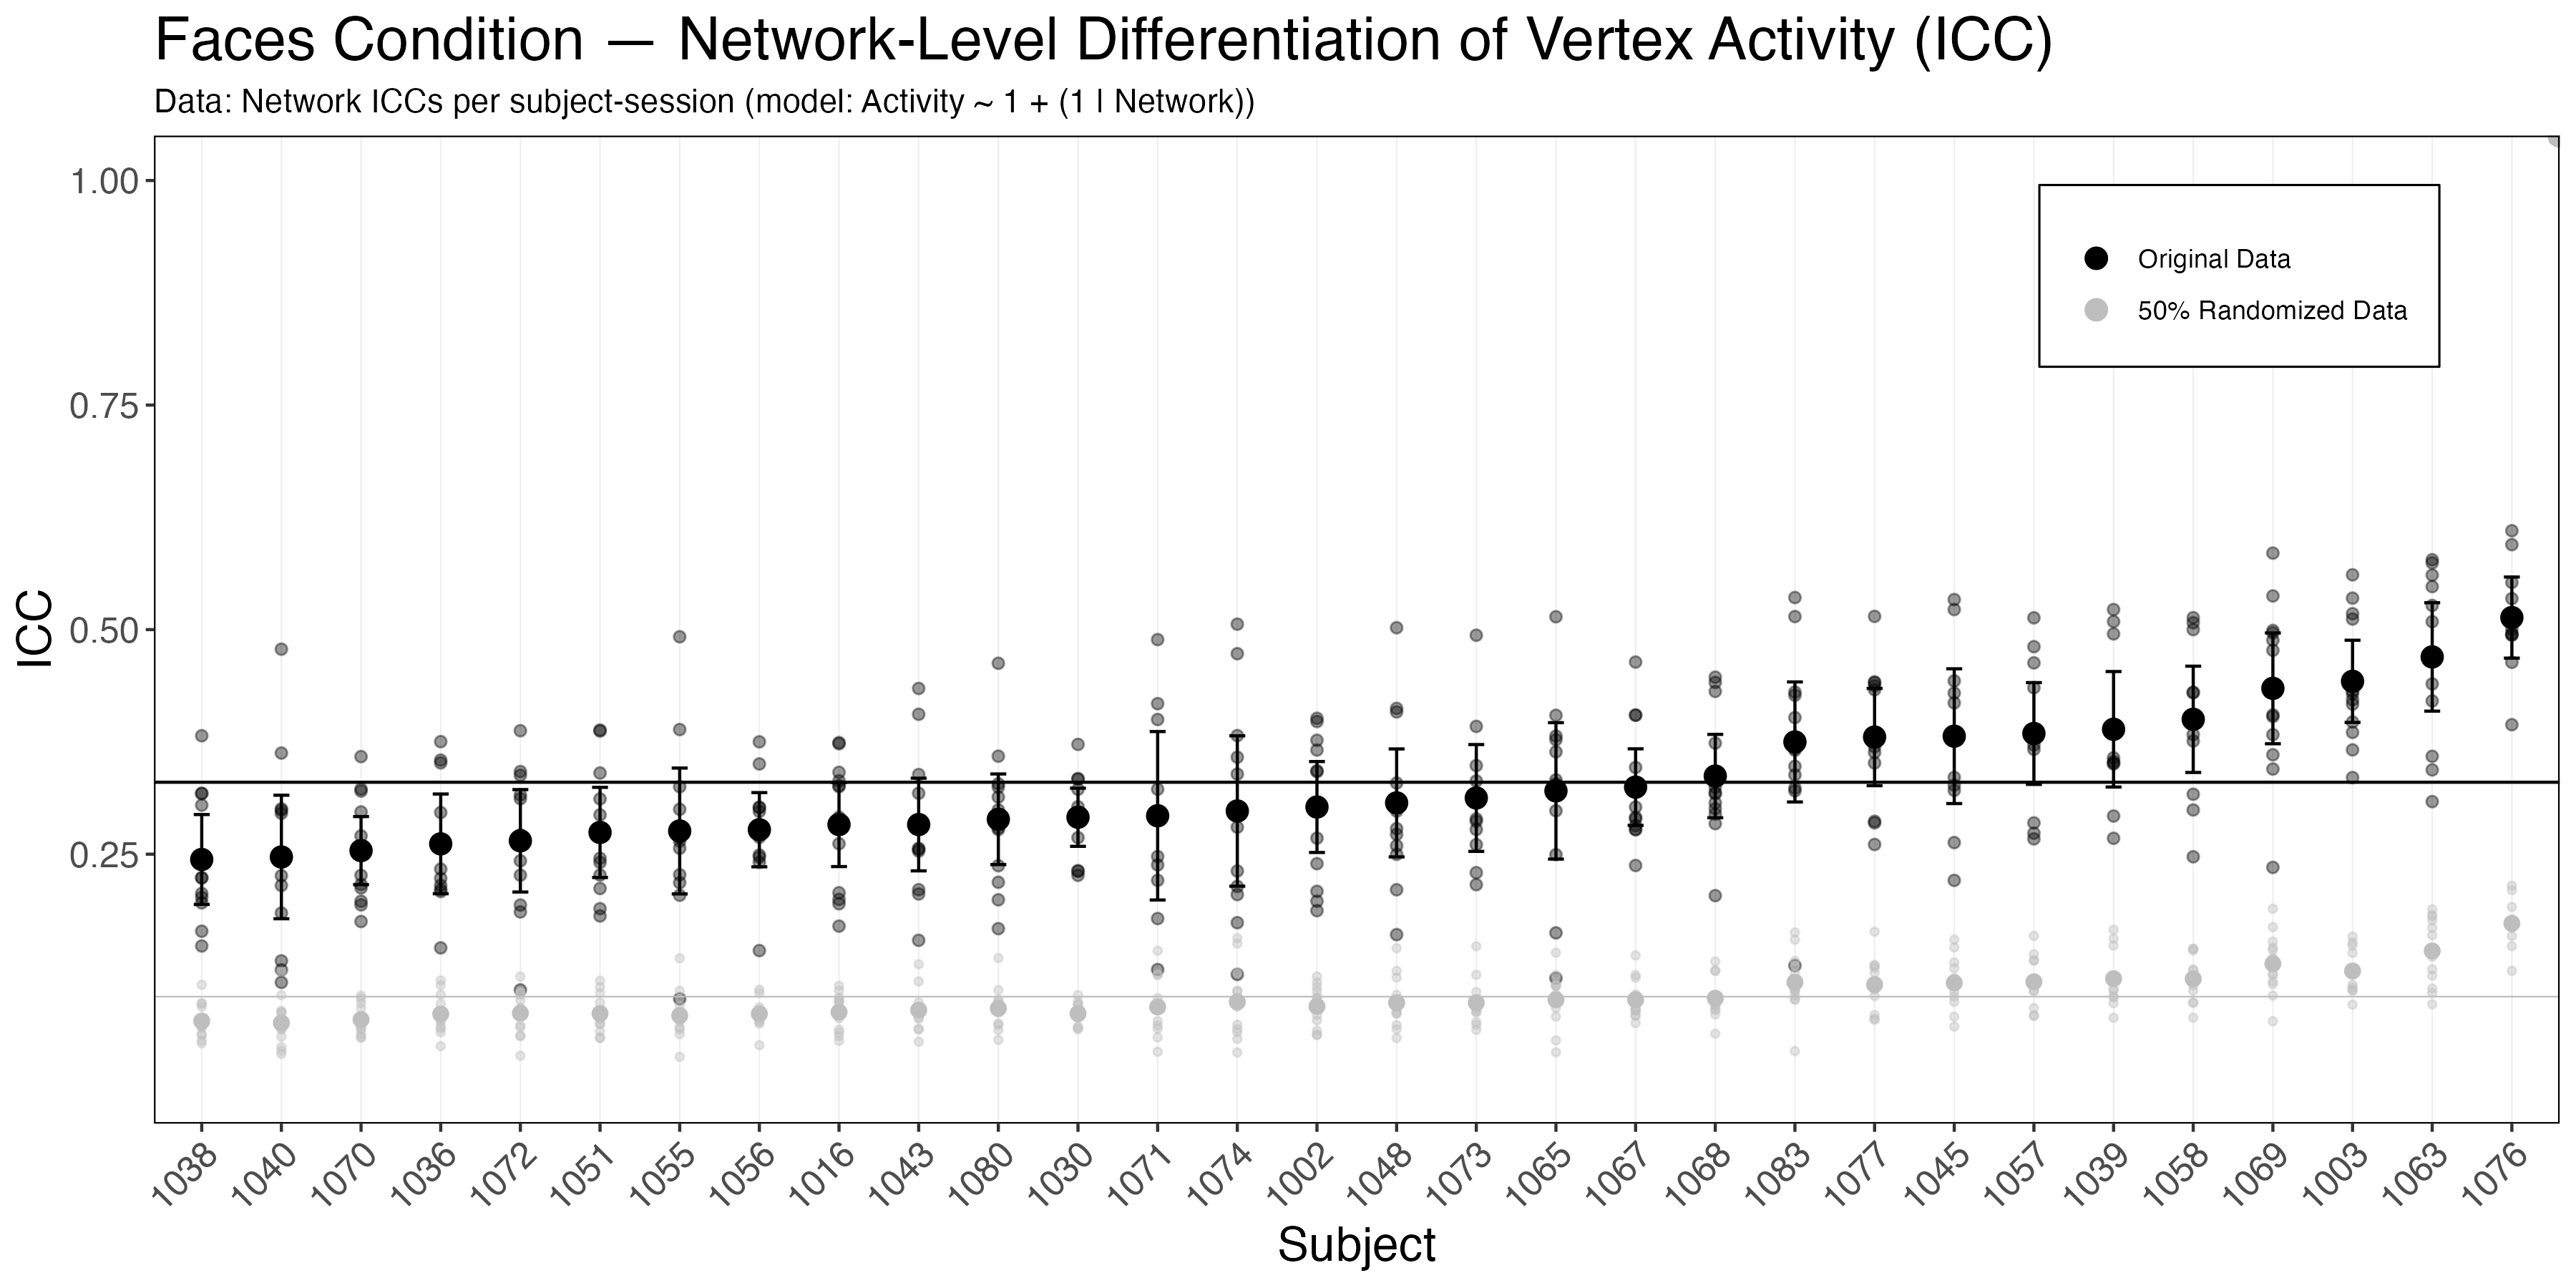
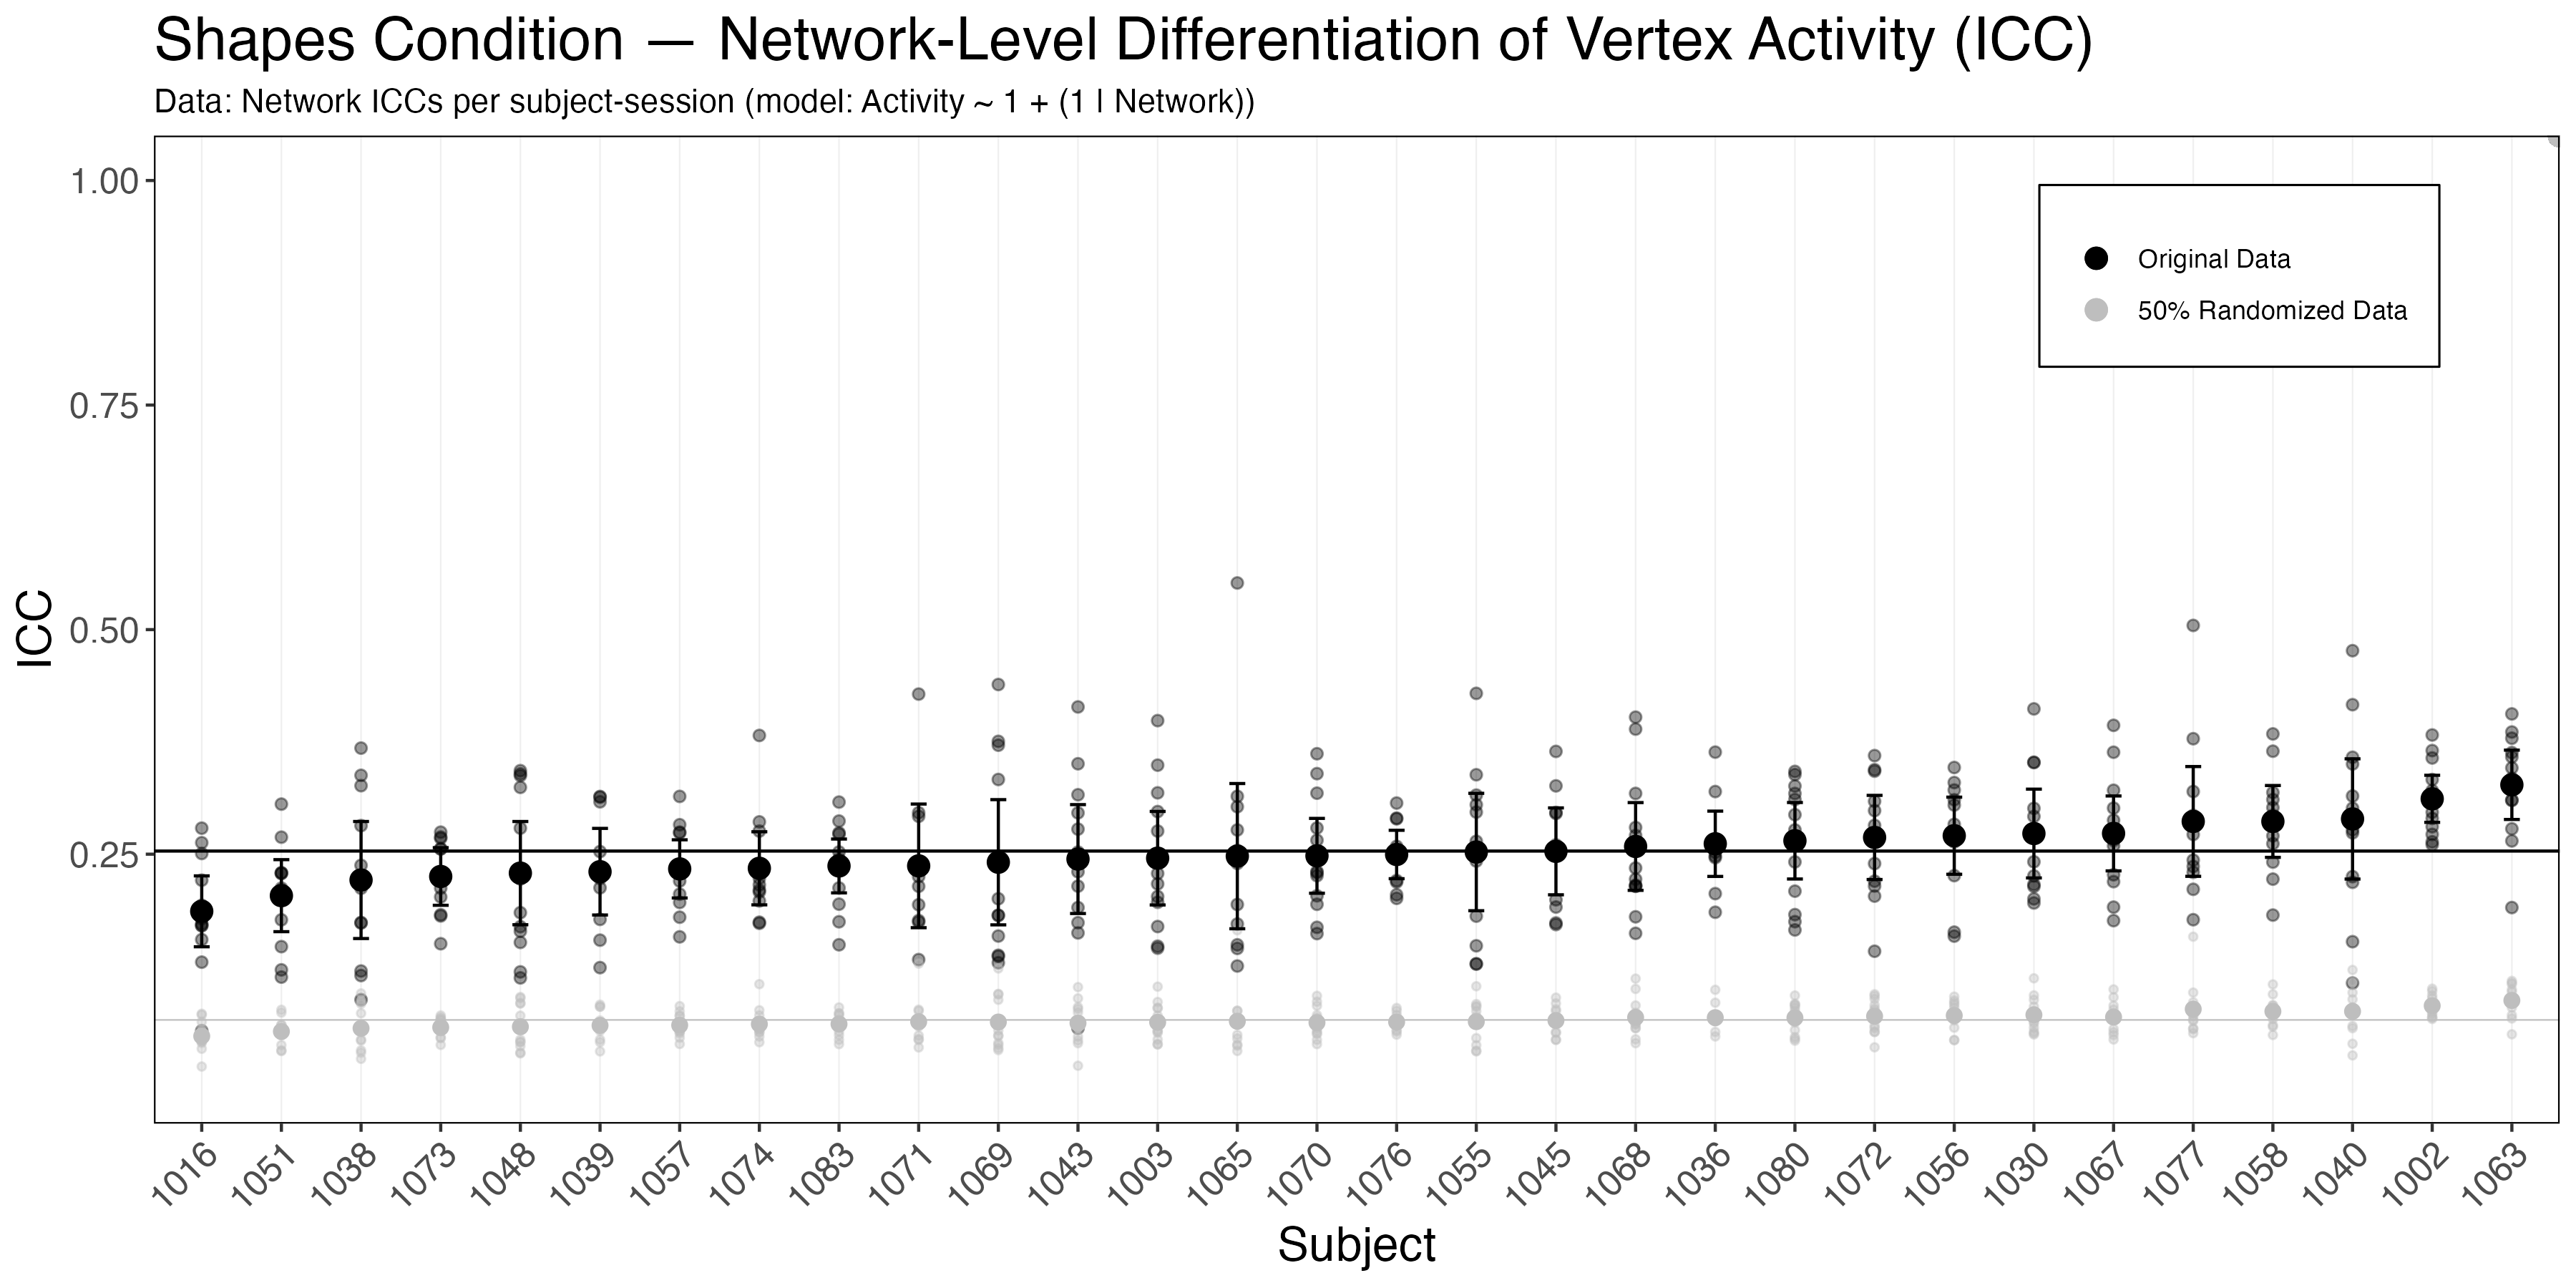
The plots below display the between-network ICCs obtained from each subject-session for the original data (black) and for the data where 50% of the vertices in each network were randomized to a different network (light grey). Each point in these graphs represent how well vertex-level activity within a session for a given subject can be differentiated between the networks. The group average plots show the average ICCs between the two data sets and the by subject plots break down the group average plot so you are able to see how this effect plays out across all the subjects in the sample. Data for each of the conditions is also displayed so that comparisons between task condition activity relative to the final contrast (ie.Faces > Shapes activity) can be made.
Between-Network Vertex Activity Differentiation
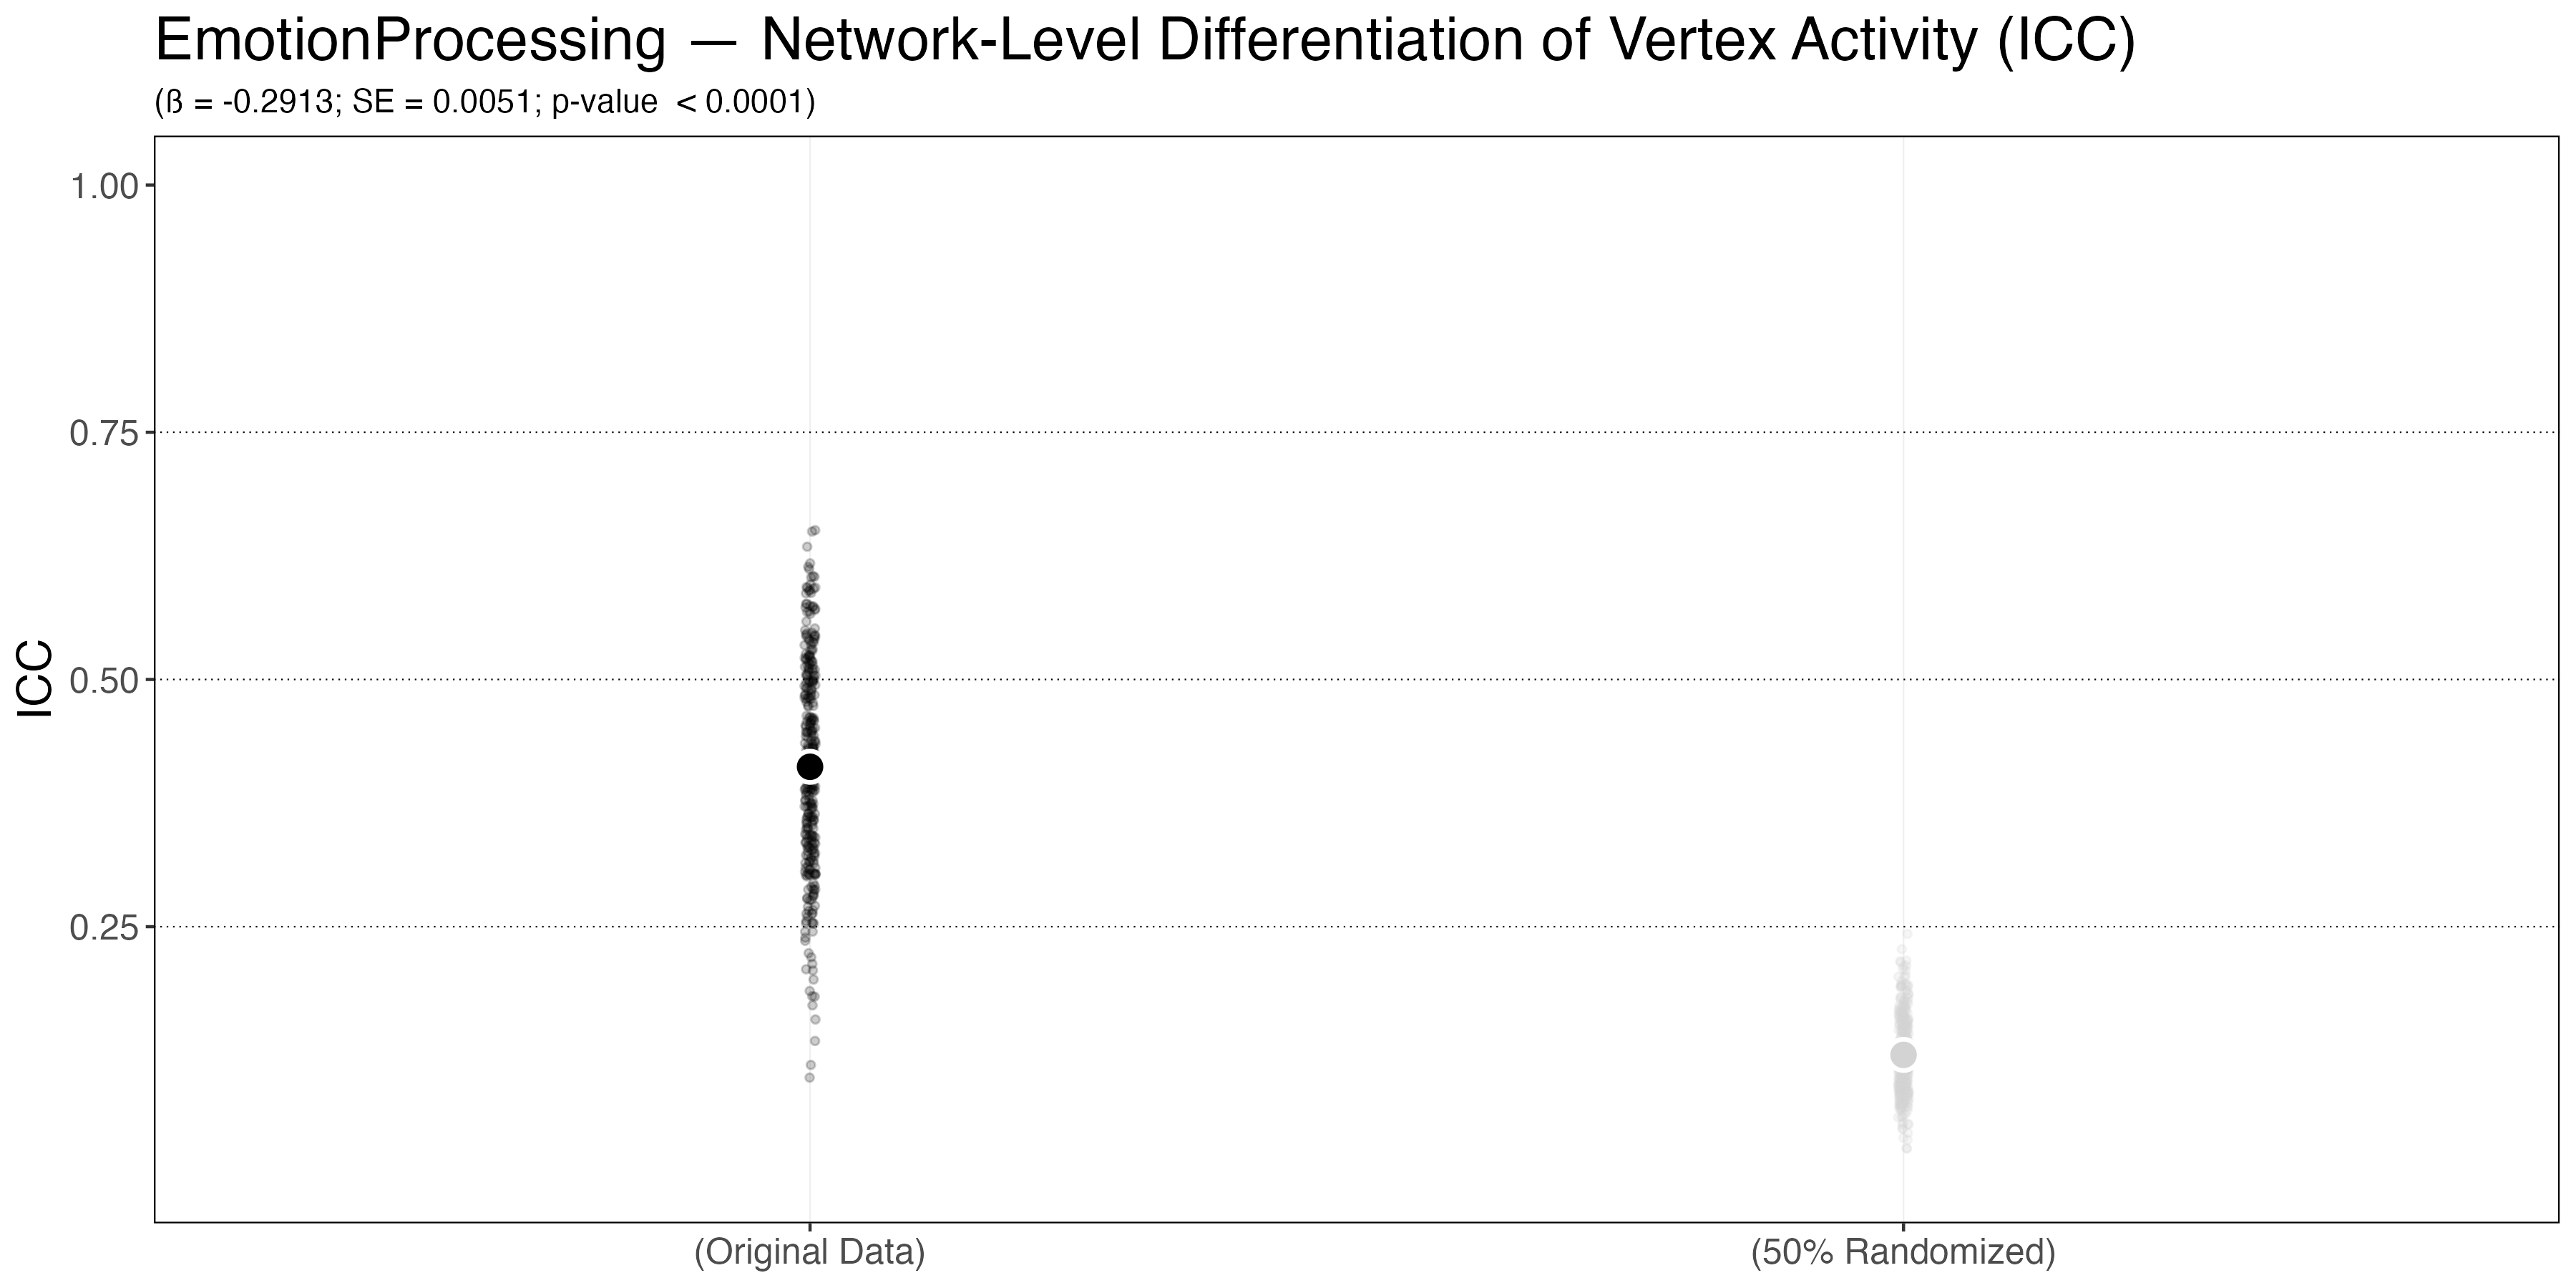
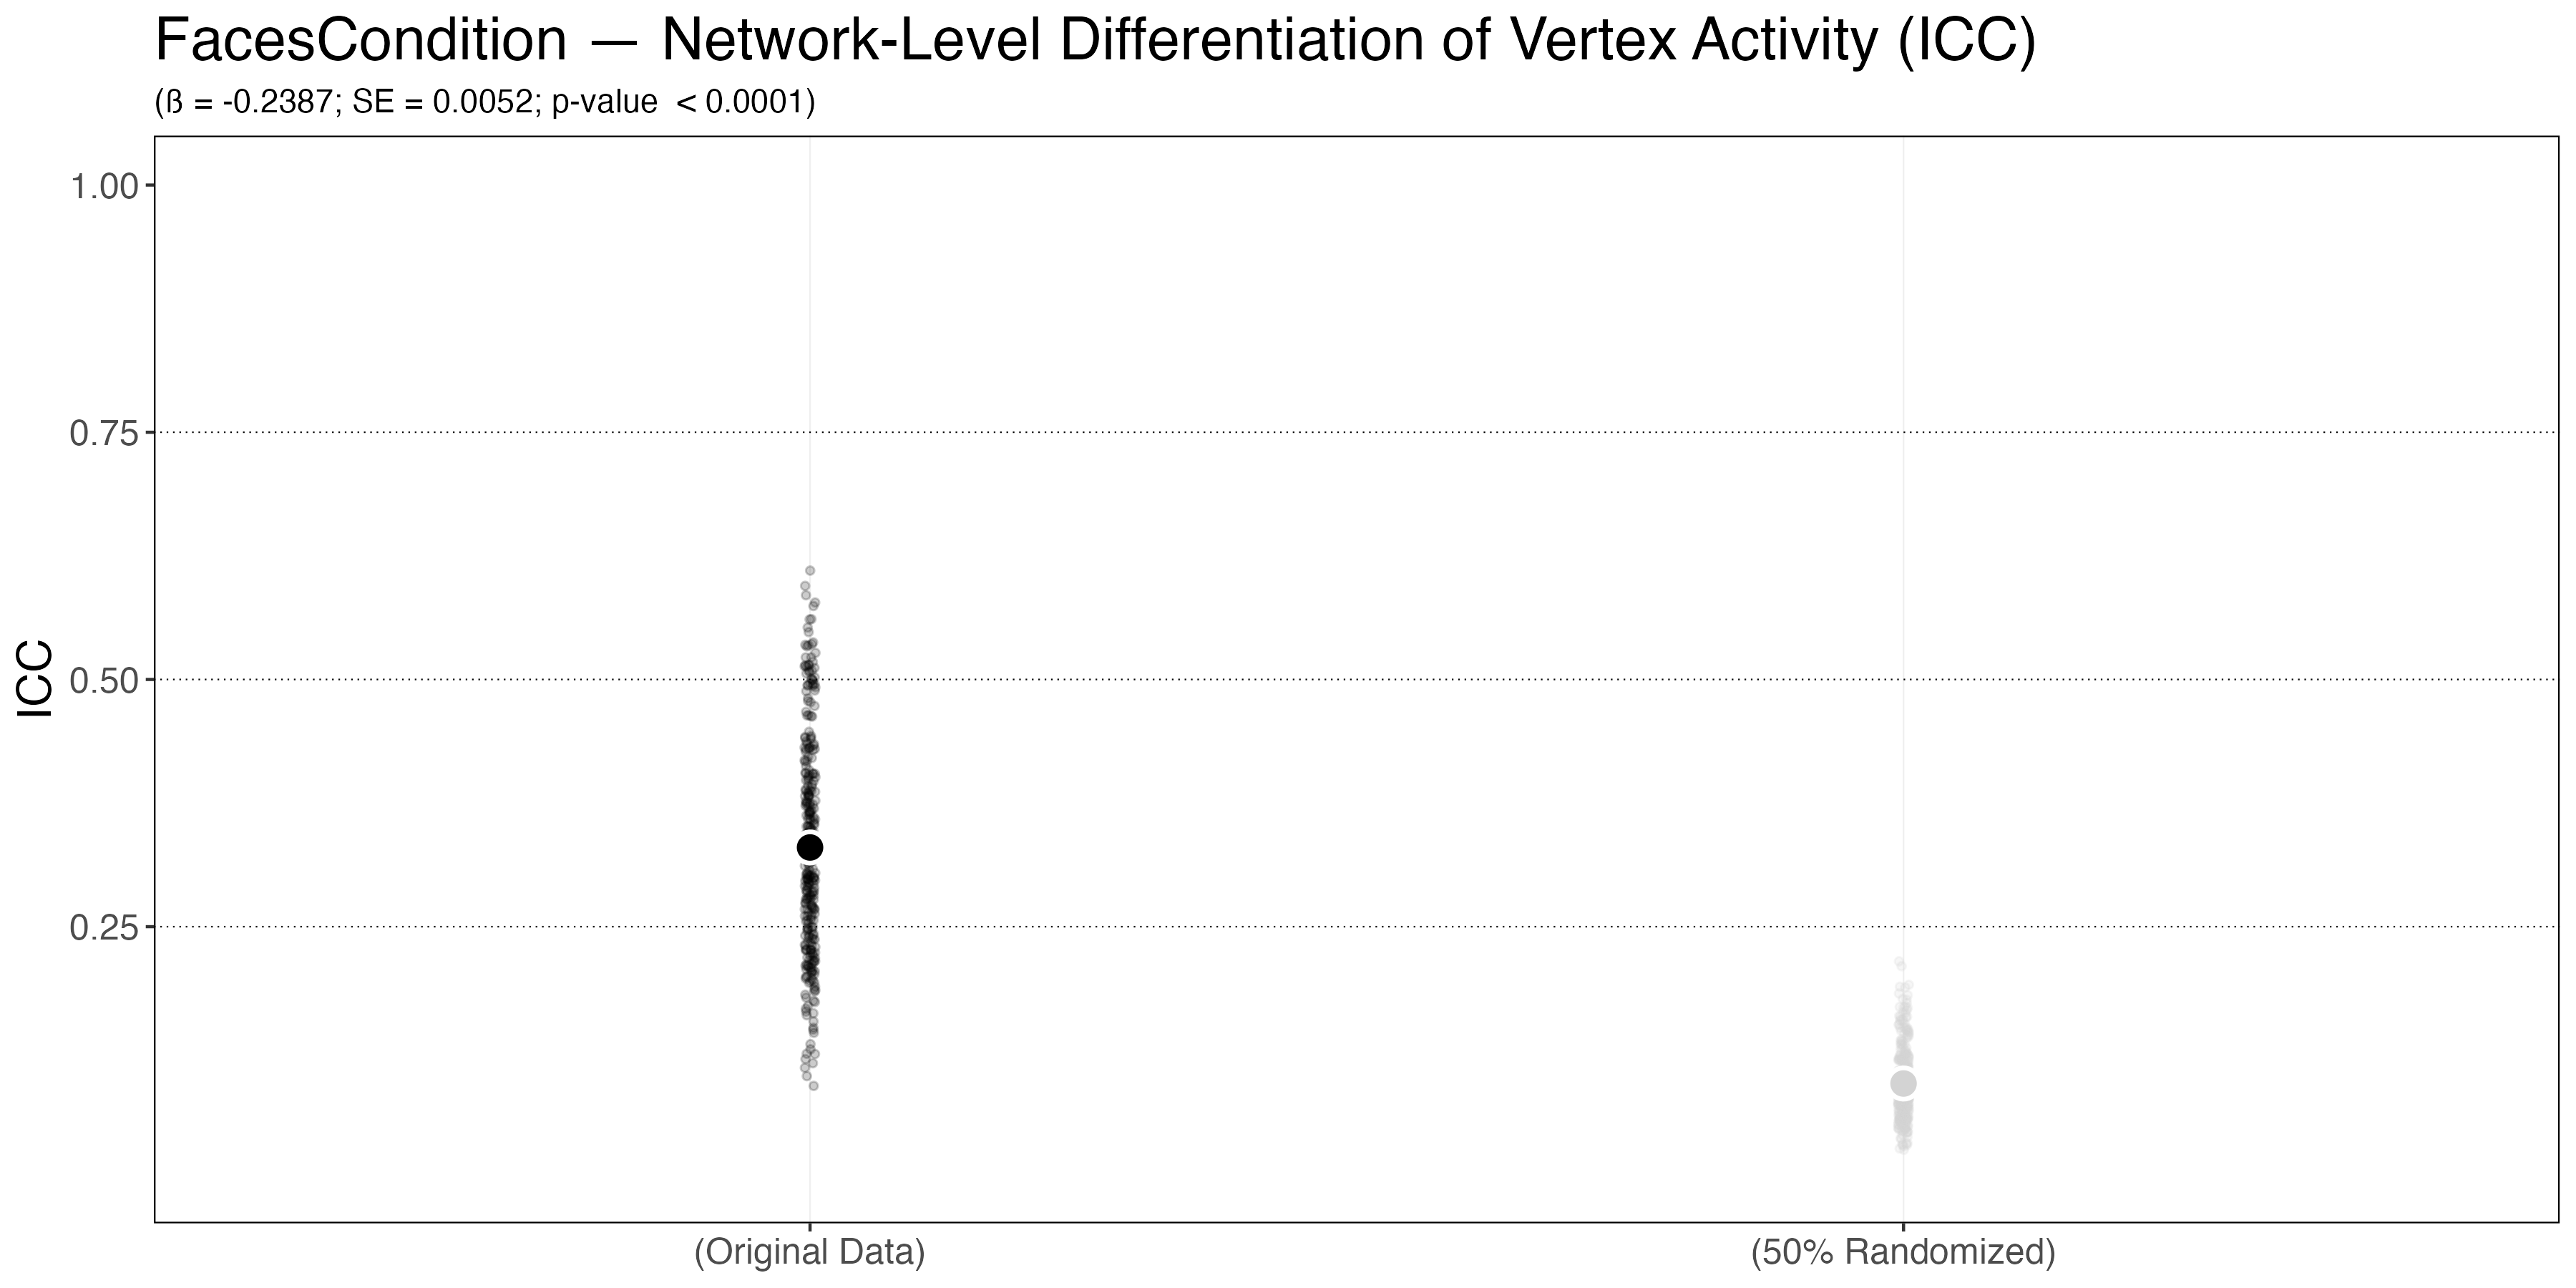
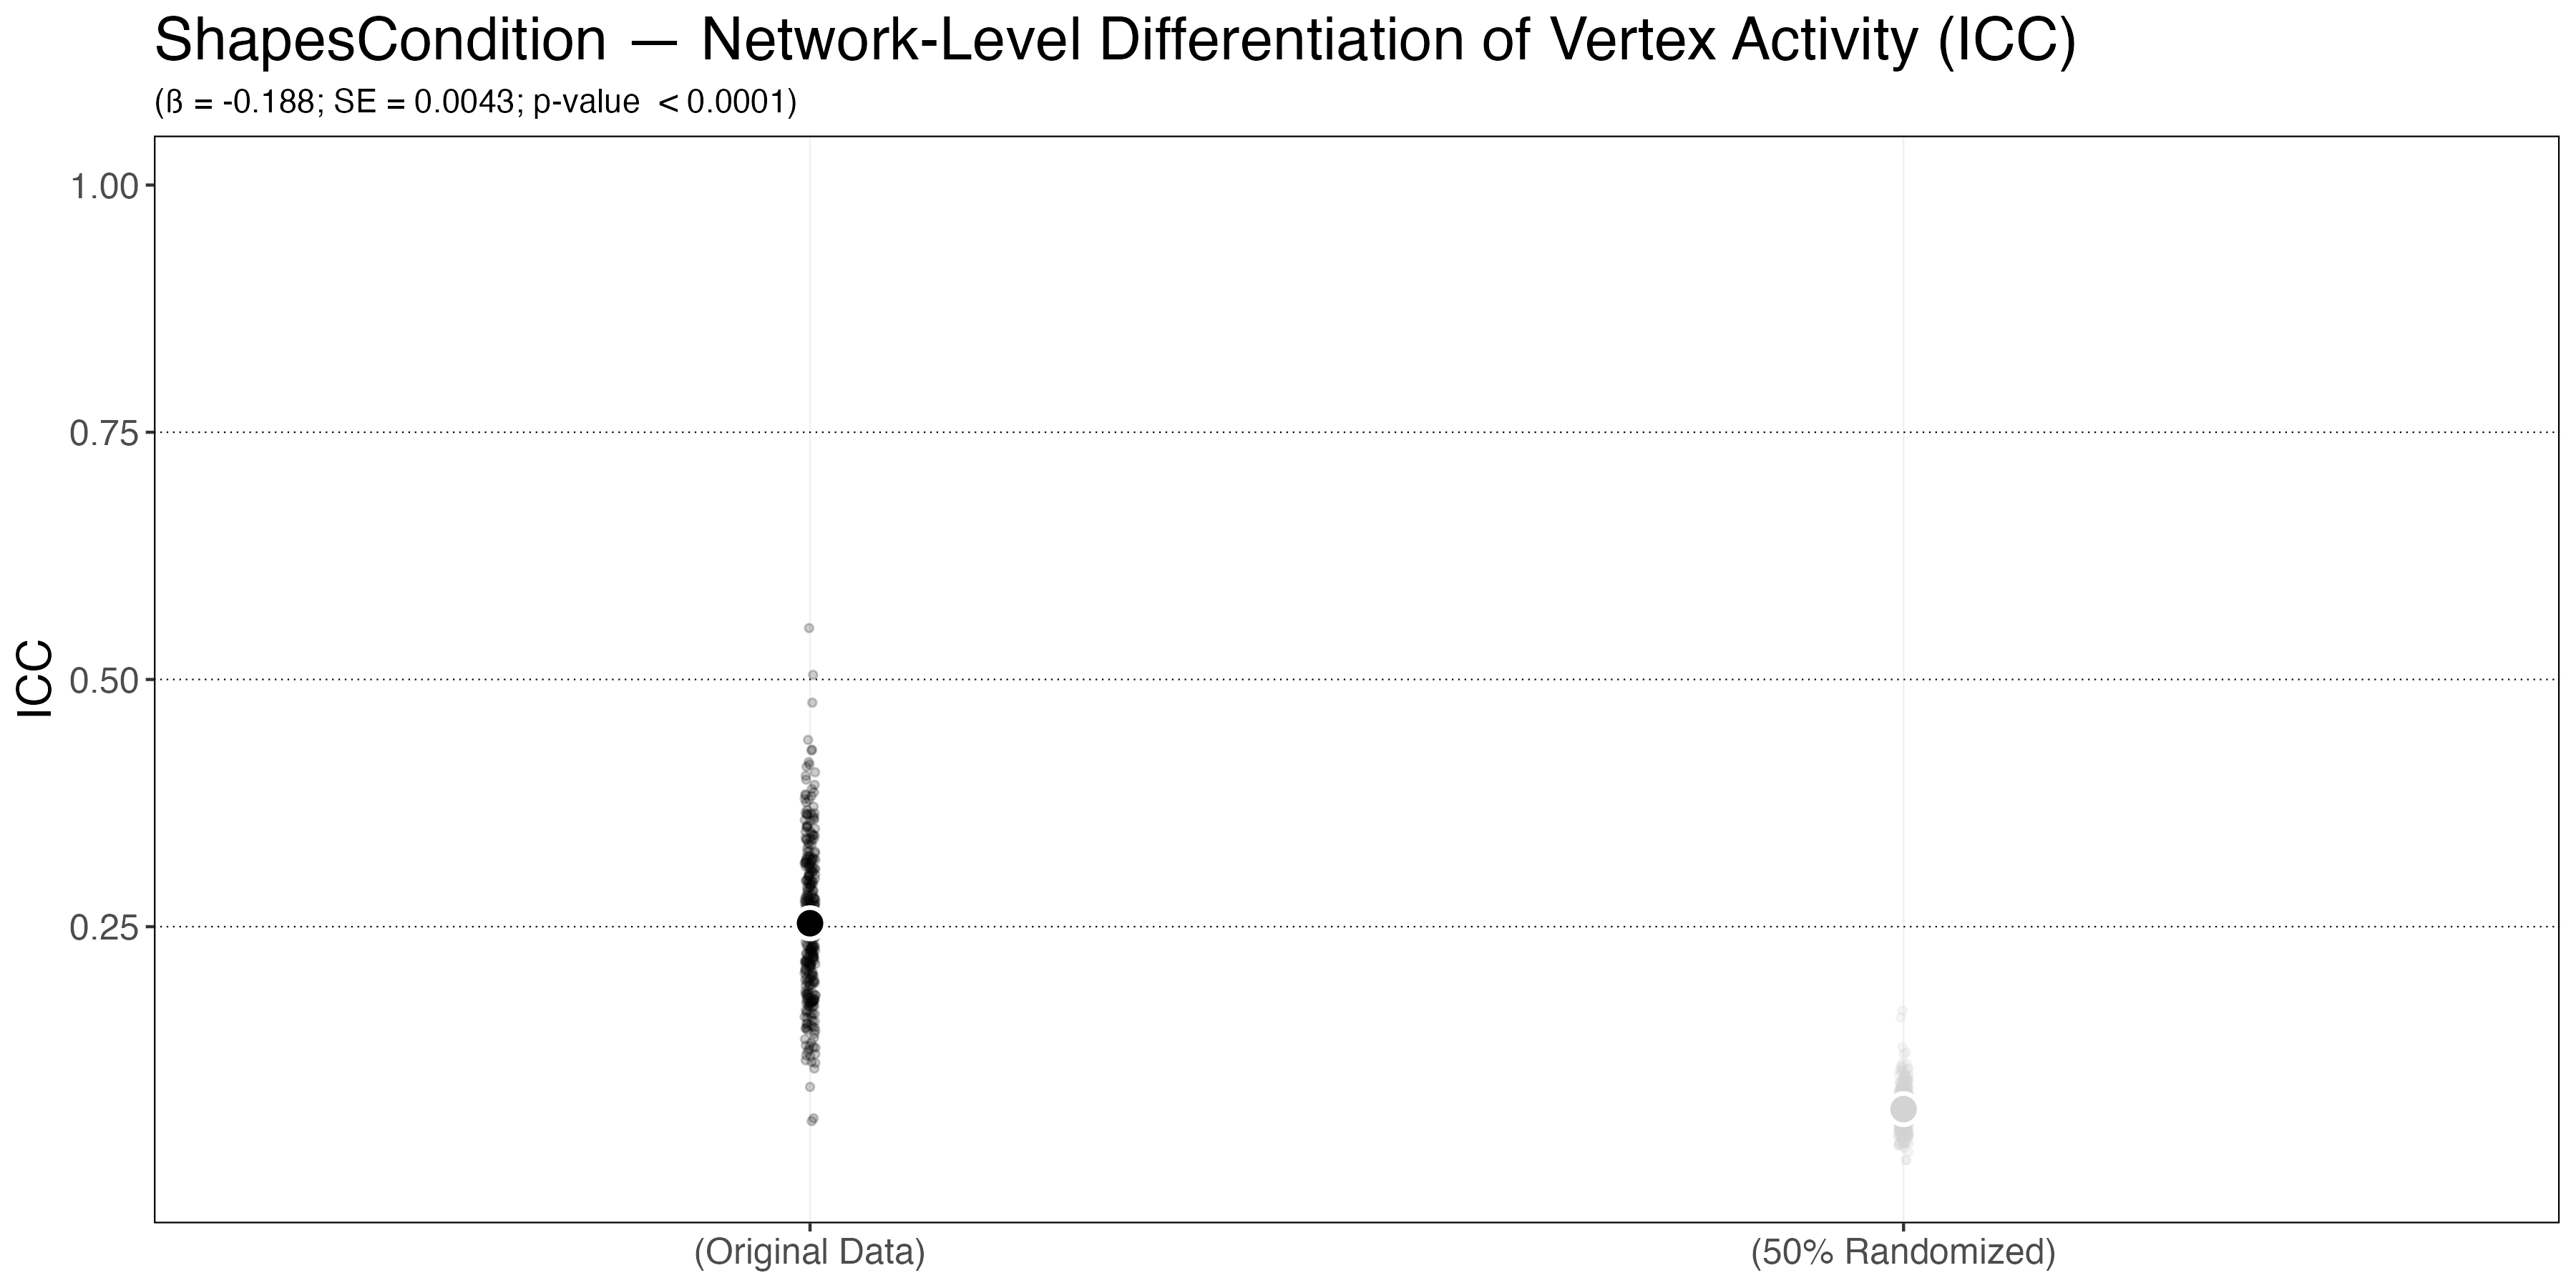
Observations. As seen in the group average plots above, the network ICCs for the original data (black) are significantly higher than the network ICCs for the data where 50% of the vertices in each network were randomized to a different network (light grey). This is true in the ‘emotion processing’ activity (b = -0.29, SE = 0.0051, p < 0.0001), as well as the faces (b = -0.24, SE = 0.0052, p < 0.0001) and shapes (b = -0.19, SE = 0.0043, p < 0.0001) conditions activity. This indicates that randomizing 50% of the vertices significantly decreases the network structure in the data. If the original data did not exhibit network structure, then randomizing 50% of the vertices would not have had a significant effect on the network ICCs.
On average, original data exhibited between-network ICCs of 0.43 implying fair differentiation of vertex activity by network within sessions. Interestingly, the conditions activity ICCs were lower than the network ICCs for the Faces > Shapes activity, with the faces condition ICCs averaging 0.33 and the shapes condition ICCs averaging 0.25. This indicates more network differentiation in the Faces > Shapes contrast than in the individual conditions activity alone.
The by subject plots illustrate that network-differentiation, while moderate across all the subjects in the sample, also shows notable between-person variability. Some subjects show good network differentiation in the ‘emotion processing’ activity (ie. Subject 1039 with an network ICC of 0.5), while other subjects show poor differentiation (ie. 1036 with a network ICC of 0.26). Both of these subjects had above average task performance, so poor performance on task would not explain the lack of network differentiation.
Summary of Observations (Section 4)
In summary, between-network differentiation further supported the presence of network-level structure in the vertex activity data. Network-level differentiation of vertex activity was significantly greater in the original data that in the 50% randomized data, and the network ICCs in the ‘emotion processing’ were moderate. Taken together, these result corroborate the visual evidence observed in sections 1 and 2, and suggest that indeed, the vertex activity data shows meaningful network level structure.
Page in Review:
Sections 1 and 2 illustrated the difference between network-level and region-level vertex activity during the emotion processing task. Section 1 showed network-wide increases in vertex activity in both the visual-central network and dorsal attention network B, suggesting significant network-level engagement. Section 2 highlighted isolated region-level activity in somatomotor network A, illustrating what vertex activity looks like if only a single region within a network is active. Quantitative analysis of vertex activity in sections 3 and 4 supported the presence of network-level structure, with the visual-central network and dorsal attention network B showing the highest percent of ‘emotion processing’ activity above zero and further the session data exhibiting meaningful between-network differentiation (fair ICCs). Taken together, these findings suggest that the observed ‘emotion processing’ activity within the visual-central network and dorsal attention network B is not due to isolated region-level activity, but rather reflects network-level engagement and further that in general a network-level approach may be a meaningful framework through which activity in this task can be understood.
UP NEXT: Project 2: Disussion
More Examples:
Dive in here to see all session-level vertex plots and boundary-activity overlaps for the example subjects DEEP DIVE: Session Vertex Activity (ALL SESSIONS - Example Subjects)
Dive in here if you would like to review vertex activity for all subjects (averaged across sessions) DEEP DIVE: Vertex Activity Averaged Across Sessions (ALL SUBJECTS)