Topology Comparison
Primary Question: Where does the fusiform fall within the network parcellations?
Fusiform x Networks
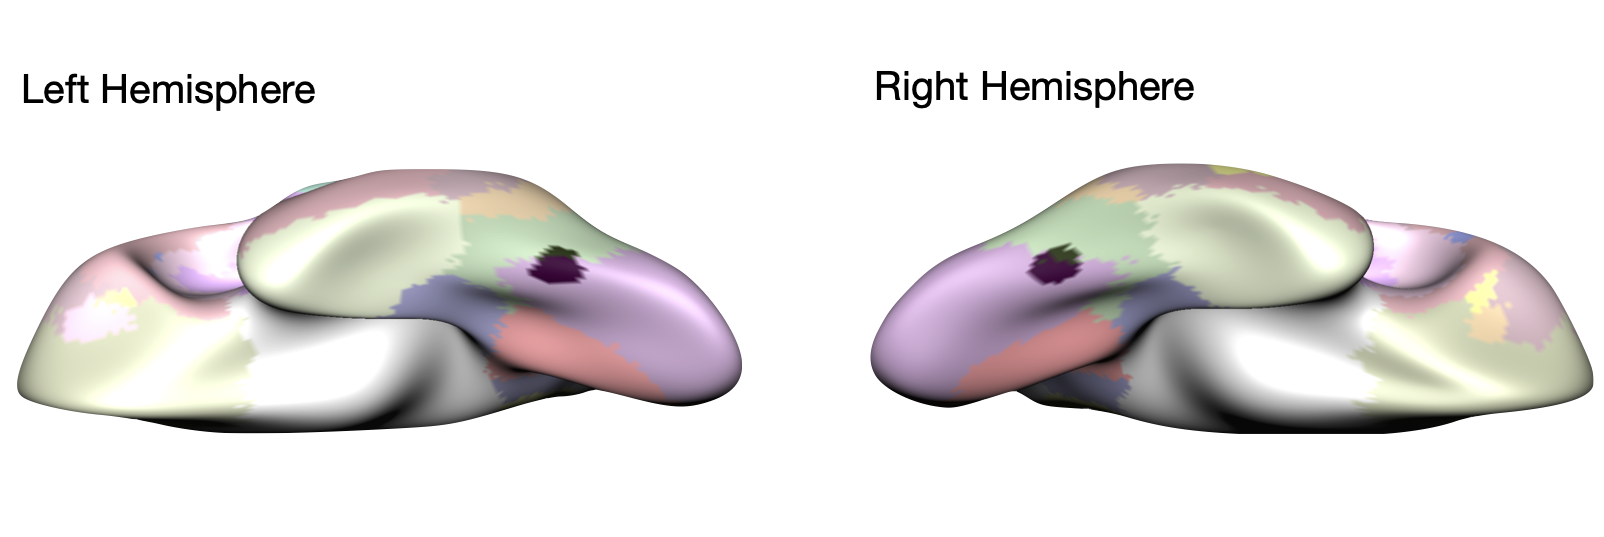
The fusiform (dark grey region) primarily falls within the visual-central network. The fusiform also exhibits slight overlap with the dorsal attention network (dATN-B in the individualized parcellation and DorsAttenA in the group parcellation). Therefore, it is possible that the observed network-level activity is driven by activity in this specialized region. Given the visual-central network, which primarily contains the fusiform, exhibits the most network activity and the dorsal attention B network, which only has a small potion of overlap, exhibits a smaller increase in activity, it is possible that this is the case.
In order to evaluate this possibility, in the next section the activity of each vertex that falls within each network will be examined. When creating the average network activity values, used in the boundary activity analysis, the activity from every vertex that fell within a given network boundary (most individualized networks are composed of ~3,000 - 4,000 vertices) was averaged. In the next analysis, instead of collapsing to the level of a network, I will examine the distribution of vertex activity within each network. By examining the activity at this level we will be able to evaluate if all vertices that fall within the network are responding in a similar way (implying network-level functioning) or whether there is notable variability in how the vertices are responding (potentially implying region-level functioning driving the observed network activity). Basically, we will be examining whether a select subset of the vertices exhibit dramatic increases in activity that dissociate from the rest of vertices in the network.
Primary Question: Is the observed network activity due to the whole network responding to task or are specific regions that fall within a given network driving observed increases in activity?